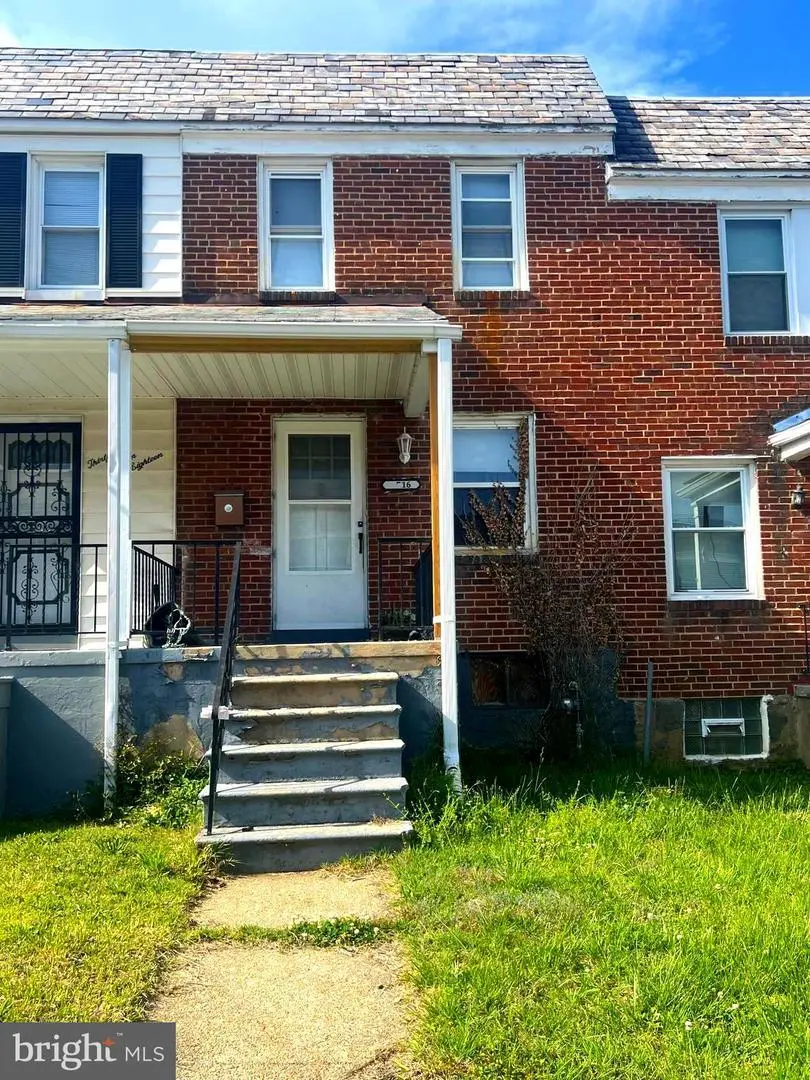
3716 Flowerton Rd · Baltimore, MD
Flood risk 1/10 · Minimal
- FEMA flood zone
- X (unshaded)
- Chance of flooding over 30 yrs
- 0.0%
- Est. flood insurance / yr
- $473 – $860
Fire risk 1/10 · Minimal
- Est. fire insurance / yr
- $755 – $1,403
Heat risk 7/10 · Major
- Hot days now (above 103°F)
- 7 days/yr
- Hot days in 30 yrs
- 15 days/yr
Wind risk 5/10 · Moderate
- Chance of severe wind over 30 yrs
- 24.0%
Air-quality risk 3/10 · Minor
- Unhealthy air days now
- 3 days/yr
- Unhealthy air days in 30 yrs
- 4 days/yr
Risk factors via First Street. Map © Google.
Why this score? — see what drove the B+ grade
The composite is a weighted blend of 9 inputs, each scored 0–100. Each bar is that input's sub-score; the figure is the points it added to the 100-point composite (weight × sub-score).
- Cash flow +30.0/30.0
- ARV discount +15.0/15.0
- DSCR +10.0/10.0
- 1% rule +9.3/10.0
- Rent growth +3.8/5.0
- Livability +3.8/5.0
- Condition / age +2.5/5.0
- Schools +1.0/10.0
- Appreciation +0.0/10.0
$125,000
🖨 Deal sheet 📄 Offer letter ✓ Due diligence
Listing remarks MLS
Well maintained, all brick townhome in hot Edmondson Village. Compare to other listings and you will find this unit well priced, larger than most and in good shape with only finishing touches left. Seller in process of updating. New roof! New Windows! Freshly painted throughout! Large rooms with w/ w carpet. Seller to contribute $$ towards closing with full price offer. Priced to sell! Call CSS
Key facts
- Near shopping
- Near the beltway
- Near inner harbor
Tags
Property features AI
Finance
- Other: Below-grade area: 570 (assessor); Above-grade finished area: 1,140 (assessor)
- Financial info: Ground rent payment (semi-annually); Ground rent amount semi-annual: $96; Ownership is Ground Rent
Exterior
- Parking: Other parking
- Utilities: Public water; Public sewer
- Home design: Interior Townhouse/Rowhouse
- Construction: Brick construction; Slab foundation; Built year per assessor
- Exterior features: Interior townhouse/rowhouse; Above-grade and below-grade structures noted
Interior
- Kitchen: Gas oven/range; Refrigerator
- Bedrooms: Three bedrooms on the upper level
- Bathrooms: One full bathroom
- Heating & cooling: Radiator heat; Oil-fired heating; Natural gas hot water
- Interior features: Partially finished basement with connecting stairway and walkout stairs; Porch(es)
Neighborhood map
What this means for you Summary
Snapshot
- This is a 3-bed/2.0-bath townhouse listed at $125k.
Deal economics
- At list price, monthly cash flow is $470 ($6k/yr) — positive.
- The deal already cash-flows at list — no discount required.
- Meets the 1% rule at list price ($2k rent vs $125k).
- Recommended offer: $121k (3.0% below list) — sets the bar for market timing.
- Cap rate 10.8% vs local median 6.0% in Baltimore — top-decile yield for the area; either an underpriced asset or a hidden risk that comps aren't pricing in. Stress-test before assuming the spread holds.
Location & tenants
- Location reads 76/100 on livability (#90 in MD, #3,396 nationally) — a middle-class / working-renter tenant base. Strengths: amenities A+, commute A+, housing A+; Watch: schools D, crime F.
- Baltimore City Public Schools (urban): math 7% / reading 16% proficiency, ranked #24 of 24 in MD (top 100%) — low school quality limits family demand, transient renter base, plan for 1-2y turnover; 79% free/reduced lunch — lower-income household profile, screen leases tightly.
- Market conditions: Rents rising fast (+5.4%/yr); 252 active listings in the ZIP; 40 comparable units currently listed for rent nearby; rentals at typical pace (median 24d on market — plan ~3-4 weeks tenant-placement turnaround); 42% of comp listings sitting > 30 days — soft ceiling on asking rent; 1,273 units permitted in Baltimore city in 2024 (1,104 in 5+ unit buildings).
- This rent runs 36% of the median local income ($60k/yr) — at the standard rent-burdened threshold; future hikes will face affordability resistance.
Forward outlook
- Local home prices are declining (-3.0%/yr); year-one equity from $864 of loan paydown is wiped out by about $4k of value loss. Plan a longer hold.
- Baltimore County population projected to shrink 4% by 2050 — rents likely to lag national; underwrite the cash flow, not the appreciation.
- At projected returns (-3.0% appreciation + 5.4% rent growth), your $35k cash investment doubles in ~7 years — after that, you're playing with house money.
Negotiation context
- It's been on market 39 days — a 3% lower offer ($121k) is reasonable based on typical stale-listing flexibility.
- 3 sale attempts since 21y ago with the ask held roughly flat each time — persistent listings suggest the price (not the market) is what's stuck; bring a comps-based counter.
- Current owner paid $100k; 25% above their basis — modest negotiation headroom, anchor on the comps not their cost.
Risks & watch-outs
- Watch-outs: built in 1947 — expect roof / HVAC / electrical / plumbing capex.
- Climate carrying-cost: moderate wind risk, 24% chance of damaging wind over 30y; extreme-heat days projected 7→15/yr by 2055 (HVAC capex compounding) — expect insurance premiums to compound above CPI over the hold.
Questions for the listing agent
- It's been on market 39 days. Have you received any prior offers? Is the seller open to a 3% concession, seller financing, or rate buy-down credit?
- Built in 1947 — when were the roof, HVAC, electrical panel, plumbing, and water heater last replaced?
- Is there a deadline driving the sale (1031 exchange, divorce, estate, relocation)? That informs how much negotiation room exists.
- Schools are D-rated, which usually means shorter tenancies and higher turnover. Who's the typical renter profile here, and what's been the actual vacancy rate?
- Crime grade is F in this area — have there been break-ins, vandalism, or insurance claims at this property in the last 3 years? What carrier currently insures it and at what premium?
- What's the average days-on-market for RENTAL listings here right now (not sales)? A rising rental-DOM trend means longer vacancies and softer asking-rent achievability than the comps imply.
- What's the recent tenant-quality profile in this submarket — average credit score on applications, eviction rate, late-payment / NSF rate, and stable-employment percentage? A property-management company in the area should have these aggregated.
- How much new for-sale + rental construction is in the pipeline within 1–3 miles? Heavy new supply typically softens prices + rents 12–24 months out; constrained supply supports both.
Investment metrics
- 1% rule
- 1.43% ✓
- Cap rate
- 10.81%
- Cash-on-cash
- 16.13%
- DSCR
- 1.72
- GRM
- 5.8
CMA / ARV
- ARV (median comp)
- $209,312
- List price
- $125,000
- Delta
- -40.28%
- Verdict
- UNDERPRICED
- Comps
- 20 within 1.0 mi
Show comp detail 12 sales within ~0.75 mi
| Address | Dist | Beds/Ba | Sqft | Sold | Price | $/sf | Match |
|---|---|---|---|---|---|---|---|
| 3806 Rokeby Rd | 0.09mi | 3/1.0 | 1,160 (+2%) | 2mo | $120,000 | $103 | 87 |
| 3821 Stokes Dr | 0.14mi | 3/2.0 | 1,254 (+10%) | 1mo | $145,000 | $116 | 76 |
| 1000 Mount Holly St | 0.05mi | 3/1.5 | 1,290 (+13%) | 1mo | $93,000 | $72 | 73 |
| 1007 Wildwood Pkwy | 0.23mi | 3/1.0 | 1,216 (+7%) | 2mo | $111,100 | $91 | 73 |
| 1007 Mount Holly St | 0.03mi | 4/2.0 (+1) | 1,290 (+13%) | 2mo | $210,000 | $163 | 70 |
| 3224 Belmont Ave | 0.50mi | 3/1.5 | 1,178 (+3%) | 1mo | $77,000 | $65 | 68 |
| 4105 Flowerton Rd | 0.29mi | 2/2.0 (-1) | 1,260 (+10%) | 2mo | $119,990 | $95 | 62 |
| 209 Mount Holly St | 0.60mi | 3/2.0 | 1,080 (-5%) | 2mo | $228,000 | $211 | 62 |
| 1218 N Longwood St | 0.67mi | 4/2.0 (+1) | 1,190 (+4%) | 2mo | $56,000 | $47 | 55 |
| 3039 Harlem Ave | 0.65mi | 3/1.0 | 1,070 (-6%) | 1mo | $27,500 | $26 | 54 |
| 300 Denison St | 0.61mi | 3/2.0 | 1,260 (+10%) | 2mo | $205,000 | $163 | 53 |
| 133 N Monastery Ave | 0.74mi | 2/2.0 (-1) | 1,080 (-5%) | 3mo | $142,000 | $131 | 49 |
Match score weights: distance 35% · size 25% · config 20% · recency 20%. Top-matched comps best support the ARV.
Projected returns pro-forma
-3.0% appreciation · 5.38% rent growth · sell at horizon
- IRR
- 10.0%
- Equity multiple
- 1.40×
- Total profit
- $14,153
- Equity at exit
- $18,638
- IRR
- 21.1%
- Equity multiple
- 3.00×
- Total profit
- $70,048
- Equity at exit
- $10,808
Cash invested: $35,000 (down + closing). Projections, not guarantees.
Landlord ↔ Tenant lean methodology
- Overall (CITY)
- 12 Strongly Tenant-Friendly
- State Maryland
- 27 Tenant-Leaning · D+14
- County
- — inherits STATE
- City Baltimore
- 12 Strongly Tenant-Friendly · D+58
ZIP-level market 21229
- Rents YoY
- 5.4%
- Active inventory
- 252
- Price-to-rent
- 5.8×
Monthly cashflow live
- Estimated rent
- $1,784 high interval (Pro) →
- Mortgage (P&I)
- −$656
- Tax from tax record
- −$232 /mo · $2,780/yr
- Insurance
- −$52
- HOA
- −$0
- Vacancy / Maint / Mgmt
- −$375
- Net cashflow
- $470
Break-even live
UW: 25.0% down · 7.5% · 30yr · 1.5% tax · 5.0% vac · 8.0% maint · 8.0% mgmt
Financing live
Cash to close
- Down payment
- $31,250
- Closing costs
- $3,750
- Reserves months
- —
- Total cash needed
- —
Loan-product check · same deal, 3 products live
Conventional
25% down · 7.5% · 30yr
- Down + closing
- —
- Monthly P&I
- —
- Monthly cashflow
- —
- DSCR
- —
- Eligible?
- —
Personal DTI + credit; lowest rate.
DSCR
20% down · 8.5% · 30yr
- Down + closing
- —
- Monthly P&I
- —
- Monthly cashflow
- —
- DSCR
- —
- Eligible?
- —
No personal income docs; deal must DSCR.
Hard money
10% down · 12.0% · 12mo
- Down + closing
- —
- Monthly P&I
- —
- Monthly cashflow
- —
- DSCR
- —
- Eligible?
- —
Short-term bridge; refi at stabilization.
Rent comps 40 comps
| Address | Beds | Baths | Sqft | Rent | $/sqft | DOM | Units | Dist |
|---|---|---|---|---|---|---|---|---|
| 3712 Gelston Dr Baltimore, MD | 3.0 | 2.0 | 1250 | $2,500 | $2.00 | 23d | 1 | 0.22mi |
| 798 N Grantley St Baltimore, MD | 3.0 | 2.0 | 1360 | $2,295 | $1.69 | 23d | 1 | 0.22mi |
| 787 N Grantley St Baltimore, MD | 3.0 | 1.0 | 1116 | $1,575 | $1.41 | 23d | 1 | 0.24mi |
| 3935 Stokes Dr #1 Baltimore, MD | 2.0 | 1.0 | 1150 | $1,400 | $1.22 | 43d | 1 | 0.25mi |
| 780 Linnard St Baltimore, MD | 3.0 | 2.0 | 1224 | $1,590 | $1.30 | 43d | 1 | 0.26mi |
| 730 Linnard St Unit 1 Baltimore, MD | 4.0 | 1.0 | 1360 | $1,750 | $1.29 | 23d | 1 | 0.26mi |
| 1307 Wildwood Pkwy Baltimore, MD | 2.0 | 1.0 | 725 | $1,295 | $1.79 | 43d | 1 | 0.28mi |
| 623 N Grantley St Baltimore, MD | 4.0 | 2.0 | 1250 | $2,000 | $1.60 | 23d | 1 | 0.29mi |
| 4103 Mountwood Rd Baltimore, MD | 3.0 | 2.0 | 1030 | $1,700 | $1.65 | 43d | 1 | 0.31mi |
| 4020 Gelston Dr Baltimore, MD | 3.0 | 2.0 | 1270 | $1,875 | $1.48 | 43d | 1 | 0.31mi |
| 1216 N Augusta Ave Baltimore, MD | 3.0 | 1.0 | 1024 | $1,550 | $1.51 | 23d | 1 | 0.36mi |
| 4103 Stokes Dr Apt 1 Baltimore, MD | 2.0 | 1.0 | 725 | $1,095 | $1.51 | 43d | 1 | 0.36mi |
| 709 Denison St Baltimore, MD | 2.0 | 2.0 | 840 | $1,630 | $1.94 | 23d | 1 | 0.37mi |
| 3507 Edmondson Ave Baltimore, MD | 4.0 | 2.0 | 1428 | $2,300 | $1.61 | 43d | 1 | 0.40mi |
| 3423 Edmondson Ave Baltimore, MD | 2.0 | 1.5 | 1400 | $1,710 | $1.22 | 43d | 1 | 0.42mi |
| 3706 W Franklin St Unit 1 Baltimore, MD | 2.0 | 1.0 | 735 | $1,100 | $1.50 | 4d | 1 | 0.43mi |
| 3238 Westmont Ave Baltimore, MD | 3.0 | 1.0 | 1280 | $1,600 | $1.25 | 43d | 1 | 0.45mi |
| 917 Kevin Rd Baltimore, MD | 3.0 | 2.0 | 1151 | $1,795 | $1.56 | 1d | 1 | 0.51mi |
| 405 N Edgewood St Baltimore, MD | 4.0 | 2.0 | 1408 | $2,950 | $2.10 | 4d | 1 | 0.52mi |
| 3309 Brighton St Baltimore, MD | 3.0 | 1.0 | 1134 | $1,700 | $1.50 | 43d | 1 | 0.53mi |
| 1042 Ellicott Dr Baltimore, MD | 2.0 | 1.0 | 900 | $1,450 | $1.61 | 43d | 1 | 0.54mi |
| 3607 W Lexington St Baltimore, MD | 3.0 | 2.0 | 1050 | $1,895 | $1.80 | 4d | 1 | 0.61mi |
| 3709 Nortonia Rd #2 Baltimore, MD | 2.0 | 1.0 | 1289 | $1,450 | $1.12 | 17d | 1 | 0.63mi |
| 3015 Rayner Ave Baltimore, MD | 3.0 | 1.0 | 1152 | $1,350 | $1.17 | 43d | 1 | 0.65mi |
| 3127 Baker St Baltimore, MD | 3.0 | 1.0 | 1000 | $1,300 | $1.30 | 43d | 1 | 0.66mi |
| 3003 Presstman St Unit 2 Baltimore, MD | 2.0 | 1.0 | 1450 | $1,300 | $0.90 | 23d | 1 | 0.71mi |
| 3003 Presstman St Unit 1 Baltimore, MD | 2.0 | 2.0 | 1450 | $1,400 | $0.97 | 44d | 1 | 0.71mi |
| 41 N Kossuth St Baltimore, MD | 3.0 | 2.0 | 1216 | $1,800 | $1.48 | 23d | 1 | 0.80mi |
| 2806 Riggs Ave Baltimore, MD | 3.0 | 2.5 | 1412 | $1,900 | $1.35 | 3d | 1 | 0.82mi |
| 3514 Clifton Ave Unit 21 Baltimore, MD | 2.0 | 1.0 | 925 | $1,150 | $1.24 | 43d | 1 | 0.85mi |
| 3514 Clifton Ave Baltimore, MD | 2.0 | 1.0 | 925 | $1,199 | $1.30 | 43d | 1 | 0.85mi |
| 2103 Chelsea Ter Unit 1 Baltimore, MD | 2.0 | 2.0 | 1500 | $2,200 | $1.47 | 14d | 1 | 0.85mi |
| 2103 Chelsea Ter Unit 2 Baltimore, MD | 3.0 | 1.5 | 1500 | $2,100 | $1.40 | 14d | 1 | 0.85mi |
| 2744 W Mosher St Baltimore, MD | 4.0 | 2.0 | 1412 | $2,100 | $1.49 | 23d | 1 | 0.86mi |
| 3310 Elbert St Baltimore, MD | 2.0 | 1.0 | 920 | $1,550 | $1.68 | 23d | 1 | 0.88mi |
| 4520 Scarlet Oak Ln Baltimore, MD | 2.0 | 1.0 | 1025 | $1,500 | $1.46 | 43d | 1 | 0.88mi |
| 2728 Winchester St Baltimore, MD | 3.0 | 1.5 | 1260 | $1,800 | $1.43 | 3d | 1 | 0.90mi |
| 2800 Presstman St Baltimore, MD | 3.0 | 2.5 | 1460 | $1,799 | $1.23 | 23d | 1 | 0.90mi |
| 3003 W North Ave Baltimore, MD | 1.0–2.0 | 1.0 | 841 | $935 | $1.11 | 2d | 3 | 0.91mi |
| 3336 W Caton Ave Baltimore, MD | 3.0 | 2.0 | 1236 | $1,625 | $1.31 | 23d | 1 | 0.94mi |
Listing history 20 events
-
2026-06-18days on market $125,000 Active 39 DOM
-
2026-06-17days on market $125,000 Active 38 DOM
-
2026-06-16days on market $125,000 Active 37 DOM
-
2026-06-15days on market $125,000 Active 36 DOM
-
2026-06-13days on market $125,000 Active 34 DOM
-
2026-06-09days on market $125,000 Active 30 DOM
-
2026-06-08days on market $125,000 Active 29 DOM
-
2026-06-07days on market $125,000 Active 28 DOM
-
2026-06-04days on market $125,000 Active 25 DOM
-
2026-06-03days on market $125,000 Active 24 DOM
-
2026-06-02days on market $125,000 Active 23 DOM
-
2026-06-01days on market $125,000 Active 22 DOM
-
2026-05-31days on market $125,000 Active 21 DOM
-
2026-05-10$125,000 Active 804-char remark
-
2026-04-27historical
-
2026-01-20$125,000 Active
-
2006-03-15soldstatus $100,000
-
2006-02-28soldstatus $100,000
Show marketing remark (397 chars)
Well maintained, all brick townhome in hot Edmondson Village. Compare to other listings and you will find this unit well priced, larger than most and in good shape with only finishing touches left. Seller in process of updating. New roof! New Windows! Freshly painted throughout! Large rooms with w/ w carpet. Seller to contribute $$ towards closing with full price offer. Priced to sell! Call CSS
-
2006-01-11historical
Show marketing remark (397 chars)
Well maintained, all brick townhome in hot Edmondson Village. Compare to other listings and you will find this unit well priced, larger than most and in good shape with only finishing touches left. Seller in process of updating. New roof! New Windows! Freshly painted throughout! Large rooms with w/ w carpet. Seller to contribute $$ towards closing with full price offer. Priced to sell! Call CSS
-
2005-12-13$104,900
Show marketing remark (397 chars)
Well maintained, all brick townhome in hot Edmondson Village. Compare to other listings and you will find this unit well priced, larger than most and in good shape with only finishing touches left. Seller in process of updating. New roof! New Windows! Freshly painted throughout! Large rooms with w/ w carpet. Seller to contribute $$ towards closing with full price offer. Priced to sell! Call CSS
ⓘ Source: listings_history table (triggers on properties + properties_extension) + one-shot
backfill from property_details.listing_events for pre-trigger history.
Tax reassessment forecast MD · Partial reset (capped growth)
- Current annual tax
- $2,780 · $232/mo
- Projected year-2 tax
- $2,780 · $232/mo
- Expected delta
- $0/yr ($0/mo · 0.0%)
ⓘ Screening estimate from a state-policy table — verify with the county assessor before closing.
Climate risk First Street
- Flood 1/10 Low FEMA zone X (unshaded) · 0% chance over 30 yrs
- Wildfire 1/10 Low
- Heat 7/10 Severe 7 d/yr ≥103°F today · 15 d/yr by 30 yrs out
- Wind 5/10 Major 24% chance of damaging wind over 30 yrs
- Air quality 3/10 Moderate 3 unhealthy d/yr today · 4 by 30 yrs out
Nearby sold comps map
Loading sold comps map…
Walkable amenities ~0.75 mi
Loading nearby amenities…
Taxation est. · year 1
- Rental income
- $21,413
- − Mortgage interest
- −$7,002
- − Property taxes
- −$2,780
- − Insurance
- −$625
- − Repairs & maintenance
- −$1,713
- − Management
- −$1,713
- − Depreciation
- −$3,636
- Taxable income
- $3,943
- Est. tax owed @ 24.0%
- −$946
- After-tax cash flow
- $4,698/yr
For passive investors: Depreciation is non-cash, so a rental often shows a tax loss while cash-flowing — sheltering income. Rental losses are passive: they offset passive income freely, and up to $25,000/yr can offset ordinary (W-2) income if you actively participate and your MAGI is under $100k (phasing out to $0 by $150k); unused losses carry forward. On sale, claimed depreciation is recaptured at up to 25%, and gains may owe capital-gains tax (a 1031 exchange can defer both). Figures are a year-1 estimate at your 24.0% rate — not tax advice; consult a CPA.
Schools (NCES district)
- District
- Baltimore City Public Schools
- NCES district ID
- 2400090
- Math proficiency
- 7% ▼ -9.00%
- Reading proficiency
- 16% ▼ -5.00%
- Median HH income
- $42,108
- Composite
- 10.08/100
- National rank
- #9805
- State rank
- #24 of 24 in MD
Livability — Baltimore
- Score
- 76/100
- State rank
- #90
- US rank
- #3396
Category grades
Schools grade is shown separately in the Schools card above.
Census & demographics
- Census place
- Baltimore, MD
- County
- Baltimore City · 558,601 people
- City population
- 588,727
- Metro
- Baltimore-Columbia-Towson, MD
- Population (ZIP)
- 46,679
- Household income
- $60,047
- Rent vs Own
- Severe rent burden
- 2776.0
Population outlook (Baltimore County) Hauer SSP2
- Today (2025)
- 624,249 people
- By 2030
- 621,541 · -0.4%
- By 2040
- 609,756 · -2.3%
- By 2050
- 597,249 · -4.3%
- By 2075
- 552,236 · -11.5%
- By 2100
- 513,934 · -17.7%
Race, ethnicity, and origin ACS 2023
- Neighborhood character
- Predominantly Black (73%)
- Race & ethnicity
- Black 73% White 15% Hispanic / Latino 6% Two or more races 4% Asian 3%
- Hispanic origin (detail)
- Common ancestry
- Lithuanian 1% Romanian 1% Serbian 1%
- Foreign-born
- 5% · Canada, Philippines
- Languages at home
- 91% English-only · Spanish 4% Other Indo-European 2% Other Asian/Pacific 1%
Political lean MEDSL · Baltimore
- 2024 margin
- Solid D (+73.0) · D 85.2% · R 12.2% · Other 2.6%
- 2008→2024 swing
- -2.5pp toward R · 2008: 75.5pp · 2024: 73.0pp
- All cycles
- 2024: D+73.0 2020: D+76.6 2016: D+74.6 2012: D+76.4 2008: D+75.5
Not yet ingested
- Civics
- —
Market trends
- HPI YoY
- ▼ -259.07%
- Current HPI
- 226.896
- Rent YoY
- ▲ 5.38%
- Metro
- Baltimore-Columbia-Towson, MD
- State GDP YoY
- ▲ 2.97%
- F500 in state
- 12
Industry mix (Fortune 500 HQ in MD)
| Industry | F500 HQs | Revenue |
|---|---|---|
| Aerospace / Defense | 1 | $71B |
|
||
| Utilities | 1 | $25B |
|
||
| Hotels | 1 | $24B |
|
||
| Consumer Goods | 1 | $7B |
|
||
| Real Estate | 1 | $6B |
|
||
| Chemicals | 1 | $2B |
|
||
Price history
+19.2% since first listed7 events — show timeline
- 2026-05-10 Listed $125,000 BRIGHT MLS
- 2026-04-27 Listing Removed — BRIGHT MLS
- 2026-01-20 Listed $125,000 BRIGHT MLS
- 2006-03-15 Sold (Public Records) $100,000 Public Records
- 2006-02-28 Sold (MLS) $100,000 MRIS
- 2006-01-11 Delisted — MRIS
- 2005-12-13 Listed $104,900 MRIS
Property tax history
+3.1%/yrLatest (2025): $2,780 · +9.0% YoY. Source: county tax records.
Cash-flow waterfall
monthlySold comps — $/sqft
last 12 mo · ≤1 miLoading sold comps…