 Multi-family
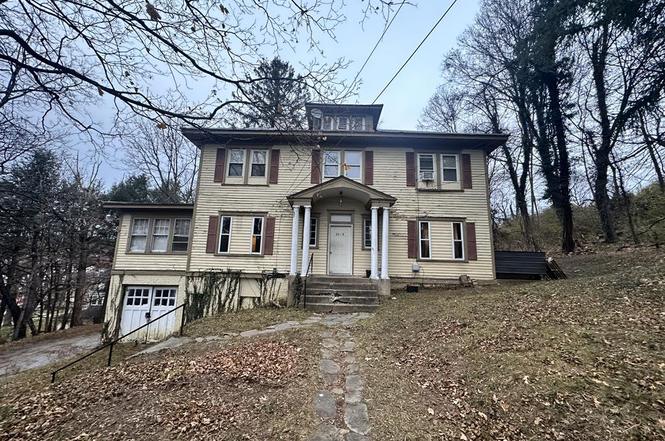
2019 Fulton St · Bluefield, WV
Flood risk 1/10 · Minimal
- FEMA flood zone
- X (unshaded)
- Chance of flooding over 30 yrs
- 0.0%
- Est. flood insurance / yr
- $473 – $860
Fire risk 3/10 · Minor
- Est. fire insurance / yr
- $787 – $1,461
Heat risk 2/10 · Minimal
- Hot days now (above 91°F)
- 7 days/yr
- Hot days in 30 yrs
- 21 days/yr
Wind risk 2/10 · Minimal
- Chance of severe wind over 30 yrs
- 0.0%
Air-quality risk 1/10 · Minimal
- Unhealthy air days now
- 0 days/yr
- Unhealthy air days in 30 yrs
- 0 days/yr
Risk factors via First Street. Map © Google.
Why this score? — see what drove the C+ grade
The composite is a weighted blend of 9 inputs, each scored 0–100. Each bar is that input's sub-score; the figure is the points it added to the 100-point composite (weight × sub-score).
- Cash flow +23.7/30.0
- DSCR +7.6/10.0
- ARV discount +7.5/15.0
- Appreciation +6.7/10.0
- 1% rule +6.4/10.0
- Livability +2.8/5.0
- Schools +2.6/10.0
- Rent growth +2.5/5.0
- Condition / age +2.5/5.0
$119,900
🖨 Deal sheet (PDF) 📄 Offer letter ✓ Due diligence
Multi-family units
County records classify this as Multi-Family (2-4 Unit). Listing-text estimate: 1 unit. estimate disagrees with records
Listing remarks
4-unit apartment building with income potential at 2019 Fulton Street, in Bluefield, WV. Set on a large lot with off-street parking, this property offers three 1-bedroom units and one 2-bedroom unit, all with separate utilities and hardwood floors throughout. Ideal for investors seeking a value-add opportunity—renovate to boost rents and equity, or live in one unit while improving the property. Additional Storage on third floor and the lower garage can be used to increase revenue. Conveniently located near shopping, schools, and downtown amenities. This property offers opportunity to start a new venture or add to your existing investment portfolio. Shown by appointment only. Call toda
Key facts
- Separate utilities
- Large lot
- Off-street parking
Tags
Property features AI
Exterior
- Utilities: Public water; Public sewer
- Home design: Single-family residence; Residential property; 2 stories
- Construction: Frame construction
- Exterior features: Lot approximately 0.68 acres
Interior
- Bathrooms: Four full bathrooms
- Heating & cooling: Baseboard heating; Window air conditioning units
- Interior features: Basement with exterior entry, partial finish, and unfinished areas
Neighborhood map
What this means for you Summary
Snapshot
- This is a 6-bed/4.0-bath multifamily listed at $120k.
Deal economics
- At list price, monthly cash flow is $227 ($3k/yr) — positive.
- The deal already cash-flows at list — no discount required.
- Meets the 1% rule at list price ($1k rent vs $120k).
- Recommended offer: $106k (12.0% below list) — sets the bar for market timing.
- Cap rate 8.6% vs local median 5.2% in Bluefield — top-decile yield for the area; either an underpriced asset or a hidden risk that comps aren't pricing in. Stress-test before assuming the spread holds.
Location & tenants
- Location reads 56/100 on livability (#265 in WV) — a working-class tenant base; expect higher turnover. Strengths: cost of living A+, housing A+; Watch: crime D+, schools F, amenities F.
- Mercer County Schools (town): math 26% / reading 37% proficiency, ranked #28 of 55 in WV (top 51%) — families likely to look elsewhere, expect single-tenant / working-renter base with shorter leases.
- Market conditions: 52 active listings in the ZIP; 4 units permitted in Mercer County in 2024 (0 in 5+ unit buildings).
- This rent runs 32% of the median local income ($50k/yr) — at the standard rent-burdened threshold; future hikes will face affordability resistance.
Forward outlook
- In year one you build about $5k of equity ($829 loan paydown + $4k appreciation (3.4% local appreciation)).
- Mercer County population projected at -18% by 2050 — secular population decline; favor cash flow + early exit over multi-decade hold.
- At projected returns (3.4% appreciation + 3.0% rent growth), your $34k cash investment doubles in ~4 years — after that, you're playing with house money.
- By year 7, paydown + projected appreciation supports a ~$31k cash-out refi (75% LTV) — recoverable capital for the next deal without selling this one.
Negotiation context
- It's been on market 192 days — a 12% lower offer ($106k) is reasonable based on typical stale-listing flexibility.
Risks & watch-outs
- Watch-outs: built in 1921 — expect roof / HVAC / electrical / plumbing capex.
Questions for the listing agent
- It's been on market 192 days. Have you received any prior offers? Is the seller open to a 12% concession, seller financing, or rate buy-down credit?
- Built in 1921 — when were the roof, HVAC, electrical panel, plumbing, and water heater last replaced?
- Why hasn't it sold? Are there any deal-killer items the seller is aware of (foundation, flood, title, zoning, code violations)?
- Is there a deadline driving the sale (1031 exchange, divorce, estate, relocation)? That informs how much negotiation room exists.
- Schools are F-rated, which usually means shorter tenancies and higher turnover. Who's the typical renter profile here, and what's been the actual vacancy rate?
- Crime grade is D in this area — have there been break-ins, vandalism, or insurance claims at this property in the last 3 years? What carrier currently insures it and at what premium?
- What's the average days-on-market for RENTAL listings here right now (not sales)? A rising rental-DOM trend means longer vacancies and softer asking-rent achievability than the comps imply.
- What's the recent tenant-quality profile in this submarket — average credit score on applications, eviction rate, late-payment / NSF rate, and stable-employment percentage? A property-management company in the area should have these aggregated.
- How much new apartment / multifamily construction is in the pipeline within 1–3 miles? Heavy new supply (>2% of stock underway) typically softens rents 12–24 months out; light construction supports rent growth.
Investment metrics
- 1% rule
- 1.14% ✓
- Cap rate
- 8.57%
- Cash-on-cash
- 8.12%
- DSCR
- 1.36
- GRM
- 7.3
CMA / ARV
No comps found within radius.
Projected returns pro-forma
3.42% appreciation · 3.0% rent growth · sell at horizon
- IRR
- 16.2%
- Equity multiple
- 1.94×
- Total profit
- $31,660
- Equity at exit
- $56,797
- IRR
- 17.4%
- Equity multiple
- 3.66×
- Total profit
- $89,190
- Equity at exit
- $89,843
Cash invested: $33,572 (down + closing). Projections, not guarantees.
Landlord ↔ Tenant lean methodology
- Overall (STATE)
- 83 Strongly Landlord-Friendly
- State West Virginia
- 83 Strongly Landlord-Friendly · R+22
- County
- — inherits STATE
- City
- — inherits STATE
ZIP-level market 24701
- Home prices YoY
- 1.6%
- Active inventory
- 52
- Price-to-rent
- 7.3×
Monthly cashflow live
- Estimated rent
- $1,364 medium interval (Pro) →
- Mortgage (P&I)
- −$629
- Tax from tax record
- −$171 /mo · $2,057/yr
- Insurance
- −$50
- HOA
- −$0
- Vacancy / Maint / Mgmt
- −$286
- Net cashflow
- $227
Break-even live
Sensitivity live
| Price | -10% $295 | -5% $261 | +0% $227 | +5% $193 | +10% $159 |
|---|---|---|---|---|---|
| Rent | -10% $119 | -5% $173 | +0% $227 | +5% $281 | +10% $335 |
| Rate | -1.0pp $288 | -0.5pp $258 | base $227 | +0.5pp $196 | +1.0pp $165 |
UW: 25.0% down · 7.5% · 30yr · 1.5% tax · 5.0% vac · 8.0% maint · 8.0% mgmt
Financing live
Cash to close
- Down payment
- $29,975
- Closing costs
- $3,597
- Reserves months
- —
- Total cash needed
- —
Loan-product check · same deal, 3 products live
Conventional
25% down · 7.5% · 30yr
- Down + closing
- —
- Monthly P&I
- —
- Monthly cashflow
- —
- DSCR
- —
- Eligible?
- —
Personal DTI + credit; lowest rate.
DSCR
20% down · 8.5% · 30yr
- Down + closing
- —
- Monthly P&I
- —
- Monthly cashflow
- —
- DSCR
- —
- Eligible?
- —
No personal income docs; deal must DSCR.
Hard money
10% down · 12.0% · 12mo
- Down + closing
- —
- Monthly P&I
- —
- Monthly cashflow
- —
- DSCR
- —
- Eligible?
- —
Short-term bridge; refi at stabilization.
Listing history 16 events
-
2026-06-19days on market $119,900 Active 192 DOM
-
2026-06-18days on market $119,900 Active 191 DOM
-
2026-06-17days on market $119,900 Active 190 DOM
-
2026-06-16days on market $119,900 Active 189 DOM
-
2026-06-15days on market $119,900 Active 188 DOM
-
2026-06-14days on market $119,900 Active 186 DOM
-
2026-06-12days on market $119,900 Active 185 DOM
-
2026-06-09days on market $119,900 Active 182 DOM
-
2026-06-08days on market $119,900 Active 181 DOM
-
2026-06-07days on market $119,900 Active 180 DOM
-
2026-06-05days on market $119,900 Active 177 DOM
-
2026-06-02days on market $119,900 Active 175 DOM
-
2026-06-01days on market $119,900 Active 174 DOM
-
2026-05-31days on market $119,900 Active 173 DOM
-
2026-05-30days on market $119,900 Active 172 DOM
-
2025-12-09$119,900 Active
ⓘ Source: listings_history table (triggers on properties + properties_extension) + one-shot
backfill from property_details.listing_events for pre-trigger history.
Tax reassessment forecast WV · Resets to sale price
- Current annual tax
- $2,057 · $171/mo
- Projected year-2 tax
- $2,057 · $171/mo
- Expected delta
- $0/yr ($0/mo · 0.0%)
ⓘ Screening estimate from a state-policy table — verify with the county assessor before closing.
Climate risk First Street
- Flood 1/10 Low FEMA zone X (unshaded) · 0% chance over 30 yrs
- Wildfire 3/10 Moderate
- Heat 2/10 Low 7 d/yr ≥91°F today · 21 d/yr by 30 yrs out
- Wind 2/10 Low 0% chance of damaging wind over 30 yrs
- Air quality 1/10 Low 0 unhealthy d/yr today · 0 by 30 yrs out
Nearby sold comps map
Loading sold comps map…
Walkable amenities ~0.75 mi
Loading nearby amenities…
Taxation est. · year 1
- Rental income
- $16,364
- − Mortgage interest
- −$6,716
- − Property taxes
- −$2,057
- − Insurance
- −$600
- − Repairs & maintenance
- −$1,309
- − Management
- −$1,309
- − Depreciation
- −$3,488
- Taxable income
- $886
- Est. tax owed @ 24.0%
- −$213
- After-tax cash flow
- $2,514/yr
For passive investors: Depreciation is non-cash, so a rental often shows a tax loss while cash-flowing — sheltering income. Rental losses are passive: they offset passive income freely, and up to $25,000/yr can offset ordinary (W-2) income if you actively participate and your MAGI is under $100k (phasing out to $0 by $150k); unused losses carry forward. On sale, claimed depreciation is recaptured at up to 25%, and gains may owe capital-gains tax (a 1031 exchange can defer both). Figures are a year-1 estimate at your 24.0% rate — not tax advice; consult a CPA.
Schools (NCES district)
- District
- Mercer County Schools
- NCES district ID
- 5400840
- Math proficiency
- 26% ▼ -13.00%
- Reading proficiency
- 37% ▼ -6.00%
- Median HH income
- $35,064
- Composite
- 25.98/100
- National rank
- #7325
- State rank
- #28 of 55 in WV
Livability — Bluefield
- Score
- 56/100
- State rank
- #265
- US rank
- #22470
Category grades
Schools grade is shown separately in the Schools card above.
Census & demographics
- Census place
- Bluefield, WV
- County
- Mercer County · 33,615 people
- City population
- 17,117
- Metro
- Bluefield, WV-VA
- Population (ZIP)
- 17,117
- Household income
- $50,455
- Rent vs Own
- Severe rent burden
- 302.0
Population outlook (Mercer County) Hauer SSP2
- Today (2025)
- 57,860 people
- By 2030
- 55,781 · -3.6%
- By 2040
- 51,365 · -11.2%
- By 2050
- 47,476 · -17.9%
- By 2075
- 38,851 · -32.9%
- By 2100
- 30,053 · -48.1%
Race, ethnicity, and origin ACS 2023
- Neighborhood character
- Predominantly White (82%)
- Race & ethnicity
- White 82% Black 9% Two or more races 7% Hispanic / Latino 2%
- Common ancestry
- Slovak 2% Serbian 1% Danish 1%
- Foreign-born
- 1%
- Languages at home
- 96% English-only · Spanish 3%
Political lean MEDSL · Mercer
- 2024 margin
- Solid R (+57.3) · D 20.6% · R 77.9% · Other 1.5%
- 2008→2024 swing
- -29.8pp toward R · 2008: -27.6pp · 2024: -57.3pp
- All cycles
- 2024: R+57.3 2020: R+54.4 2016: R+55.3 2012: R+47.1 2008: R+27.6
Not yet ingested
- Civics
- —
Market trends
- HPI YoY
- ▲ 3.42%
- Current HPI
- 215.9682
- Rent YoY
- —
- Metro
- Bluefield, WV-VA
- State GDP YoY
- —
- F500 in state
- 0
Price history
1 event — show timeline
- 2025-12-09 Listed $119,900 MTCBOR
Property tax history
+3.0%/yrLatest (2025): $2,057 · +6.8% YoY. Source: county tax records.
Cash-flow waterfall
monthlySold comps — $/sqft
last 12 mo · ≤1 miLoading sold comps…