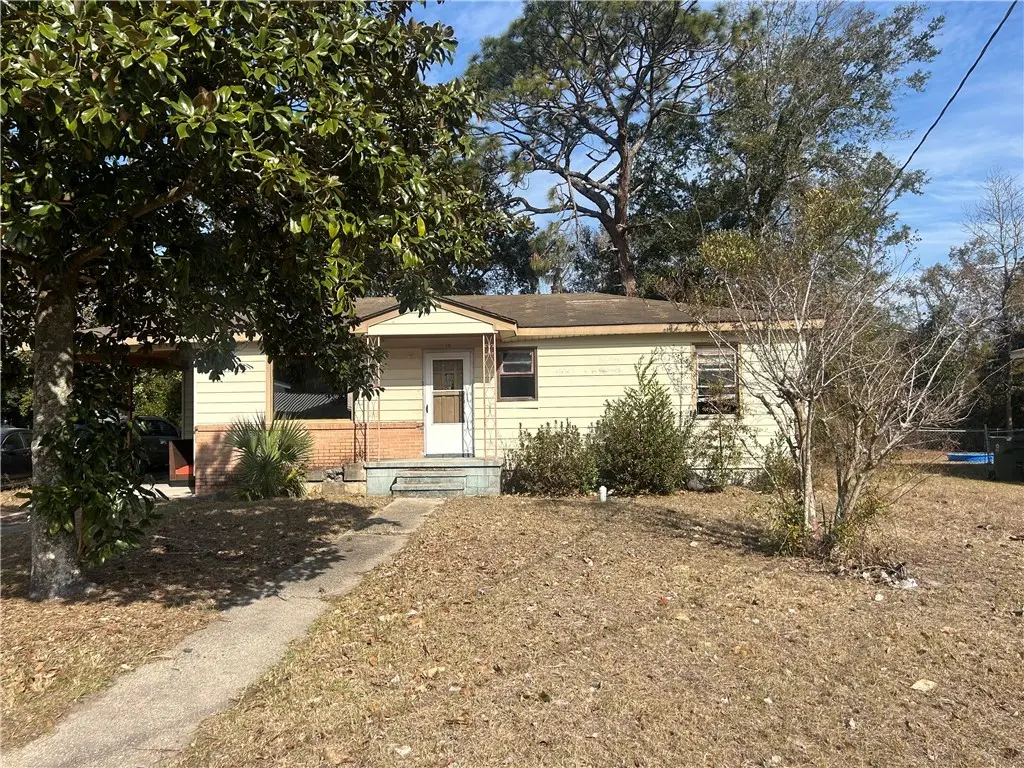
115 Shangri La Ave · Country Club Estates, GA
Flood risk 1/10 · Minimal
- FEMA flood zone
- X (unshaded)
- Chance of flooding over 30 yrs
- 0.0%
- Est. flood insurance / yr
- $507 – $1,088
Fire risk 4/10 · Minor
- Est. fire insurance / yr
- $963 – $1,789
Heat risk 10/10 · Severe
- Hot days now (above 108°F)
- 7 days/yr
- Hot days in 30 yrs
- 20 days/yr
Wind risk 9/10 · Severe
- Chance of severe wind over 30 yrs
- 99.0%
Air-quality risk 4/10 · Minor
- Unhealthy air days now
- 5 days/yr
- Unhealthy air days in 30 yrs
- 5 days/yr
Risk factors via First Street. Map © Google.
Why this score? — see what drove the B+ grade
The composite is a weighted blend of 9 inputs, each scored 0–100. Each bar is that input's sub-score; the figure is the points it added to the 100-point composite (weight × sub-score).
- Cash flow +30.0/30.0
- ARV discount +15.0/15.0
- 1% rule +10.0/10.0
- DSCR +10.0/10.0
- Schools +3.4/10.0
- Livability +3.3/5.0
- Rent growth +2.5/5.0
- Condition / age +2.5/5.0
- Appreciation +0.0/10.0
$99,900
🖨 Deal sheet 📄 Offer letter ✓ Due diligence
Listing remarks MLS
Investor opportunity in an established community. This home has been gutted to the studs and is ready for design and renovation! This seller is motivated.
Key facts
- 9,147 sq ft lot
- Parking
- Built 1959
Neighborhood map
What this means for you Summary
Snapshot
- This is a 3-bed/1.0-bath single-family listed at $100k.
Deal economics
- At list price, monthly cash flow is $705 ($8k/yr) — positive.
- The deal already cash-flows at list — no discount required.
- Meets the 1% rule at list price ($2k rent vs $100k).
- Recommended offer: $88k (12.0% below list) — sets the bar for market timing.
- Cap rate 14.8% vs local median 3.5% in Country Club Estates — top-decile yield for the area; either an underpriced asset or a hidden risk that comps aren't pricing in. Stress-test before assuming the spread holds.
Location & tenants
- Location reads 66/100 on livability (#179 in GA) — a middle-class / working-renter tenant base. Strengths: cost of living A+, housing A+; Watch: employment D, schools F, amenities F.
- Glynn County (other): math 37% / reading 42% proficiency, ranked #47 of 174 in GA (top 27%) — families likely to look elsewhere, expect single-tenant / working-renter base with shorter leases.
- Market conditions: Rents soft (-0.2%/yr); 353 active listings in the ZIP; 3 comparable units currently listed for rent nearby; rentals lingering (median 44d on market — plan ~5-8 weeks vacancy on turnover, expect pricing pressure); 100% of comp listings sitting > 30 days — soft ceiling on asking rent; 734 units permitted in Glynn County in 2024 (136 in 5+ unit buildings).
Forward outlook
- Local home prices are declining (-3.0%/yr); year-one equity from $691 of loan paydown is wiped out by about $3k of value loss. Plan a longer hold.
- Glynn County population projected at +13% by 2050 — modest demand growth; plan on rents tracking national, not racing it.
- At projected returns (-3.0% appreciation + 0.0% rent growth), your $28k cash investment doubles in ~5 years — after that, you're playing with house money.
Negotiation context
- It's been on market 137 days — a 12% lower offer ($88k) is reasonable based on typical stale-listing flexibility.
- 2 sale attempts since 2y ago with the ask held roughly flat each time — persistent listings suggest the price (not the market) is what's stuck; bring a comps-based counter.
Risks & watch-outs
- Watch-outs: built in 1959 — expect roof / HVAC / electrical / plumbing capex.
- Climate carrying-cost: severe wind risk, 99% chance of damaging wind over 30y; extreme-heat days projected 7→20/yr by 2055 (HVAC capex compounding) — expect insurance premiums to compound above CPI over the hold.
Questions for the listing agent
- It's been on market 137 days. Have you received any prior offers? Is the seller open to a 12% concession, seller financing, or rate buy-down credit?
- Built in 1959 — when were the roof, HVAC, electrical panel, plumbing, and water heater last replaced?
- Why hasn't it sold? Are there any deal-killer items the seller is aware of (foundation, flood, title, zoning, code violations)?
- Is there a deadline driving the sale (1031 exchange, divorce, estate, relocation)? That informs how much negotiation room exists.
- Schools are F-rated, which usually means shorter tenancies and higher turnover. Who's the typical renter profile here, and what's been the actual vacancy rate?
- What's the average days-on-market for RENTAL listings here right now (not sales)? A rising rental-DOM trend means longer vacancies and softer asking-rent achievability than the comps imply.
- What's the recent tenant-quality profile in this submarket — average credit score on applications, eviction rate, late-payment / NSF rate, and stable-employment percentage? A property-management company in the area should have these aggregated.
- How much new for-sale + rental construction is in the pipeline within 1–3 miles? Heavy new supply typically softens prices + rents 12–24 months out; constrained supply supports both.
Investment metrics
- 1% rule
- 1.67% ✓
- Cap rate
- 14.76%
- Cash-on-cash
- 30.25%
- DSCR
- 2.35
- GRM
- 5.0
CMA / ARV
- ARV (median comp)
- $181,149
- List price
- $99,900
- Delta
- -44.85%
- Verdict
- UNDERPRICED
- Comps
- 20 within 1.0 mi
Show comp detail 8 sales within ~0.75 mi
| Address | Dist | Beds/Ba | Sqft | Sold | Price | $/sf | Match |
|---|---|---|---|---|---|---|---|
| 124 Yorktown Dr | 0.15mi | 3/2.0 | 976 (+0%) | 21mo | $132,000 | $135 | 72 |
| 109 Yorktown Dr | 0.25mi | 3/1.0 | 1,025 (+5%) | 11mo | $145,000 | $141 | 70 |
| 126 Yorktown Dr | 0.14mi | 3/1.0 | 888 (-9%) | 12mo | $115,000 | $130 | 69 |
| 158 Yorktown Dr | 0.13mi | 3/2.0 | 1,036 (+6%) | 16mo | $210,000 | $203 | 66 |
| 125 Enterprise St | 0.14mi | 3/2.0 | 1,100 (+13%) | 10mo | $188,500 | $171 | 60 |
| 679 Shepard Dr | 0.58mi | 3/2.0 | 1,107 (+14%) | 2mo | $200,000 | $181 | 45 |
| 172 Zachary Dr | 0.57mi | 3/2.0 | 1,119 (+15%) | 6mo | $178,500 | $160 | 39 |
| 82 Glynn Marsh Ct | 0.67mi | 3/2.0 | 1,020 (+5%) | 23mo | $175,000 | $172 | 38 |
Match score weights: distance 35% · size 25% · config 20% · recency 20%. Top-matched comps best support the ARV.
Projected returns pro-forma
-3.0% appreciation · 0.0% rent growth · sell at horizon
- IRR
- 21.6%
- Equity multiple
- 1.85×
- Total profit
- $23,817
- Equity at exit
- $14,895
- IRR
- 27.8%
- Equity multiple
- 3.13×
- Total profit
- $59,620
- Equity at exit
- $8,638
Cash invested: $27,972 (down + closing). Projections, not guarantees.
Landlord ↔ Tenant lean methodology
- Overall (STATE)
- 90 Strongly Landlord-Friendly
- State Georgia
- 90 Strongly Landlord-Friendly · R+3
- County
- — inherits STATE
- City
- — inherits STATE
ZIP-level market 31525
- Rents YoY
- -0.2%
- Active inventory
- 353
- Price-to-rent
- 5.0×
Monthly cashflow live
- Estimated rent
- $1,664 medium interval (Pro) →
- Mortgage (P&I)
- −$524
- Tax from tax record
- −$44 /mo · $524/yr
- Insurance
- −$42
- HOA
- −$0
- Vacancy / Maint / Mgmt
- −$349
- Net cashflow
- $705
Break-even live
UW: 25.0% down · 7.5% · 30yr · 1.5% tax · 5.0% vac · 8.0% maint · 8.0% mgmt
Financing live
Cash to close
- Down payment
- $24,975
- Closing costs
- $2,997
- Reserves months
- —
- Total cash needed
- —
Loan-product check · same deal, 3 products live
Conventional
25% down · 7.5% · 30yr
- Down + closing
- —
- Monthly P&I
- —
- Monthly cashflow
- —
- DSCR
- —
- Eligible?
- —
Personal DTI + credit; lowest rate.
DSCR
20% down · 8.5% · 30yr
- Down + closing
- —
- Monthly P&I
- —
- Monthly cashflow
- —
- DSCR
- —
- Eligible?
- —
No personal income docs; deal must DSCR.
Hard money
10% down · 12.0% · 12mo
- Down + closing
- —
- Monthly P&I
- —
- Monthly cashflow
- —
- DSCR
- —
- Eligible?
- —
Short-term bridge; refi at stabilization.
Rent comps 3 comps
| Address | Beds | Baths | Sqft | Rent | $/sqft | DOM | Units | Dist |
|---|---|---|---|---|---|---|---|---|
| 820 Scranton Rd Brunswick, GA | 1.0–3.0 | 1.0–2.5 | 797 | $1,696 | $2.13 | 44d | 5 | 0.77mi |
| 5600 Altama Ave Brunswick, GA | 2.0 | 1.0 | 750 | $1,175 | $1.57 | 44d | 3 | 0.90mi |
| 111 S Palm Dr Brunswick, GA | 1.0–3.0 | 1.0–2.0 | 1077 | $1,589 | $1.48 | 44d | 11 | 0.91mi |
Listing history 20 events
-
2026-06-19days on market $99,900 Active 137 DOM
-
2026-06-18days on market $99,900 Active 136 DOM
-
2026-06-17days on market $99,900 Active 135 DOM
-
2026-06-16days on market $99,900 Active 134 DOM
-
2026-06-15days on market $99,900 Active 133 DOM
-
2026-06-14days on market $99,900 Active 131 DOM
-
2026-06-13days on market $99,900 Active 130 DOM
-
2026-06-10days on market $99,900 Active 128 DOM
-
2026-06-09days on market $99,900 Active 127 DOM
-
2026-06-08days on market $99,900 Active 126 DOM
-
2026-06-07days on market $99,900 Active 125 DOM
-
2026-06-05days on market $99,900 Active 122 DOM
-
2026-06-03days on market $99,900 Active 121 DOM
-
2026-06-02days on market $99,900 Active 120 DOM
-
2026-06-01days on market $99,900 Active 119 DOM
-
2026-05-31days on market $99,900 Active 118 DOM
-
2026-05-30days on market $99,900 Active 117 DOM
-
2026-02-01$99,900 Active 154-char remark
Show marketing remark (154 chars)
Investor opportunity in an established community. This home has been gutted to the studs and is ready for design and renovation! This seller is motivated.
-
2025-04-30historical
-
2024-10-25$175,000 Active
ⓘ Source: listings_history table (triggers on properties + properties_extension) + one-shot
backfill from property_details.listing_events for pre-trigger history.
Tax reassessment forecast GA · Resets to sale price
- Current annual tax
- $524 · $44/mo
- Projected year-2 tax
- $919 · $77/mo
- Expected delta
- +$395/yr (+$33/mo · 75.3%)
ⓘ Screening estimate from a state-policy table — verify with the county assessor before closing.
Climate risk First Street
- Flood 1/10 Low FEMA zone X (unshaded) · 0% chance over 30 yrs
- Wildfire 4/10 Moderate
- Heat 10/10 Extreme 7 d/yr ≥108°F today · 20 d/yr by 30 yrs out
- Wind 9/10 Extreme 99% chance of damaging wind over 30 yrs
- Air quality 4/10 Moderate 5 unhealthy d/yr today · 5 by 30 yrs out
Nearby sold comps map
Loading sold comps map…
Walkable amenities ~0.75 mi
Loading nearby amenities…
Taxation est. · year 1
- Rental income
- $19,964
- − Mortgage interest
- −$5,596
- − Property taxes
- −$524
- − Insurance
- −$500
- − Repairs & maintenance
- −$1,597
- − Management
- −$1,597
- − Depreciation
- −$2,906
- Taxable income
- $7,243
- Est. tax owed @ 24.0%
- −$1,738
- After-tax cash flow
- $6,722/yr
For passive investors: Depreciation is non-cash, so a rental often shows a tax loss while cash-flowing — sheltering income. Rental losses are passive: they offset passive income freely, and up to $25,000/yr can offset ordinary (W-2) income if you actively participate and your MAGI is under $100k (phasing out to $0 by $150k); unused losses carry forward. On sale, claimed depreciation is recaptured at up to 25%, and gains may owe capital-gains tax (a 1031 exchange can defer both). Figures are a year-1 estimate at your 24.0% rate — not tax advice; consult a CPA.
Schools (NCES district)
- District
- Glynn County
- NCES district ID
- 1302400
- Math proficiency
- 37% ▼ -9.00%
- Reading proficiency
- 42% ▼ -7.00%
- Median HH income
- $47,554
- Composite
- 33.83/100
- National rank
- #5359
- State rank
- #47 of 174 in GA
Livability — Country Club Estates
- Score
- 66/100
- State rank
- #179
- US rank
- #11222
Category grades
Schools grade is shown separately in the Schools card above.
Census & demographics
- Census place
- Country Club Estates, GA
- County
- Glynn County · 69,019 people
- Metro
- Brunswick, GA
- Population (ZIP)
- 28,926
- Household income
- $69,493
- Rent vs Own
- Severe rent burden
- 924.0
Population outlook (Glynn County) Hauer SSP2
- Today (2025)
- 91,404 people
- By 2030
- 94,806 · +3.7%
- By 2040
- 100,060 · +9.5%
- By 2050
- 103,258 · +13.0%
- By 2075
- 107,970 · +18.1%
- By 2100
- 103,363 · +13.1%
Race, ethnicity, and origin ACS 2023
- Neighborhood character
- Diverse neighborhood (Simpson 0.56)
- Race & ethnicity
- White 61% Black 23% Hispanic / Latino 9% Two or more races 7%
- Hispanic origin (detail)
- Mexican 4%
- Common ancestry
- Italian 3% Slovak 1% Lithuanian 1%
- Foreign-born
- 6% · Canada
- Languages at home
- 92% English-only · Spanish 7%
Political lean MEDSL · Glynn
- 2024 margin
- Strong R (+26.0) · D 36.8% · R 62.8%
- 2008→2024 swing
- -2.6pp toward R · 2008: -23.4pp · 2024: -26.0pp
- All cycles
- 2024: R+26.0 2020: R+23.2 2016: R+28.6 2012: R+27.0 2008: R+23.4
Not yet ingested
- Civics
- —
Market trends
- HPI YoY
- ▼ -133.03%
- Current HPI
- 162.2528
- Rent YoY
- ▼ -0.16%
- Metro
- Brunswick, GA
- State GDP YoY
- ▲ 2.66%
- F500 in state
- 28
Industry mix (Fortune 500 HQ in GA)
| Industry | F500 HQs | Revenue |
|---|---|---|
| Paper / Packaging | 2 | $29B |
|
||
| Retail | 1 | $160B |
|
||
| Transportation / Logistics | 1 | $91B |
|
||
| Airlines | 1 | $62B |
|
||
| Consumer Goods | 1 | $47B |
|
||
| Utilities | 1 | $25B |
|
||
Price history
-42.9% since first listed3 events — show timeline
- 2026-02-01 Listed $99,900 GIAR
- 2025-04-30 Listing Removed — GIAR
- 2024-10-25 Listed $175,000 GIAR
Property tax history
+7.3%/yrLatest (2025): $524 · -0.0% YoY. Source: county tax records.
Cash-flow waterfall
monthlySold comps — $/sqft
last 12 mo · ≤1 miLoading sold comps…