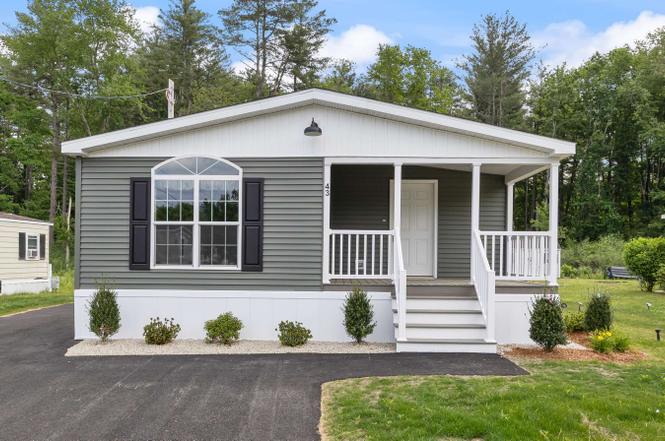
29 Lowell Rd #43 · Methuen Town, MA
Flood risk 6/10 · Moderate
- FEMA flood zone
- X (unshaded)
- Chance of flooding over 30 yrs
- 0.67%
- Est. flood insurance / yr
- $507 – $1,088
Fire risk 1/10 · Minimal
- Est. fire insurance / yr
- $507 – $941
Heat risk 4/10 · Minor
- Hot days now (above 96°F)
- 7 days/yr
- Hot days in 30 yrs
- 15 days/yr
Wind risk 6/10 · Moderate
- Chance of severe wind over 30 yrs
- 27.0%
Air-quality risk 2/10 · Minimal
- Unhealthy air days now
- 2 days/yr
- Unhealthy air days in 30 yrs
- 2 days/yr
Risk factors via First Street. Map © Google.
Why this score? — see what drove the F grade
The composite is a weighted blend of 9 inputs, each scored 0–100. Each bar is that input's sub-score; the figure is the points it added to the 100-point composite (weight × sub-score).
- ARV discount +7.5/15.0
- Cash flow +5.9/30.0
- Schools +4.6/10.0
- Livability +3.7/5.0
- Rent growth +3.2/5.0
- Condition / age +2.5/5.0
- 1% rule +1.9/10.0
- DSCR +0.3/10.0
- Appreciation +0.0/10.0
$369,900
🖨 Deal sheet 📄 Offer letter ✓ Due diligence
Listing remarks MLS
Mobile on Huge PRIVATE Lot with fence AND Brand new12x20 shed with heat/electricity/AC & Cable--being used as a Man cave!!!So many upgrades to the mobile in the past year: New roof, New flooring, Interior just painted, New Living rm ceiling; New Stove & Refrigerator; NEW Propane furnace. Master Bedroom on one side of Mobile with private Master Bath with soaking tub/ separate shower; 2nd bedroom is on opposite side of home with almost private full bath. Coles Park is so convenient to Route 93; shopping and schools
Key facts
- Energy star rated
- Generous dining area
- Versatile bonus room
Tags
Property features AI
Finance
- Other: Taxes TBD
- HOA & community: Monthly association fee of $470 (includes trash); One-time fee of $200; Association provides trash removal
Exterior
- Parking: Paved driveway
- Utilities: Public water; Private sewer; 100 amp electrical service with circuit breaker(s); Propane (LP/Bottle) gas; Internet availability unknown
- Home design: Double wide manufactured home; Located in a mobile home park (Cole's Mobile Home Village); Anchored mobile home; New construction (2026); Green exterior color; Shingle (asphalt) roof; Unit/Lot number 43
- Construction: Vinyl siding; Built in 2026
- Exterior features: Landscaped, level lot; Paved driveway; Paved, private road with private maintenance
Interior
- Kitchen: Dishwasher; Microwave; Electric range; Refrigerator
- Flooring: Vinyl
- Bathrooms: One full bathroom; One 3/4 bathroom
- Heating & cooling: Central air conditioning; Propane heating with forced air
- Interior features: Six total rooms; Vinyl flooring
Neighborhood map
What this means for you Summary
Snapshot
- This is a 2-bed/2.0-bath manufactured listed at $370k.
Deal economics
- At list price, monthly cash flow is $-724 ($-9k/yr) — negative.
- To cash-flow at today's rent, offer at most $242k (34.6% below list).
- To meet the 1% rule (rent ≥ 1% of price), the offer needs to be $254k (31.3% below list).
- Recommended offer: $242k (34.6% below list) — sets the bar for cash-flow.
- Cap rate 3.9% vs local median 2.9% in Methuen Town — top-decile yield for the area; either an underpriced asset or a hidden risk that comps aren't pricing in. Stress-test before assuming the spread holds.
Location & tenants
- Location reads 73/100 on livability (#108 in MA) — a middle-class / working-renter tenant base. Strengths: housing A+, crime A, employment A; Watch: schools D+, commute D+, amenities F.
- Salem School District (suburban): math 47% / reading 56% proficiency, ranked #28 of 98 in NH (top 29%) — acceptable for families but not a draw, mixed tenant base, ~2y average lease; only 14% free/reduced lunch — higher-income household profile.
- Market conditions: Rents rising (+2.6%/yr); 19 comparable units currently listed for rent nearby; rentals leasing fast (median 5d on market — plan ~1-2 weeks tenant-placement turnaround); high-income renter base; 1,276 units permitted in Rockingham County in 2024 (593 in 5+ unit buildings).
Forward outlook
- Local home prices are declining (-3.0%/yr); year-one equity from $3k of loan paydown is wiped out by about $11k of value loss. Plan a longer hold.
Negotiation context
- Only 1 days on market — expect competitive offers; lowballing is unlikely to land.
- 2 sale attempts since 11y ago with the ask held roughly flat each time — persistent listings suggest the price (not the market) is what's stuck; bring a comps-based counter.
- Current owner paid $139k; list at $370k implies a 166% gain — meaningful room to come down on a strong offer.
Risks & watch-outs
- Climate carrying-cost: major flood risk; major wind risk, 27% chance of damaging wind over 30y — expect insurance premiums to compound above CPI over the hold.
Questions for the listing agent
- What do current leases actually rent for vs. the listed asking? Can we see a recent rent roll and the last 12 months of T-12 income?
- What does the HOA fee cover, when was the last increase, and are there any pending special assessments or reserve-fund shortfalls?
- Is there a deadline driving the sale (1031 exchange, divorce, estate, relocation)? That informs how much negotiation room exists.
- Schools are D-rated, which usually means shorter tenancies and higher turnover. Who's the typical renter profile here, and what's been the actual vacancy rate?
- The area grade is low — what's the realistic commute time and amenity access for the typical tenant pool here? Any planned neighborhood developments (good or bad) we should know about?
- What's the average days-on-market for RENTAL listings here right now (not sales)? A rising rental-DOM trend means longer vacancies and softer asking-rent achievability than the comps imply.
- What's the recent tenant-quality profile in this submarket — average credit score on applications, eviction rate, late-payment / NSF rate, and stable-employment percentage? A property-management company in the area should have these aggregated.
- How much new for-sale + rental construction is in the pipeline within 1–3 miles? Heavy new supply typically softens prices + rents 12–24 months out; constrained supply supports both.
Investment metrics
- 1% rule
- 0.69% ✗
- Cap rate
- 3.94%
- Cash-on-cash
- -8.39%
- DSCR
- 0.63
- GRM
- 12.1
CMA / ARV
- ARV (on-the-fly)
- $223,728
- Comps found
- 8
Show comp detail 8 sales within ~0.75 mi
| Address | Dist | Beds/Ba | Sqft | Sold | Price | $/sf | Match |
|---|---|---|---|---|---|---|---|
| 29 Lowell Rd #37 | 0.00mi | 2/1.5 | 924 (-2%) | 4mo | $240,000 | $260 | 91 |
| 29 Lowell Rd #17 | 0.00mi | 2/2.0 | 924 (-2%) | 10mo | $269,000 | $291 | 88 |
| 61 Daisy Rd | 0.22mi | 2/2.0 | 924 (-2%) | 21mo | $219,000 | $237 | 69 |
| 75 S Policy St #36 | 0.43mi | 2/2.0 | 896 (-5%) | 9mo | $225,000 | $251 | 64 |
| 75 S Policy St #62 | 0.43mi | 2/1.0 | 960 (+2%) | 20mo | $165,000 | $172 | 56 |
| 75 South Policy St #48 | 0.43mi | 2/1.0 | 840 (-11%) | 6mo | $139,900 | $167 | 53 |
| 24 Princess Dr | 0.53mi | 2/1.5 | 872 (-8%) | 22mo | $125,000 | $143 | 43 |
| 10 Princess Dr | 0.58mi | 2/1.0 | 840 (-11%) | 18mo | $179,900 | $214 | 35 |
Match score weights: distance 35% · size 25% · config 20% · recency 20%. Top-matched comps best support the ARV.
Projected returns pro-forma
-3.0% appreciation · 2.64% rent growth · sell at horizon
- IRR
- -31.5%
- Equity multiple
- -0.03×
- Total profit
- $-106,830
- Equity at exit
- $55,153
- IRR
- -37.0%
- Equity multiple
- -0.50×
- Total profit
- $-155,554
- Equity at exit
- $31,982
Cash invested: $103,572 (down + closing). Projections, not guarantees.
Landlord ↔ Tenant lean methodology
- Overall (STATE)
- 20 Strongly Tenant-Friendly
- State Massachusetts
- 20 Strongly Tenant-Friendly · D+15
- County
- — inherits STATE
- City
- — inherits STATE
ZIP-level market 03079
- Rents YoY
- 2.6%
- Price-to-rent
- 12.1×
Monthly cashflow live
- Estimated rent
- $2,541 high interval (Pro) →
- Mortgage (P&I)
- −$1,940
- Tax from tax record
- −$168 /mo · $2,015/yr
- Insurance
- −$154
- HOA
- −$470
- Vacancy / Maint / Mgmt
- −$534
- Net cashflow
- $-724
Break-even live
UW: 25.0% down · 7.5% · 30yr · 1.5% tax · 5.0% vac · 8.0% maint · 8.0% mgmt
Financing live
Cash to close
- Down payment
- $92,475
- Closing costs
- $11,097
- Reserves months
- —
- Total cash needed
- —
Loan-product check · same deal, 3 products live
Conventional
25% down · 7.5% · 30yr
- Down + closing
- —
- Monthly P&I
- —
- Monthly cashflow
- —
- DSCR
- —
- Eligible?
- —
Personal DTI + credit; lowest rate.
DSCR
20% down · 8.5% · 30yr
- Down + closing
- —
- Monthly P&I
- —
- Monthly cashflow
- —
- DSCR
- —
- Eligible?
- —
No personal income docs; deal must DSCR.
Hard money
10% down · 12.0% · 12mo
- Down + closing
- —
- Monthly P&I
- —
- Monthly cashflow
- —
- DSCR
- —
- Eligible?
- —
Short-term bridge; refi at stabilization.
Rent comps 19 comps
| Address | Beds | Baths | Sqft | Rent | $/sqft | DOM | Units | Dist |
|---|---|---|---|---|---|---|---|---|
| 103 S Policy St Unit 10 Salem, NH | 2.0 | 1.0 | 775 | $2,100 | $2.71 | 14d | 1 | 0.30mi |
| 103 S Policy St Unit 4 Salem, NH | 1.0 | 1.0 | 650 | $2,000 | $3.08 | 14d | 1 | 0.30mi |
| 3 Artisan Dr Salem, NH | 2.0 | 1.0–2.0 | 920 | $4,401 | $4.78 | 1d | 43 | 0.69mi |
| 15 Artisan Dr Salem, NH | 2.0 | 1.0–2.0 | 910 | $3,873 | $4.26 | 1d | 35 | 0.77mi |
| 18 Artisan Dr Salem, NH | 1.0 | 1.0 | 857 | $3,200 | $3.73 | 1d | 1 | 0.78mi |
| 11 Lancelot Ct #7 Salem, NH | 2.0 | 1.0 | 676 | $1,850 | $2.74 | 4d | 1 | 0.82mi |
| 4 Tuscan Blvd Salem, NH | 2.0 | 1.0–2.0 | 739 | $3,390 | $4.58 | 1d | 18 | 0.84mi |
| 8 Lancelot Ct #13 Salem, NH | 2.0 | 1.0 | 914 | $1,990 | $2.18 | 24d | 1 | 0.84mi |
| 3 Lancelot Ct Salem, NH | 2.0 | 1.0 | 736 | $1,800 | $2.45 | 43d | 1 | 0.85mi |
| 1 Lancelot Ct #2 Salem, NH | 2.0 | 1.0 | 728 | $1,950 | $2.68 | 24d | 1 | 0.86mi |
| 22 Via Toscana Salem, NH | 2.0 | 1.0–2.0 | 846 | $4,598 | $5.43 | 1d | 61 | 0.87mi |
| 117 Cluff Crossing Rd Salem, NH | 2.0 | 1.0 | 980 | $2,250 | $2.30 | 43d | 1 | 0.90mi |
| 800 Central St Salem, NH | 2.0 | 1.0–2.0 | 776 | $2,825 | $3.64 | 1d | 14 | 0.94mi |
| 4 Brook Rd #5 Salem, NH | 2.0 | 1.0 | 891 | $2,400 | $2.69 | 43d | 1 | 1.07mi |
| 9 Tiffany Rd #1 Salem, NH | 1.0 | 1.0 | 780 | $1,850 | $2.37 | 4d | 1 | 1.12mi |
| 9 Tiffany Rd #1 Salem, NH | 1.0 | 1.0 | 780 | $1,850 | $2.37 | 24d | 1 | 1.12mi |
| 14 Tiffany Rd #2 Salem, NH | 1.0 | 1.0 | 777 | $1,695 | $2.18 | 10d | 1 | 1.12mi |
| 14 Tiffany Rd Salem, NH | 1.0 | 1.0 | 777 | $1,712 | $2.20 | 4d | 2 | 1.12mi |
| 8 Braemoor Woods Rd Salem, NH | 2.0 | 1.0 | 950 | $1,854 | $1.95 | 1d | 1 | 1.36mi |
HOA detail
- Monthly dues
- $470 · $5,640/yr
- Likely covers
- electriccable
Listing history 2 events
-
2026-06-18remarks 699-char remark
-
2026-06-18$369,900 Active 1 DOM
ⓘ Source: listings_history table (triggers on properties + properties_extension) + one-shot
backfill from property_details.listing_events for pre-trigger history.
Tax reassessment forecast MA · Partial reset (capped growth)
- Current annual tax
- $2,015 · $168/mo
- Projected year-2 tax
- $3,282 · $274/mo
- Expected delta
- +$1,267/yr (+$106/mo · 62.9%)
ⓘ Screening estimate from a state-policy table — verify with the county assessor before closing.
Climate risk First Street
- Flood 6/10 Major FEMA zone X (unshaded) · 67% chance over 30 yrs
- Wildfire 1/10 Low
- Heat 4/10 Moderate 7 d/yr ≥96°F today · 15 d/yr by 30 yrs out
- Wind 6/10 Major 27% chance of damaging wind over 30 yrs
- Air quality 2/10 Low 2 unhealthy d/yr today · 2 by 30 yrs out
Nearby sold comps map
Loading sold comps map…
Walkable amenities ~0.75 mi
Loading nearby amenities…
Taxation est. · year 1
- Rental income
- $30,497
- − Mortgage interest
- −$20,720
- − Property taxes
- −$2,015
- − Insurance
- −$1,850
- − Repairs & maintenance
- −$2,440
- − Management
- −$2,440
- − HOA
- −$5,640
- − Depreciation
- −$10,761
- Taxable loss
- −$15,368
- Est. tax savings @ 24.0%
- +$3,688
- After-tax cash flow
- $-5,001/yr
For passive investors: Depreciation is non-cash, so a rental often shows a tax loss while cash-flowing — sheltering income. Rental losses are passive: they offset passive income freely, and up to $25,000/yr can offset ordinary (W-2) income if you actively participate and your MAGI is under $100k (phasing out to $0 by $150k); unused losses carry forward. On sale, claimed depreciation is recaptured at up to 25%, and gains may owe capital-gains tax (a 1031 exchange can defer both). Figures are a year-1 estimate at your 24.0% rate — not tax advice; consult a CPA.
Schools (NCES district)
- District
- Salem School District
- NCES district ID
- 3306060
- Math proficiency
- 47% ▼ -4.00%
- Reading proficiency
- 56% ▼ -2.00%
- Median HH income
- $75,648
- Composite
- 46.45/100
- National rank
- #2446
- State rank
- #28 of 98 in NH
Livability — Methuen Town
- Score
- 73/100
- State rank
- #108
- US rank
- #5537
Category grades
Schools grade is shown separately in the Schools card above.
Census & demographics
- County
- Rockingham County
- City population
- 53,015
- Metro
- Boston-Cambridge-Newton, MA-NH
- Population (ZIP)
- 30,964
- Household income
- $110,490
- Rent vs Own
- Severe rent burden
- 702.0
Population outlook (Rockingham County) Hauer SSP2
- Today (2025)
- 316,118 people
- By 2030
- 320,929 · +1.5%
- By 2040
- 323,358 · +2.3%
- By 2050
- 314,977 · -0.4%
- By 2075
- 297,686 · -5.8%
- By 2100
- 256,363 · -18.9%
Race, ethnicity, and origin ACS 2023
- Neighborhood character
- Predominantly White (82%)
- Race & ethnicity
- White 82% Hispanic / Latino 9% Two or more races 4% Asian 4%
- Hispanic origin (detail)
- Puerto Rican 2% Dominican 4%
- Common ancestry
- Lithuanian 9% Romanian 4% Russian 4%
- Foreign-born
- 11% · Canada, Vietnam, South Korea
- Languages at home
- 88% English-only · Spanish 6% Other Asian/Pacific 2% Other Indo-European 1%
Political lean MEDSL · Rockingham
- 2024 margin
- Toss-up / Even · D 48.3% · R 50.8%
- 2008→2024 swing
- -3.5pp toward R · 2008: 1.1pp · 2024: -2.4pp
- All cycles
- 2024: R+2.4 2020: D+2.1 2016: R+5.8 2012: R+4.5 2008: D+1.1
Not yet ingested
- Civics
- —
Market trends
- HPI YoY
- ▼ -265.55%
- Current HPI
- 311.547
- Rent YoY
- ▲ 2.64%
- Metro
- Boston-Cambridge-Newton, MA-NH
- State GDP YoY
- ▲ 2.28%
- F500 in state
- 38
Industry mix (Fortune 500 HQ in MA)
| Industry | F500 HQs | Revenue |
|---|---|---|
| Technology | 3 | $17B |
|
||
| Insurance | 2 | $84B |
|
||
| Retail | 2 | $76B |
|
||
| Life Sciences | 1 | $43B |
|
||
| Energy Technology | 1 | $31B |
|
||
| Aerospace / Defense | 1 | $18B |
|
||
Price history
+393.2% since first listed6 events — show timeline
- 2026-06-18 Listed $369,900 PrimeMLS
- 2018-05-01 Sold (Public Records) $139,000 Public Records
- 2015-10-27 Sold (MLS) $60,000 PrimeMLS
- 2015-08-25 Contingent — PrimeMLS
- 2015-07-10 Listed $69,900 PrimeMLS
- 1988-06-30 Sold (Public Records) $75,000 Public Records
Property tax history
+9.0%/yrLatest (2024): $2,015 · +3.8% YoY. Source: county tax records.
Cash-flow waterfall
monthlySold comps — $/sqft
last 12 mo · ≤1 miLoading sold comps…