1193 E 15 Mile Rd · Bruce, MI
Flood risk 1/10 · Minimal
- FEMA flood zone
- X (unshaded)
- Chance of flooding over 30 yrs
- 0.0%
- Est. flood insurance / yr
- $473 – $860
Fire risk 5/10 · Moderate
- Est. fire insurance / yr
- $784 – $1,456
Heat risk 1/10 · Minimal
- Hot days now (above 87°F)
- 7 days/yr
- Hot days in 30 yrs
- 14 days/yr
Wind risk 1/10 · Minimal
- Chance of severe wind over 30 yrs
- —
Air-quality risk 1/10 · Minimal
- Unhealthy air days now
- 0 days/yr
- Unhealthy air days in 30 yrs
- 0 days/yr
Risk factors via First Street. Map © Google.
Why this score? — see what drove the F grade
The composite is a weighted blend of 9 inputs, each scored 0–100. Each bar is that input's sub-score; the figure is the points it added to the 100-point composite (weight × sub-score).
- Appreciation +10.0/10.0
- ARV discount +7.5/15.0
- Cash flow +6.1/30.0
- Schools +3.3/10.0
- Rent growth +2.5/5.0
- Livability +2.5/5.0
- Condition / age +2.5/5.0
- DSCR +0.4/10.0
- 1% rule +0.1/10.0
$185,000
🖨 Deal sheet (PDF) 📄 Offer letter ✓ Due diligence
Listing remarks MLS
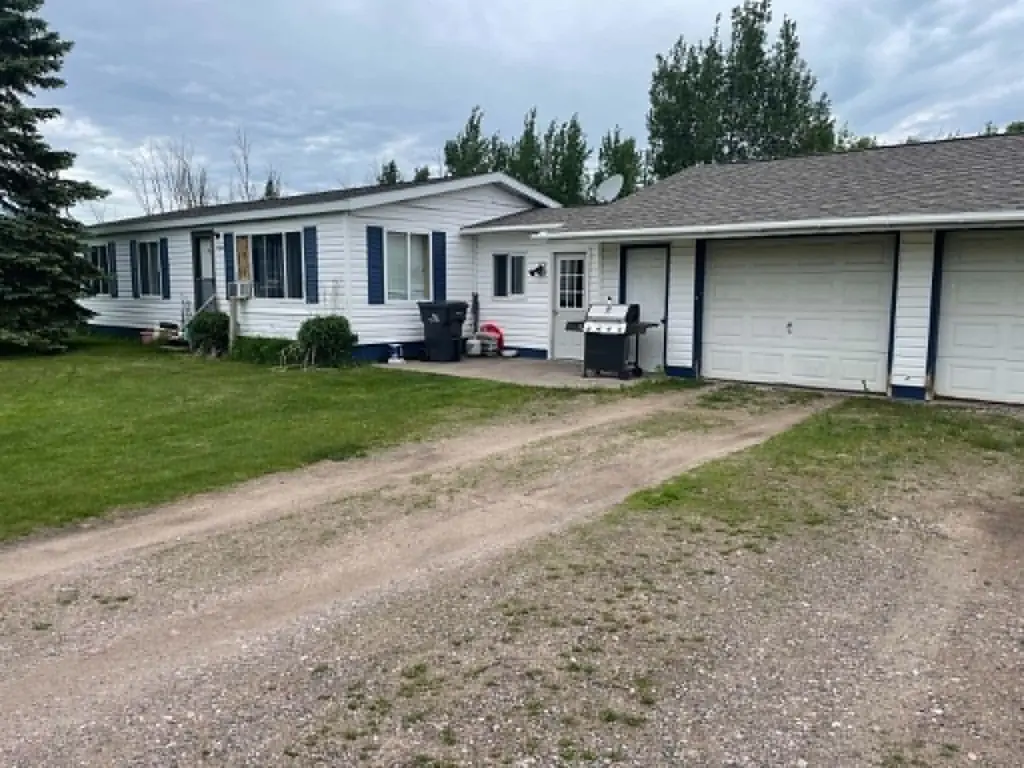
Move in ready house with easy access to the Sault, Kinross or Pickford. Three bedroom, one bath, 2.5 car attached garage with updates plus 3 acres. Only 5 miles from Barbeau boat launch. Must see!!! Call for appointment.
Key facts
- Attached garage
- 3 sprawling acres
- 3.24 acre lot
Tags
Property features AI
Exterior
- Utilities: Well water; Septic tank; Electric service on property
- Home design: Manufactured home; One story
- Construction: Vinyl siding; Block foundation; Built as a manufactured home
- Exterior features: Few trees; Asphalt roof
Interior
- Kitchen: Gas range; Range hood
- Bedrooms: Total rooms: 9
- Flooring: Laminate
- Bathrooms: 1 full bathroom
- Heating & cooling: Forced air heating; Propane heating; No central cooling
- Interior features: Ceiling fan(s); Double pane windows
- Laundry & utility: Washer; Dryer (main level)
Neighborhood map
What this means for you Summary
Snapshot
- This is a 3-bed/1.0-bath manufactured listed at $185k.
Deal economics
- At list price, monthly cash flow is $-349 ($-4k/yr) — negative.
- To cash-flow at today's rent, offer at most $123k (33.3% below list).
- To meet the 1% rule (rent ≥ 1% of price), the offer needs to be $95k (48.6% below list).
- Recommended offer: $95k (48.6% below list) — sets the bar for 1% rule.
Location & tenants
- Location reads: area grade F — affects rentability + tenant quality, not the cash-flow math above.
- Sault Ste. Marie Area Schools (town): math 35% / reading 44% proficiency, ranked #230 of 540 in MI (top 43%) — families likely to look elsewhere, expect single-tenant / working-renter base with shorter leases.
- Zoned schools: Sault Area Middle School (math 35% / reading 46%, grade F, #202 of 493 statewide, top 42%, 533 students, 50% FRL).
- Market conditions: 3 active listings in the ZIP; 92 units permitted in Chippewa County in 2024 (40 in 5+ unit buildings).
Forward outlook
- In year one you build about $20k of equity ($1k loan paydown + $18k appreciation (10.0% local appreciation)).
- Chippewa County population projected at -10% by 2050 — secular population decline; favor cash flow + early exit over multi-decade hold.
- By year 2, paydown + projected appreciation supports a ~$32k cash-out refi (75% LTV) — recoverable capital for the next deal without selling this one.
Negotiation context
- Only 6 days on market — expect competitive offers; lowballing is unlikely to land.
- 2 sale attempts since 9y ago with the ask held roughly flat each time — persistent listings suggest the price (not the market) is what's stuck; bring a comps-based counter.
- Current owner paid $78k; list at $185k implies a 137% gain — meaningful room to come down on a strong offer.
Risks & watch-outs
- Climate carrying-cost: moderate wildfire risk — expect insurance premiums to compound above CPI over the hold.
Questions for the listing agent
- What do current leases actually rent for vs. the listed asking? Can we see a recent rent roll and the last 12 months of T-12 income?
- Is there a deadline driving the sale (1031 exchange, divorce, estate, relocation)? That informs how much negotiation room exists.
- The area grade is low — what's the realistic commute time and amenity access for the typical tenant pool here? Any planned neighborhood developments (good or bad) we should know about?
- What's the average days-on-market for RENTAL listings here right now (not sales)? A rising rental-DOM trend means longer vacancies and softer asking-rent achievability than the comps imply.
- What's the recent tenant-quality profile in this submarket — average credit score on applications, eviction rate, late-payment / NSF rate, and stable-employment percentage? A property-management company in the area should have these aggregated.
- How much new for-sale + rental construction is in the pipeline within 1–3 miles? Heavy new supply typically softens prices + rents 12–24 months out; constrained supply supports both.
Investment metrics
- 1% rule
- 0.51% ✗
- Cap rate
- 4.03%
- Cash-on-cash
- -8.08%
- DSCR
- 0.64
- GRM
- 16.2
CMA / ARV
No comps found within radius.
Projected returns pro-forma
10.0% appreciation · 3.0% rent growth · sell at horizon
- IRR
- 18.6%
- Equity multiple
- 2.51×
- Total profit
- $78,441
- Equity at exit
- $166,663
- IRR
- 17.2%
- Equity multiple
- 5.79×
- Total profit
- $248,280
- Equity at exit
- $359,414
Cash invested: $51,800 (down + closing). Projections, not guarantees.
Landlord ↔ Tenant lean methodology
- Overall (STATE)
- 62 Landlord-Friendly
- State Michigan
- 62 Landlord-Friendly · EVEN
- County
- — inherits STATE
- City
- — inherits STATE
ZIP-level market 49724
- Home prices YoY
- 14.1%
- Active inventory
- 3
- Price-to-rent
- 16.2×
Monthly cashflow live
- Estimated rent
- $950 medium interval (Pro) →
- Mortgage (P&I)
- −$970
- Tax from tax record
- −$52 /mo · $630/yr
- Insurance
- −$77
- HOA
- −$0
- Lot rent leased land?
- −$0
- Vacancy / Maint / Mgmt
- −$200
- Net cashflow
- $-349
Break-even live
Sensitivity live
| Price | -10% $-244 | -5% $-296 | +0% $-349 | +5% $-401 | +10% $-454 |
|---|---|---|---|---|---|
| Rent | -10% $-424 | -5% $-386 | +0% $-349 | +5% $-311 | +10% $-274 |
| Rate | -1.0pp $-256 | -0.5pp $-302 | base $-349 | +0.5pp $-397 | +1.0pp $-446 |
UW: 25.0% down · 7.5% · 30yr · 1.5% tax · 5.0% vac · 8.0% maint · 8.0% mgmt
Financing live
Cash to close
- Down payment
- $46,250
- Closing costs
- $5,550
- Reserves months
- —
- Total cash needed
- —
Loan-product check · same deal, 3 products live
Conventional
25% down · 7.5% · 30yr
- Down + closing
- —
- Monthly P&I
- —
- Monthly cashflow
- —
- DSCR
- —
- Eligible?
- —
Personal DTI + credit; lowest rate.
DSCR
20% down · 8.5% · 30yr
- Down + closing
- —
- Monthly P&I
- —
- Monthly cashflow
- —
- DSCR
- —
- Eligible?
- —
No personal income docs; deal must DSCR.
Hard money
10% down · 12.0% · 12mo
- Down + closing
- —
- Monthly P&I
- —
- Monthly cashflow
- —
- DSCR
- —
- Eligible?
- —
Short-term bridge; refi at stabilization.
Listing history 6 events
-
2026-06-22days on market $185,000 Active 6 DOM
-
2026-06-21days on market $185,000 Active 5 DOM
-
2026-06-21days on market $185,000 Active 4 DOM
-
2026-06-18days on market $185,000 Active 2 DOM
-
2026-06-17remarks 699-char remark
-
2026-06-17$185,000 Active 1 DOM
ⓘ Source: listings_history table (triggers on properties + properties_extension) + one-shot
backfill from property_details.listing_events for pre-trigger history.
Tax reassessment forecast MI · Partial reset (capped growth)
- Current annual tax
- $630 · $52/mo
- Projected year-2 tax
- $1,739 · $145/mo
- Expected delta
- +$1,110/yr (+$92/mo · 176.3%)
ⓘ Screening estimate from a state-policy table — verify with the county assessor before closing.
Climate risk First Street
- Flood 1/10 Low FEMA zone X (unshaded) · 0% chance over 30 yrs
- Wildfire 5/10 Major
- Heat 1/10 Low 7 d/yr ≥87°F today · 14 d/yr by 30 yrs out
- Wind 1/10 Low
- Air quality 1/10 Low 0 unhealthy d/yr today · 0 by 30 yrs out
Nearby sold comps map
Loading sold comps map…
Walkable amenities ~0.75 mi
Loading nearby amenities…
Taxation est. · year 1
- Rental income
- $11,405
- − Mortgage interest
- −$10,363
- − Property taxes
- −$630
- − Insurance
- −$925
- − Repairs & maintenance
- −$912
- − Management
- −$912
- − Depreciation
- −$5,382
- Taxable loss
- −$7,719
- Est. tax savings @ 24.0%
- +$1,853
- After-tax cash flow
- $-2,334/yr
For passive investors: Depreciation is non-cash, so a rental often shows a tax loss while cash-flowing — sheltering income. Rental losses are passive: they offset passive income freely, and up to $25,000/yr can offset ordinary (W-2) income if you actively participate and your MAGI is under $100k (phasing out to $0 by $150k); unused losses carry forward. On sale, claimed depreciation is recaptured at up to 25%, and gains may owe capital-gains tax (a 1031 exchange can defer both). Figures are a year-1 estimate at your 24.0% rate — not tax advice; consult a CPA.
Schools (NCES district)
- District
- Sault Ste. Marie Area Schools
- NCES district ID
- 2630990
- Math proficiency
- 35% ▼ -9.00%
- Reading proficiency
- 44% ▼ -12.00%
- Median HH income
- $40,273
- Composite
- 33.12/100
- National rank
- #5559
- State rank
- #230 of 540 in MI
Livability — Bruce
No livability data for this city. (Only ~50 U.S. cities are tracked.)
Census & demographics
- Population (ZIP)
- 1,172
Population outlook (Chippewa County) Hauer SSP2
- Today (2025)
- 37,043 people
- By 2030
- 36,431 · -1.7%
- By 2040
- 34,911 · -5.8%
- By 2050
- 33,350 · -10.0%
- By 2075
- 29,789 · -19.6%
- By 2100
- 24,171 · -34.7%
Race, ethnicity, and origin ACS 2023
- Neighborhood character
- Predominantly White (81%)
- Race & ethnicity
- White 81% Two or more races 6% Asian 6% Native American 6% Hispanic / Latino 1% Pacific Islander 1%
- Common ancestry
- Lithuanian 11% Iranian 6% Romanian 5%
- Foreign-born
- 4% · China, Canada, Vietnam
- Languages at home
- 98% English-only · Chinese 2%
Political lean MEDSL · Chippewa
- 2024 margin
- Strong R (+24.2) · D 37.0% · R 61.3% · Other 1.7%
- 2008→2024 swing
- -23.8pp toward R · 2008: -0.5pp · 2024: -24.2pp
- All cycles
- 2024: R+24.2 2020: R+22.9 2016: R+24.2 2012: R+7.6 2008: R+0.5
Not yet ingested
- Civics
- —
Market trends
- HPI YoY
- ▲ 25.80%
- Current HPI
- 208.6557
- Rent YoY
- —
- Metro
- —
- State GDP YoY
- ▲ 1.37%
- F500 in state
- 28
Industry mix (Fortune 500 HQ in MI)
| Industry | F500 HQs | Revenue |
|---|---|---|
| Automotive Parts | 3 | $48B |
|
||
| Automotive | 2 | $372B |
|
||
| Chemicals | 1 | $45B |
|
||
| Automotive Retail | 1 | $29B |
|
||
| Healthcare / Medical Devices | 1 | $23B |
|
||
| Automotive Technology | 1 | $20B |
|
||
Price history
+107.9% since first listed4 events — show timeline
- 2026-06-17 Listed $185,000 EUPBR
- 2017-09-27 Sold (Public Records) $78,000 Public Records
- 2017-09-27 Sold (MLS) — EUPBR
- 2017-07-18 Listed $89,000 EUPBR
Property tax history
-3.3%/yrLatest (2024): $630 · -9.7% YoY. Source: county tax records.
Cash-flow waterfall
monthlySold comps — $/sqft
last 12 mo · ≤1 miLoading sold comps…