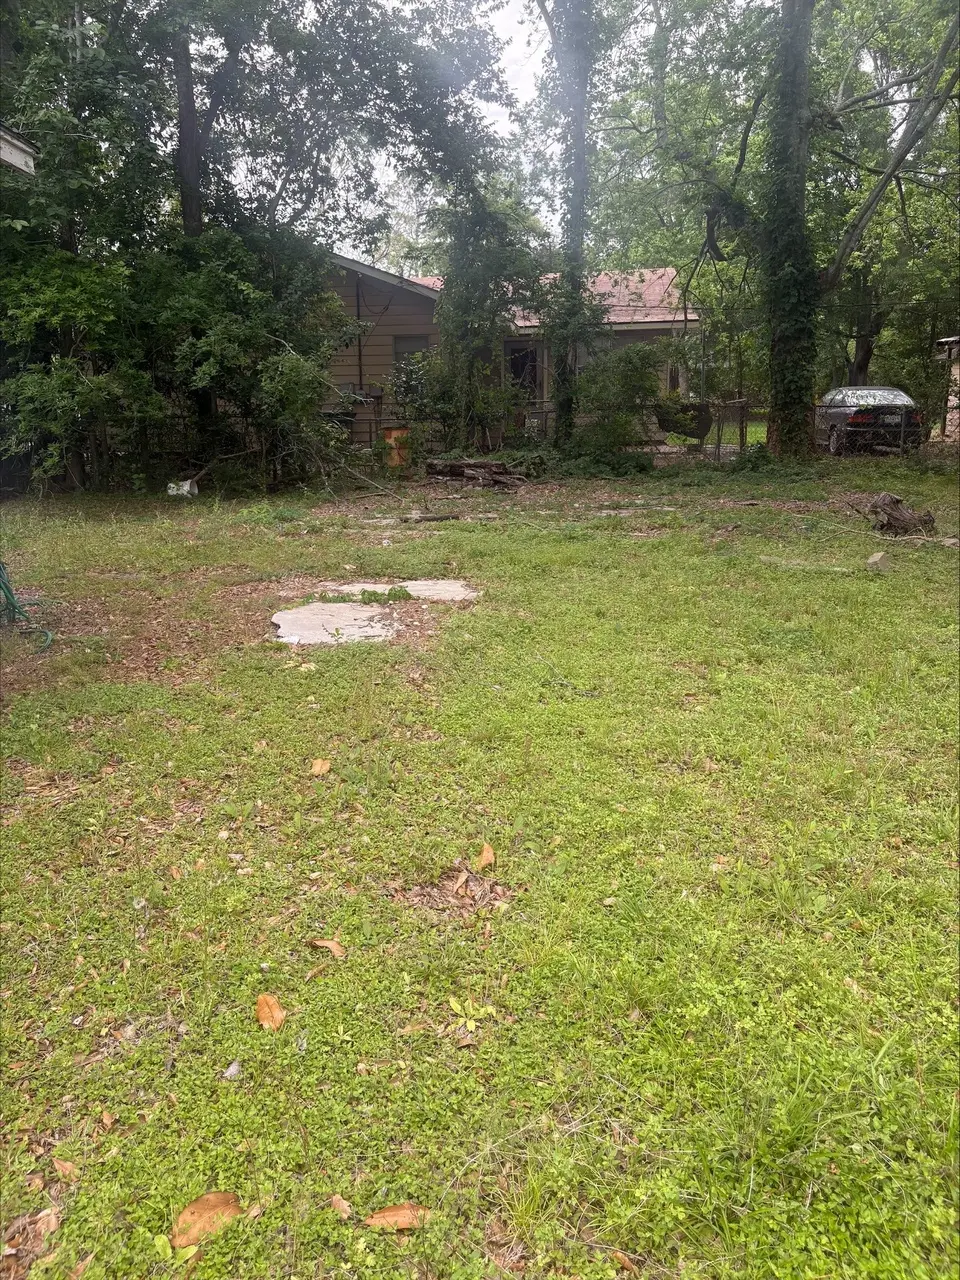
4290 Cleveland St · Beaumont, TX
Flood risk 4/10 · Minor
- FEMA flood zone
- X
- Chance of flooding over 30 yrs
- 0.22%
- Est. flood insurance / yr
- $507 – $1,088
Fire risk 1/10 · Minimal
- Est. fire insurance / yr
- $1,222 – $2,270
Heat risk 9/10 · Severe
- Hot days now (above 109°F)
- 7 days/yr
- Hot days in 30 yrs
- 24 days/yr
Wind risk 9/10 · Severe
- Chance of severe wind over 30 yrs
- 99.0%
Air-quality risk 2/10 · Minimal
- Unhealthy air days now
- 1 days/yr
- Unhealthy air days in 30 yrs
- 1 days/yr
Risk factors via First Street. Map © Google.
Why this score? — see what drove the B grade
The composite is a weighted blend of 9 inputs, each scored 0–100. Each bar is that input's sub-score; the figure is the points it added to the 100-point composite (weight × sub-score).
- Cash flow +30.0/30.0
- 1% rule +10.0/10.0
- DSCR +10.0/10.0
- Appreciation +7.7/10.0
- ARV discount +7.5/15.0
- Livability +3.2/5.0
- Rent growth +2.5/5.0
- Condition / age +2.5/5.0
- Schools +1.5/10.0
$36,000
🖨 Deal sheet 📄 Offer letter ✓ Due diligence
Listing remarks MLS
The house is not included in the price. This is a teardown and a large lot.
Key facts
- 0.32 acre lot
- Built 1962
- Listed 57 days
Neighborhood map
What this means for you Summary
Snapshot
- This is a 2-bed/1.0-bath single-family listed at $36k.
Deal economics
- At list price, monthly cash flow is $536 ($6k/yr) — positive.
- The deal already cash-flows at list — no discount required.
- Meets the 1% rule at list price ($1k rent vs $36k).
- Recommended offer: $35k (3.0% below list) — sets the bar for market timing.
- Cap rate 24.1% vs local median 5.3% in Beaumont — top-decile yield for the area; either an underpriced asset or a hidden risk that comps aren't pricing in. Stress-test before assuming the spread holds.
Location & tenants
- Location reads 64/100 on livability (#739 in TX) — a middle-class / working-renter tenant base. Strengths: cost of living A+, housing A+, health & safety A+; Watch: employment D, schools D-, crime F.
- Beaumont ISD (urban): math 14% / reading 22% proficiency, ranked #789 of 826 in TX (top 96%) — low school quality limits family demand, transient renter base, plan for 1-2y turnover; 69% free/reduced lunch — lower-income household profile, screen leases tightly.
- Market conditions: 79 active listings in the ZIP; 18 comparable units currently listed for rent nearby; rentals at typical pace (median 23d on market — plan ~3-4 weeks tenant-placement turnaround); lower-income renter base — watch delinquency; 343 units permitted in Jefferson County in 2024 (0 in 5+ unit buildings).
- This rent runs 41% of the median local income ($32k/yr) — at the standard rent-burdened threshold; future hikes will face affordability resistance.
Forward outlook
- In year one you build about $2k of equity ($249 loan paydown + $2k appreciation (5.4% local appreciation)).
- At projected returns (5.4% appreciation + 3.0% rent growth), your $10k cash investment doubles in ~2 years — after that, you're playing with house money.
Negotiation context
- It's been on market 57 days — a 3% lower offer ($35k) is reasonable based on typical stale-listing flexibility.
Risks & watch-outs
- Watch-outs: property tax is 4.1% of price.
- Climate carrying-cost: severe wind risk, 99% chance of damaging wind over 30y; extreme-heat days projected 7→24/yr by 2055 (HVAC capex compounding) — expect insurance premiums to compound above CPI over the hold.
Questions for the listing agent
- It's been on market 57 days. Have you received any prior offers? Is the seller open to a 3% concession, seller financing, or rate buy-down credit?
- Built in 1962 — when were the roof, HVAC, electrical panel, plumbing, and water heater last replaced?
- Property tax is high relative to price — has the assessment been appealed recently, and will the sale trigger a re-assessment?
- Is there a deadline driving the sale (1031 exchange, divorce, estate, relocation)? That informs how much negotiation room exists.
- Schools are D-rated, which usually means shorter tenancies and higher turnover. Who's the typical renter profile here, and what's been the actual vacancy rate?
- Crime grade is F in this area — have there been break-ins, vandalism, or insurance claims at this property in the last 3 years? What carrier currently insures it and at what premium?
- What's the average days-on-market for RENTAL listings here right now (not sales)? A rising rental-DOM trend means longer vacancies and softer asking-rent achievability than the comps imply.
- What's the recent tenant-quality profile in this submarket — average credit score on applications, eviction rate, late-payment / NSF rate, and stable-employment percentage? A property-management company in the area should have these aggregated.
- How much new for-sale + rental construction is in the pipeline within 1–3 miles? Heavy new supply typically softens prices + rents 12–24 months out; constrained supply supports both.
Investment metrics
- 1% rule
- 3.03% ✓
- Cap rate
- 24.14%
- Cash-on-cash
- 63.75%
- DSCR
- 3.84
- GRM
- 2.7
CMA / ARV
- ARV (median comp)
- $97,102
- List price
- $36,000
- Delta
- -62.93%
- Verdict
- UNDERPRICED
- Comps
- 20 within 1.0 mi
Show comp detail 6 sales within ~0.75 mi
| Address | Dist | Beds/Ba | Sqft | Sold | Price | $/sf | Match |
|---|---|---|---|---|---|---|---|
| 2490 Overbrook Ln | 0.36mi | 2/1.0 | 1,170 (+9%) | 9mo | $79,000 | $68 | 61 |
| 1725 Rivercrest St | 0.57mi | 3/2.0 (+1) | 1,086 (+1%) | 5mo | $135,000 | $124 | 59 |
| 2435 Fillmore St | 0.19mi | 3/1.0 (+1) | 976 (-9%) | 16mo | $75,000 | $77 | 58 |
| 4045 Dallas Ave | 0.52mi | 3/1.0 (+1) | 1,083 (+1%) | 16mo | $49,999 | $46 | 56 |
| 4335 Dallas St | 0.58mi | 3/1.0 (+1) | 1,200 (+12%) | 4mo | $55,000 | $46 | 46 |
| 4295 Harding Dr | 0.69mi | 3/1.0 (+1) | 1,190 (+11%) | 18mo | $69,000 | $58 | 30 |
Match score weights: distance 35% · size 25% · config 20% · recency 20%. Top-matched comps best support the ARV.
Projected returns pro-forma
5.43% appreciation · 3.0% rent growth · sell at horizon
- IRR
- 71.0%
- Equity multiple
- 5.30×
- Total profit
- $43,370
- Equity at exit
- $21,359
- IRR
- 68.5%
- Equity multiple
- 11.05×
- Total profit
- $101,350
- Equity at exit
- $37,681
Cash invested: $10,080 (down + closing). Projections, not guarantees.
Landlord ↔ Tenant lean methodology
- Overall (STATE)
- 87 Strongly Landlord-Friendly
- State Texas
- 87 Strongly Landlord-Friendly · R+5
- County
- — inherits STATE
- City
- — inherits STATE
ZIP-level market 77703
- Home prices YoY
- 3.7%
- Active inventory
- 79
- Price-to-rent
- 2.7×
Monthly cashflow live
- Estimated rent
- $1,092 high interval (Pro) →
- Mortgage (P&I)
- −$189
- Tax from tax record
- −$123 /mo · $1,480/yr
- Insurance
- −$15
- HOA
- −$0
- Vacancy / Maint / Mgmt
- −$229
- Net cashflow
- $536
Break-even live
UW: 25.0% down · 7.5% · 30yr · 1.5% tax · 5.0% vac · 8.0% maint · 8.0% mgmt
Financing live
Cash to close
- Down payment
- $9,000
- Closing costs
- $1,080
- Reserves months
- —
- Total cash needed
- —
Loan-product check · same deal, 3 products live
Conventional
25% down · 7.5% · 30yr
- Down + closing
- —
- Monthly P&I
- —
- Monthly cashflow
- —
- DSCR
- —
- Eligible?
- —
Personal DTI + credit; lowest rate.
DSCR
20% down · 8.5% · 30yr
- Down + closing
- —
- Monthly P&I
- —
- Monthly cashflow
- —
- DSCR
- —
- Eligible?
- —
No personal income docs; deal must DSCR.
Hard money
10% down · 12.0% · 12mo
- Down + closing
- —
- Monthly P&I
- —
- Monthly cashflow
- —
- DSCR
- —
- Eligible?
- —
Short-term bridge; refi at stabilization.
Rent comps 18 comps
| Address | Beds | Baths | Sqft | Rent | $/sqft | DOM | Units | Dist |
|---|---|---|---|---|---|---|---|---|
| 2270 Johnson St Beaumont, TX | 2.0 | 1.0 | 700 | $800 | $1.14 | 23d | 1 | 0.15mi |
| 2420 Wilson St Beaumont, TX | 2.0 | 1.0 | 840 | $1,200 | $1.43 | 43d | 1 | 0.20mi |
| 2450 N Lynwood Dr Beaumont, TX | 3.0 | 1.0 | 1015 | $1,175 | $1.16 | 23d | 1 | 0.22mi |
| 2530 Pierce St Beaumont, TX | 2.0 | 1.0 | 950 | $1,000 | $1.05 | 43d | 1 | 0.22mi |
| 2550 Pierce St Beaumont, TX | 2.0 | 1.0 | 1044 | $1,050 | $1.01 | 43d | 1 | 0.23mi |
| 2555 Pierce St Beaumont, TX | 3.0 | 2.0 | 1364 | $1,450 | $1.06 | 23d | 1 | 0.24mi |
| 4565 Detroit St Beaumont, TX | 2.0 | 1.0 | 880 | $995 | $1.13 | 44d | 1 | 0.45mi |
| 2125 Earl St Beaumont, TX | 2.0 | 1.0 | 785 | $900 | $1.15 | 23d | 1 | 0.57mi |
| 2125 Earl St Beaumont, TX | 2.0 | 1.0 | 785 | $995 | $1.27 | 43d | 1 | 0.57mi |
| 2575 Primrose St Unit 3 Beaumont, TX | 2.0 | 1.0 | 800 | $900 | $1.12 | 23d | 1 | 0.65mi |
| 4325 Woodlawn St Beaumont, TX | 2.0 | 1.0 | 1150 | $1,000 | $0.87 | 13d | 1 | 0.77mi |
| 5070 Wilshire St Beaumont, TX | 2.0 | 1.0 | 1042 | $1,295 | $1.24 | 13d | 1 | 0.81mi |
| 2023 Delaware St Beaumont, TX | 3.0 | 1.0 | 1180 | $1,300 | $1.10 | 43d | 1 | 0.86mi |
| 3255 Charles St Beaumont, TX | 3.0 | 1.0 | 1396 | $1,350 | $0.97 | 43d | 1 | 0.99mi |
| 5080 Helbig Rd Beaumont, TX | 2.0–3.0 | 1.0 | 775 | $450 | $0.58 | 13d | 1 | 1.05mi |
| 3910 Baldwin St Beaumont, TX | 3.0 | 1.0 | 1220 | $1,200 | $0.98 | 23d | 1 | 1.12mi |
| 2020 Cottonwood St Beaumont, TX | 2.0–4.0 | 1.0 | 928 | $1,123 | $1.21 | 13d | 9 | 1.30mi |
| 3155 French Rd Beaumont, TX | 1.0–3.0 | 1.0–2.0 | 905 | $917 | $1.01 | 13d | 9 | 1.36mi |
Listing history 16 events
-
2026-06-18days on market $36,000 Active 57 DOM
-
2026-06-17days on market $36,000 Active 56 DOM
-
2026-06-16days on market $36,000 Active 55 DOM
-
2026-06-15days on market $36,000 Active 54 DOM
-
2026-06-14days on market $36,000 Active 52 DOM
-
2026-06-13days on market $36,000 Active 51 DOM
-
2026-06-10days on market $36,000 Active 49 DOM
-
2026-06-09days on market $36,000 Active 48 DOM
-
2026-06-08days on market $36,000 Active 47 DOM
-
2026-06-07days on market $36,000 Active 46 DOM
-
2026-06-03days on market $36,000 Active 42 DOM
-
2026-06-02days on market $36,000 Active 41 DOM
-
2026-06-01days on market $36,000 Active 40 DOM
-
2026-05-31days on market $36,000 Active 39 DOM
-
2026-05-30days on market $36,000 Active 38 DOM
-
2026-04-22$36,000 Active 75-char remark
Show marketing remark (75 chars)
The house is not included in the price. This is a teardown and a large lot.
ⓘ Source: listings_history table (triggers on properties + properties_extension) + one-shot
backfill from property_details.listing_events for pre-trigger history.
Tax reassessment forecast TX · Resets to sale price
- Current annual tax
- $1,480 · $123/mo
- Projected year-2 tax
- $1,480 · $123/mo
- Expected delta
- $0/yr ($0/mo · 0.0%)
ⓘ Screening estimate from a state-policy table — verify with the county assessor before closing.
Climate risk First Street
- Flood 4/10 Moderate FEMA zone X · 22% chance over 30 yrs
- Wildfire 1/10 Low
- Heat 9/10 Extreme 7 d/yr ≥109°F today · 24 d/yr by 30 yrs out
- Wind 9/10 Extreme 99% chance of damaging wind over 30 yrs
- Air quality 2/10 Low 1 unhealthy d/yr today · 1 by 30 yrs out
Nearby sold comps map
Loading sold comps map…
Walkable amenities ~0.75 mi
Loading nearby amenities…
Taxation est. · year 1
- Rental income
- $13,103
- − Mortgage interest
- −$2,017
- − Property taxes
- −$1,480
- − Insurance
- −$180
- − Repairs & maintenance
- −$1,048
- − Management
- −$1,048
- − Depreciation
- −$1,047
- Taxable income
- $6,283
- Est. tax owed @ 24.0%
- −$1,508
- After-tax cash flow
- $4,918/yr
For passive investors: Depreciation is non-cash, so a rental often shows a tax loss while cash-flowing — sheltering income. Rental losses are passive: they offset passive income freely, and up to $25,000/yr can offset ordinary (W-2) income if you actively participate and your MAGI is under $100k (phasing out to $0 by $150k); unused losses carry forward. On sale, claimed depreciation is recaptured at up to 25%, and gains may owe capital-gains tax (a 1031 exchange can defer both). Figures are a year-1 estimate at your 24.0% rate — not tax advice; consult a CPA.
Schools (NCES district)
- District
- Beaumont ISD
- NCES district ID
- 4809670
- Math proficiency
- 14% ▼ -13.00%
- Reading proficiency
- 22% ▼ -7.00%
- Median HH income
- $41,683
- Composite
- 15.43/100
- National rank
- #9316
- State rank
- #789 of 826 in TX
Livability — Beaumont
- Score
- 64/100
- State rank
- #739
- US rank
- #13710
Category grades
Schools grade is shown separately in the Schools card above.
Census & demographics
- Census place
- Beaumont, TX
- County
- Jefferson County · 203,592 people
- City population
- 125,901
- Metro
- Beaumont-Port Arthur, TX
- Population (ZIP)
- 11,004
- Household income
- $31,803
- Rent vs Own
- Severe rent burden
- 657.0
Population outlook (Jefferson County) Hauer SSP2
- Today (2025)
- 259,015 people
- By 2030
- 260,685 · +0.6%
- By 2040
- 263,309 · +1.7%
- By 2050
- 265,237 · +2.4%
- By 2075
- 270,193 · +4.3%
- By 2100
- 255,628 · -1.3%
Race, ethnicity, and origin ACS 2023
- Neighborhood character
- Majority Black (60%)
- Race & ethnicity
- Black 60% Hispanic / Latino 31% Two or more races 7% White 5%
- Hispanic origin (detail)
- Mexican 25%
- Common ancestry
- Serbian 1%
- Foreign-born
- 13% · Canada
- Languages at home
- 70% English-only · Spanish 29% French/Haitian/Cajun 1%
Political lean MEDSL · Jefferson
- 2024 margin
- Lean R (+8.9) · D 45.1% · R 54.0%
- 2008→2024 swing
- -11.1pp toward R · 2008: 2.2pp · 2024: -8.9pp
- All cycles
- 2024: R+8.9 2020: R+1.6 2016: R+0.5 2012: D+1.6 2008: D+2.2
Not yet ingested
- Civics
- —
Market trends
- HPI YoY
- ▲ 5.43%
- Current HPI
- 151.9888
- Rent YoY
- —
- Metro
- Beaumont-Port Arthur, TX
- State GDP YoY
- ▲ 3.95%
- F500 in state
- 110
Industry mix (Fortune 500 HQ in TX)
| Industry | F500 HQs | Revenue |
|---|---|---|
| Energy | 16 | $1,198B |
|
||
| Technology | 5 | $198B |
|
||
| Engineering / Construction | 4 | $72B |
|
||
| Energy Services | 3 | $60B |
|
||
| Utilities | 3 | $41B |
|
||
| Healthcare | 2 | $330B |
|
||
Price history
1 event — show timeline
- 2026-04-22 Listed $36,000 HARMLS
Property tax history
+4.9%/yrLatest (2025): $1,480 · -5.9% YoY. Source: county tax records.
Cash-flow waterfall
monthlySold comps — $/sqft
last 12 mo · ≤1 miLoading sold comps…