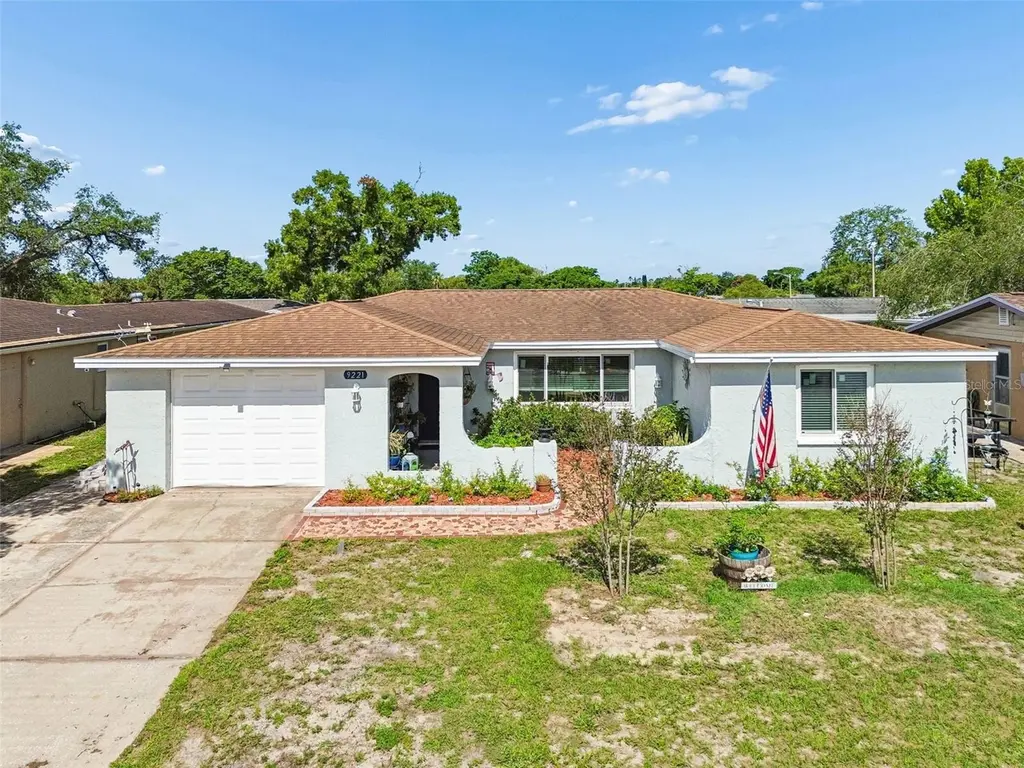
9221 Rainbow Ln · Jasmine Estates, FL
Flood risk 1/10 · Minimal
- FEMA flood zone
- X (unshaded)
- Chance of flooding over 30 yrs
- 0.0%
- Est. flood insurance / yr
- $507 – $1,088
Fire risk 1/10 · Minimal
- Est. fire insurance / yr
- $947 – $1,759
Heat risk 10/10 · Severe
- Hot days now (above 109°F)
- 7 days/yr
- Hot days in 30 yrs
- 28 days/yr
Wind risk 10/10 · Severe
- Chance of severe wind over 30 yrs
- 99.0%
Air-quality risk 2/10 · Minimal
- Unhealthy air days now
- 1 days/yr
- Unhealthy air days in 30 yrs
- 3 days/yr
Risk factors via First Street. Map © Google.
Why this score? — see what drove the D+ grade
The composite is a weighted blend of 9 inputs, each scored 0–100. Each bar is that input's sub-score; the figure is the points it added to the 100-point composite (weight × sub-score).
- ARV discount +15.0/15.0
- Cash flow +14.6/30.0
- DSCR +4.5/10.0
- Schools +4.3/10.0
- Livability +3.4/5.0
- 1% rule +2.8/10.0
- Rent growth +2.8/5.0
- Condition / age +2.5/5.0
- Appreciation +0.0/10.0
$239,900
🖨 Deal sheet (PDF) 📄 Offer letter ✓ Due diligence
Listing remarks
This charming single-level bungalow offers a wonderful blend of character and modern convenience. The exterior features a welcoming front facade with a tile walkway and a private backyard with a privacy fence and an outdoor shed for additional storage. Inside, the home boasts a formal living room and dining room, complemented by tile and hardwood flooring throughout. The kitchen is designed for functionality with bar top seating, while the sun-filled Florida room and exterior patio provide excellent spaces for relaxing or entertaining guests. HWH-2019; HVAC-2012; ROOF- 2011
Key facts
- Private backyard
- Privacy fence
- Outdoor shed
Tags
Property features AI
Finance
- Other: Zoned R3; Lot size approximately 0.12 acres; Living area about 1,487 sq ft (per public records); Building area about 2,037 sq ft (per public records); Unit is unfurnished
- HOA & community: No HOA/association; Pets allowed (cats and dogs OK)
Exterior
- Parking: Driveway, ground-level parking; Attached garage (1 car)
- Utilities: Public water; Public sewer; Electricity connected; Water connected; Sewer connected
- Home design: Single family residence; Residential property; One story; East-facing entry; Completed condition; Homestead exempt
- Construction: Block and stucco construction; Shingle roof; Slab foundation; Built as part of existing development
- Exterior features: Patio; Private mailbox; Rain gutters; Sliding doors; Shed(s); Accessible approach with ramp; Level lot; Sidewalk; Asphalt road, public maintained
Interior
- Kitchen: Dishwasher; Microwave
- Bedrooms: 2 bedrooms
- Flooring: Ceramic tile; Wood
- Bathrooms: 2 full bathrooms
- Heating & cooling: Central heating (electric); Central air conditioning
- Interior features: Ceiling fans; Kitchen/family room combo; Thermostat; Walk-in closet(s); Breakfast room (separate); Family room; Florida room
- Laundry & utility: Laundry closet
Neighborhood map
What this means for you Summary
Snapshot
- This is a 3-bed/2.0-bath single-family listed at $240k.
Deal economics
- At list price, monthly cash flow is $57 ($684/yr) — positive.
- The deal already cash-flows at list — no discount required.
- To meet the 1% rule (rent ≥ 1% of price), the offer needs to be $187k (22.1% below list).
- Recommended offer: $187k (22.1% below list) — sets the bar for 1% rule.
- Cap rate 6.6% vs local median 4.7% in Jasmine Estates — top-decile yield for the area; either an underpriced asset or a hidden risk that comps aren't pricing in. Stress-test before assuming the spread holds.
Location & tenants
- Location reads 67/100 on livability (#555 in FL) — a middle-class / working-renter tenant base. Strengths: cost of living A+, housing A+, health & safety A+; Watch: crime D+, amenities F, commute F.
- Pasco (suburban): math 50% / reading 52% proficiency, ranked #32 of 73 in FL (top 44%) — acceptable for families but not a draw, mixed tenant base, ~2y average lease.
- Zoned schools: Fox Hollow Elementary School (math 21% / reading 25%, grade F, #2,070 of 2,144 statewide, top 97%, 653 students, 88% FRL); Chasco Middle School (math 32% / reading 31%, grade F, #453 of 571 statewide, top 81%, 688 students, 84% FRL); River Ridge High School (math 50% / reading 54%, grade D+, #160 of 667 statewide, top 25%, 1,802 students, 41% FRL) — zoned schools average 71% FRL vs 48% district-wide (23 pts higher); higher-poverty schools than district average — tighter screening recommended.
- Zoned-school proficiency averages 36% at this address vs 51% district-wide (-16 pts) — the specific schools serving this property underperform the Pasco average; the district grade overstates school quality for this exact location.
- Market conditions: Rents rising (+1.3%/yr); 582 active listings in the ZIP; 40 comparable units currently listed for rent nearby; rentals at typical pace (median 22d on market — plan ~3-4 weeks tenant-placement turnaround); 6,765 units permitted in Pasco County in 2024 (1,250 in 5+ unit buildings).
- At $1,870/mo this rent would consume 47% of the median local household income ($47k/yr) (locally 2699% of renters already pay >50% of income on rent) — very limited rent-growth headroom before tenants either downsize or default.
Forward outlook
- Local home prices are declining (-3.0%/yr); year-one equity from $2k of loan paydown is wiped out by about $7k of value loss. Plan a longer hold.
- Pasco County population projected at +29% by 2050 — long-run rental-demand tailwind backs the buy-and-hold thesis.
Negotiation context
- It's been on market 18 days — a 2% lower offer ($236k) is reasonable based on typical stale-listing flexibility.
- 3 sale attempts since 8y ago with the ask held roughly flat each time — persistent listings suggest the price (not the market) is what's stuck; bring a comps-based counter.
- Current owner paid $76k; list at $240k implies a 216% gain — meaningful room to come down on a strong offer.
Risks & watch-outs
- Climate carrying-cost: severe wind risk, 99% chance of damaging wind over 30y; extreme-heat days projected 7→28/yr by 2055 (HVAC capex compounding) — expect insurance premiums to compound above CPI over the hold.
Questions for the listing agent
- Built in 1978 — when were the roof, HVAC, electrical panel, plumbing, and water heater last replaced?
- Is there a deadline driving the sale (1031 exchange, divorce, estate, relocation)? That informs how much negotiation room exists.
- Schools are F-rated, which usually means shorter tenancies and higher turnover. Who's the typical renter profile here, and what's been the actual vacancy rate?
- Crime grade is D in this area — have there been break-ins, vandalism, or insurance claims at this property in the last 3 years? What carrier currently insures it and at what premium?
- The area grade is low — what's the realistic commute time and amenity access for the typical tenant pool here? Any planned neighborhood developments (good or bad) we should know about?
- What's the average days-on-market for RENTAL listings here right now (not sales)? A rising rental-DOM trend means longer vacancies and softer asking-rent achievability than the comps imply.
- What's the recent tenant-quality profile in this submarket — average credit score on applications, eviction rate, late-payment / NSF rate, and stable-employment percentage? A property-management company in the area should have these aggregated.
- How much new for-sale + rental construction is in the pipeline within 1–3 miles? Heavy new supply typically softens prices + rents 12–24 months out; constrained supply supports both.
Investment metrics
- 1% rule
- 0.78% ✗
- Cap rate
- 6.58%
- Cash-on-cash
- 1.02%
- DSCR
- 1.05
- GRM
- 10.7
CMA / ARV
- ARV (on-the-fly)
- $291,452
- Comps found
- 12
Show comp detail 12 sales within ~0.75 mi
| Address | Dist | Beds/Ba | Sqft | Sold | Price | $/sf | Match |
|---|---|---|---|---|---|---|---|
| 9310 Mark Twain Ln | 0.07mi | 3/2.0 | 1,487 (0%) | 2mo | $235,000 | $158 | 95 |
| 9401 Glen Moor Ln | 0.50mi | 3/1.5 | 1,472 (-1%) | 2mo | $180,000 | $122 | 71 |
| 7410 Mayfield Dr | 0.61mi | 3/2.0 | 1,545 (+4%) | 1mo | $303,000 | $196 | 64 |
| 7311 San Moritz Dr | 0.62mi | 2/2.0 (-1) | 1,467 (-1%) | 1mo | $290,000 | $198 | 63 |
| 9641 Morehead Ln | 0.57mi | 3/2.0 | 1,413 (-5%) | 2mo | $307,000 | $217 | 63 |
| 7823 Radcliffe Cir | 0.66mi | 2/2.0 (-1) | 1,446 (-3%) | 0mo | $150,000 | $104 | 59 |
| 9313 Wolcott Ln | 0.35mi | 3/2.0 | 1,268 (-15%) | 2mo | $320,000 | $252 | 58 |
| 8201 Sudbury Dr | 0.53mi | 2/2.0 (-1) | 1,365 (-8%) | 2mo | $279,000 | $204 | 55 |
| 8326 Luray Dr | 0.64mi | 3/2.0 | 1,365 (-8%) | 2mo | $295,000 | $216 | 55 |
| 7206 San Moritz Dr | 0.73mi | 3/2.5 | 1,578 (+6%) | 2mo | $250,000 | $158 | 52 |
| 9135 Farmington Ln | 0.55mi | 2/2.0 (-1) | 1,659 (+12%) | 1mo | $280,000 | $169 | 49 |
| 8641 Shadblow Ct #2 | 0.60mi | 2/2.0 (-1) | 1,270 (-15%) | 0mo | $134,900 | $106 | 42 |
Match score weights: distance 35% · size 25% · config 20% · recency 20%. Top-matched comps best support the ARV.
Projected returns pro-forma
-3.0% appreciation · 1.28% rent growth · sell at horizon
- IRR
- -16.4%
- Equity multiple
- 0.43×
- Total profit
- $-38,543
- Equity at exit
- $35,770
- IRR
- -11.1%
- Equity multiple
- 0.38×
- Total profit
- $-41,979
- Equity at exit
- $20,742
Cash invested: $67,172 (down + closing). Projections, not guarantees.
Landlord ↔ Tenant lean methodology
- Overall (STATE)
- 87 Strongly Landlord-Friendly
- State Florida
- 87 Strongly Landlord-Friendly · R+3
- County
- — inherits STATE
- City
- — inherits STATE
ZIP-level market 34668
- Home prices YoY
- -17.4%
- Rents YoY
- 1.3%
- Active inventory
- 582
- Price-to-rent
- 10.7×
Monthly cashflow live
- Estimated rent
- $1,870 high interval (Pro) →
- Mortgage (P&I)
- −$1,258
- Tax from tax record
- −$62 /mo · $746/yr
- Insurance
- −$100
- HOA
- −$0
- Vacancy / Maint / Mgmt
- −$393
- Net cashflow
- $57
Break-even live
Sensitivity live
| Price | -10% $193 | -5% $125 | +0% $57 | +5% $-11 | +10% $-79 |
|---|---|---|---|---|---|
| Rent | -10% $-91 | -5% $-17 | +0% $57 | +5% $131 | +10% $205 |
| Rate | -1.0pp $178 | -0.5pp $118 | base $57 | +0.5pp $-5 | +1.0pp $-68 |
UW: 25.0% down · 7.5% · 30yr · 1.5% tax · 5.0% vac · 8.0% maint · 8.0% mgmt
Financing live
Cash to close
- Down payment
- $59,975
- Closing costs
- $7,197
- Reserves months
- —
- Total cash needed
- —
Loan-product check · same deal, 3 products live
Conventional
25% down · 7.5% · 30yr
- Down + closing
- —
- Monthly P&I
- —
- Monthly cashflow
- —
- DSCR
- —
- Eligible?
- —
Personal DTI + credit; lowest rate.
DSCR
20% down · 8.5% · 30yr
- Down + closing
- —
- Monthly P&I
- —
- Monthly cashflow
- —
- DSCR
- —
- Eligible?
- —
No personal income docs; deal must DSCR.
Hard money
10% down · 12.0% · 12mo
- Down + closing
- —
- Monthly P&I
- —
- Monthly cashflow
- —
- DSCR
- —
- Eligible?
- —
Short-term bridge; refi at stabilization.
Rent comps 40 comps
| Address | Beds | Baths | Sqft | Rent | $/sqft | DOM | Units | Dist |
|---|---|---|---|---|---|---|---|---|
| 8026 Colrain Dr Port Richey, FL | 3.0 | 1.0 | 1080 | $1,545 | $1.43 | 26d | 1 | 0.16mi |
| 9100 Hunt Club Ln Port Richey, FL | 2.0 | 2.0 | 1365 | $1,850 | $1.36 | 23d | 1 | 0.18mi |
| 9105 Hermitage Ln Port Richey, FL | 3.0 | 2.0 | 1442 | $1,900 | $1.32 | 26d | 1 | 0.23mi |
| 9300 Whitman Ln Port Richey, FL | 3.0 | 1.0 | 920 | $1,695 | $1.84 | 26d | 1 | 0.25mi |
| 9310 Whitman Ln Port Richey, FL | 3.0 | 1.0 | 980 | $1,350 | $1.38 | 13d | 1 | 0.26mi |
| 7605 Embassy Blvd Unit 1 Port Richey, FL | 3.0 | 2.0 | 1469 | $2,350 | $1.60 | 26d | 1 | 0.31mi |
| 7605 Embassy Blvd Port Richey, FL | 3.0 | 2.0 | 1278 | $2,350 | $1.84 | 14d | 1 | 0.31mi |
| 9202 Suffolk Ln Port Richey, FL | 2.0 | 2.0 | 1038 | $1,450 | $1.40 | 26d | 1 | 0.35mi |
| 9202 Suffolk Ln Port Richey, FL | 2.0 | 2.0 | 1038 | $1,450 | $1.40 | 16d | 1 | 0.35mi |
| 8910 Elm Leaf Ct Port Richey, FL | 2.0 | 2.0 | 1248 | $1,650 | $1.32 | 6d | 1 | 0.35mi |
| 9141 Suffolk Ln Port Richey, FL | 3.0 | 2.0 | 1512 | $1,775 | $1.17 | 0d | 1 | 0.37mi |
| 9130 Chatam Ln Port Richey, FL | 2.0 | 2.0 | 1212 | $1,623 | $1.34 | 23d | 1 | 0.39mi |
| 9211 Chatam Ln Port Richey, FL | 3.0 | 2.0 | 1176 | $2,215 | $1.88 | 22d | 1 | 0.41mi |
| 7501 San Moritz Dr Port Richey, FL | 3.0 | 2.0 | 1412 | $1,600 | $1.13 | 26d | 1 | 0.44mi |
| 8151 Hixton Dr Port Richey, FL | 3.0 | 1.0 | 1080 | $1,699 | $1.57 | 18d | 1 | 0.45mi |
| 8247 Saybrook Dr Port Richey, FL | 3.0 | 1.0 | 980 | $1,550 | $1.58 | 25d | 1 | 0.46mi |
| 7435 San Miguel Dr Port Richey, FL | 2.0 | 2.0 | 1136 | $1,500 | $1.32 | 22d | 1 | 0.49mi |
| 7815 Treasure Pointe Dr Port Richey, FL | 3.0 | 2.0 | 1682 | $2,024 | $1.20 | 22d | 1 | 0.53mi |
| 7318 Vienna Ln Port Richey, FL | 2.0 | 2.0 | 1530 | $1,841 | $1.20 | 21d | 1 | 0.57mi |
| 9820 Rainbow Ln Port Richey, FL | 2.0 | 1.0 | 1300 | $1,325 | $1.02 | 16d | 1 | 0.63mi |
| 7741 Forest Trl #3 Port Richey, FL | 2.0 | 2.0 | 1010 | $1,500 | $1.49 | 26d | 1 | 0.63mi |
| 7301 Moravian Dr Port Richey, FL | 3.0 | 2.0 | 1325 | $1,806 | $1.36 | 6d | 1 | 0.69mi |
| 7325 Ivanhoe Dr Port Richey, FL | 3.0 | 1.0 | 984 | $1,800 | $1.83 | 12d | 1 | 0.72mi |
| 9808 Glen Moor Ln Port Richey, FL | 3.0 | 2.0 | 1550 | $1,975 | $1.27 | 1d | 1 | 0.74mi |
| 7205 Moravian Dr Port Richey, FL | 3.0 | 2.0 | 1518 | $1,845 | $1.22 | 21d | 1 | 0.76mi |
| 9845 Lake Chrise Ln Port Richey, FL | 3.0 | 2.0 | 1622 | $1,961 | $1.21 | 26d | 1 | 0.76mi |
| 8437 Luray Dr Port Richey, FL | 2.0 | 1.0 | 1038 | $1,595 | $1.54 | 6d | 1 | 0.76mi |
| 9136 Lometa Ln Port Richey, FL | 3.0 | 2.0 | 1574 | $1,795 | $1.14 | 19d | 1 | 0.80mi |
| 8019 Portage Dr Port Richey, FL | 2.0 | 2.0 | 1078 | $2,000 | $1.86 | 18d | 1 | 0.83mi |
| 7224 Potomac Dr Port Richey, FL | 3.0 | 2.0 | 1208 | $1,595 | $1.32 | 26d | 1 | 0.84mi |
| 7034 Coral Reef Dr Port Richey, FL | 3.0 | 2.0 | 1325 | $1,795 | $1.35 | 26d | 1 | 0.84mi |
| 7210 Parrot Dr Port Richey, FL | 4.0 | 2.0 | 1772 | $2,700 | $1.52 | 1d | 1 | 0.89mi |
| 7125 Sandalwood Dr Port Richey, FL | 2.0 | 2.0 | 1324 | $1,681 | $1.27 | 6d | 1 | 0.92mi |
| 7015 Ingleside Dr Port Richey, FL | 3.0 | 2.0 | 1243 | $2,045 | $1.65 | 0d | 1 | 0.95mi |
| 6935 Twilite Dr Port Richey, FL | 2.0 | 1.0 | 1032 | $1,450 | $1.41 | 18d | 1 | 0.97mi |
| 8228 Chasco Woods Blvd Port Richey, FL | 1.0–3.0 | 1.0–2.0 | 966 | $1,760 | $1.82 | 0d | 22 | 1.00mi |
| 9304 Saint Regis Ln Port Richey, FL | 2.0 | 2.0 | 1356 | $1,550 | $1.14 | 23d | 1 | 1.01mi |
| 10225 Gardenia Ln Port Richey, FL | 3.0 | 1.0 | 1042 | $1,495 | $1.43 | 16d | 1 | 1.04mi |
| 9425 Saint Regis Ln Port Richey, FL | 2.0 | 2.0 | 1380 | $1,700 | $1.23 | 26d | 1 | 1.06mi |
| 7040 Brentwood Dr Unit NA Port Richey, FL | 2.0 | 1.0 | 880 | $1,600 | $1.82 | 22d | 1 | 1.07mi |
Listing history 11 events
-
2026-06-22pricedays on market $239,900 Active 18 DOM
-
2026-06-18days on market $244,900 Active 15 DOM
-
2026-06-17days on market $244,900 Active 14 DOM
-
2026-06-16days on market $244,900 Active 13 DOM
-
2026-06-15days on market $244,900 Active 12 DOM
-
2026-06-13days on market $244,900 Active 10 DOM
-
2026-06-09days on market $244,900 Active 6 DOM
-
2026-06-08days on market $244,900 Active 5 DOM
-
2026-06-07days on market $244,900 Active 4 DOM
-
2026-06-04remarks 580-char remark
-
2026-06-04$244,900 Active 1 DOM
ⓘ Source: listings_history table (triggers on properties + properties_extension) + one-shot
backfill from property_details.listing_events for pre-trigger history.
Tax reassessment forecast FL · Resets to sale price
- Current annual tax
- $746 · $62/mo
- Projected year-2 tax
- $1,991 · $166/mo
- Expected delta
- +$1,245/yr (+$104/mo · 166.8%)
ⓘ Screening estimate from a state-policy table — verify with the county assessor before closing.
Climate risk First Street
- Flood 1/10 Low FEMA zone X (unshaded) · 0% chance over 30 yrs
- Wildfire 1/10 Low
- Heat 10/10 Extreme 7 d/yr ≥109°F today · 28 d/yr by 30 yrs out
- Wind 10/10 Extreme 99% chance of damaging wind over 30 yrs
- Air quality 2/10 Low 1 unhealthy d/yr today · 3 by 30 yrs out
Nearby sold comps map
Loading sold comps map…
Walkable amenities ~0.75 mi
Loading nearby amenities…
Taxation est. · year 1
- Rental income
- $22,439
- − Mortgage interest
- −$13,438
- − Property taxes
- −$746
- − Insurance
- −$1,200
- − Repairs & maintenance
- −$1,795
- − Management
- −$1,795
- − Depreciation
- −$6,979
- Taxable loss
- −$3,514
- Est. tax savings @ 24.0%
- +$843
- After-tax cash flow
- $1,527/yr
For passive investors: Depreciation is non-cash, so a rental often shows a tax loss while cash-flowing — sheltering income. Rental losses are passive: they offset passive income freely, and up to $25,000/yr can offset ordinary (W-2) income if you actively participate and your MAGI is under $100k (phasing out to $0 by $150k); unused losses carry forward. On sale, claimed depreciation is recaptured at up to 25%, and gains may owe capital-gains tax (a 1031 exchange can defer both). Figures are a year-1 estimate at your 24.0% rate — not tax advice; consult a CPA.
Schools (NCES district)
- District
- Pasco
- NCES district ID
- 1201530
- Math proficiency
- 50% ▼ -10.00%
- Reading proficiency
- 52% ▼ -5.00%
- Median HH income
- $45,039
- Composite
- 43.14/100
- National rank
- #3074
- State rank
- #32 of 73 in FL
Livability — Jasmine Estates
- Score
- 67/100
- State rank
- #555
- US rank
- #10561
Category grades
Schools grade is shown separately in the Schools card above.
Census & demographics
- Census place
- Jasmine Estates, FL
- County
- Pasco County · 524,098 people
- Metro
- Tampa-St. Petersburg-Clearwater, FL
- Population (ZIP)
- 49,442
- Household income
- $47,401
- Rent vs Own
- Severe rent burden
- 2699.0
Population outlook (Pasco County) Hauer SSP2
- Today (2025)
- 570,045 people
- By 2030
- 605,844 · +6.3%
- By 2040
- 674,806 · +18.4%
- By 2050
- 736,022 · +29.1%
- By 2075
- 862,900 · +51.4%
- By 2100
- 906,364 · +59.0%
Race, ethnicity, and origin ACS 2023
- Neighborhood character
- Predominantly White (70%)
- Race & ethnicity
- White 70% Hispanic / Latino 23% Two or more races 14% Black 4%
- Hispanic origin (detail)
- Mexican 3% Puerto Rican 10% Cuban 5% Dominican 1%
- Common ancestry
- Romanian 3% Lithuanian 3% Slovak 2%
- Foreign-born
- 11% · Canada, Jamaica
- Languages at home
- 82% English-only · Spanish 14% Other Indo-European 1% French/Haitian/Cajun 1%
Political lean MEDSL · Pasco
- 2024 margin
- Strong R (+25.2) · D 36.9% · R 62.1% · Other 1.0%
- 2008→2024 swing
- -21.6pp toward R · 2008: -3.6pp · 2024: -25.2pp
- All cycles
- 2024: R+25.2 2020: R+20.1 2016: R+21.6 2012: R+6.7 2008: R+3.6
Not yet ingested
- Civics
- —
Market trends
- HPI YoY
- ▼ -75.64%
- Current HPI
- 359.7163
- Rent YoY
- ▲ 1.28%
- Metro
- Tampa-St. Petersburg-Clearwater, FL
- State GDP YoY
- ▲ 3.28%
- F500 in state
- 36
Industry mix (Fortune 500 HQ in FL)
| Industry | F500 HQs | Revenue |
|---|---|---|
| Industrial Technology | 2 | $29B |
|
||
| Insurance | 2 | $17B |
|
||
| Retail | 1 | $60B |
|
||
| Technology Distribution | 1 | $58B |
|
||
| Homebuilding | 1 | $35B |
|
||
| Technology Manufacturing | 1 | $35B |
|
||
Price history
+222.7% since first listed9 events — show timeline
- 2026-06-03 Listed $244,900 Stellar MLS as Distributed by MLS Grid
- 2019-01-27 Listing Removed — Stellar MLS as Distributed by MLS Grid
- 2018-11-09 Relisted — Stellar MLS as Distributed by MLS Grid
- 2018-11-01 Listing Removed — Stellar MLS as Distributed by MLS Grid
- 2018-10-10 Price Changed $125,000 Stellar MLS as Distributed by MLS Grid
- 2018-08-07 Price Changed $130,000 Stellar MLS as Distributed by MLS Grid
- 2018-07-19 Price Changed $139,000 Stellar MLS as Distributed by MLS Grid
- 2018-07-02 Listed $142,000 Stellar MLS as Distributed by MLS Grid
- 2002-09-05 Sold (Public Records) $75,900 Public Records
Property tax history
+2.9%/yrLatest (2025): $746 · +2.0% YoY. Source: county tax records.
Cash-flow waterfall
monthlySold comps — $/sqft
last 12 mo · ≤1 miLoading sold comps…