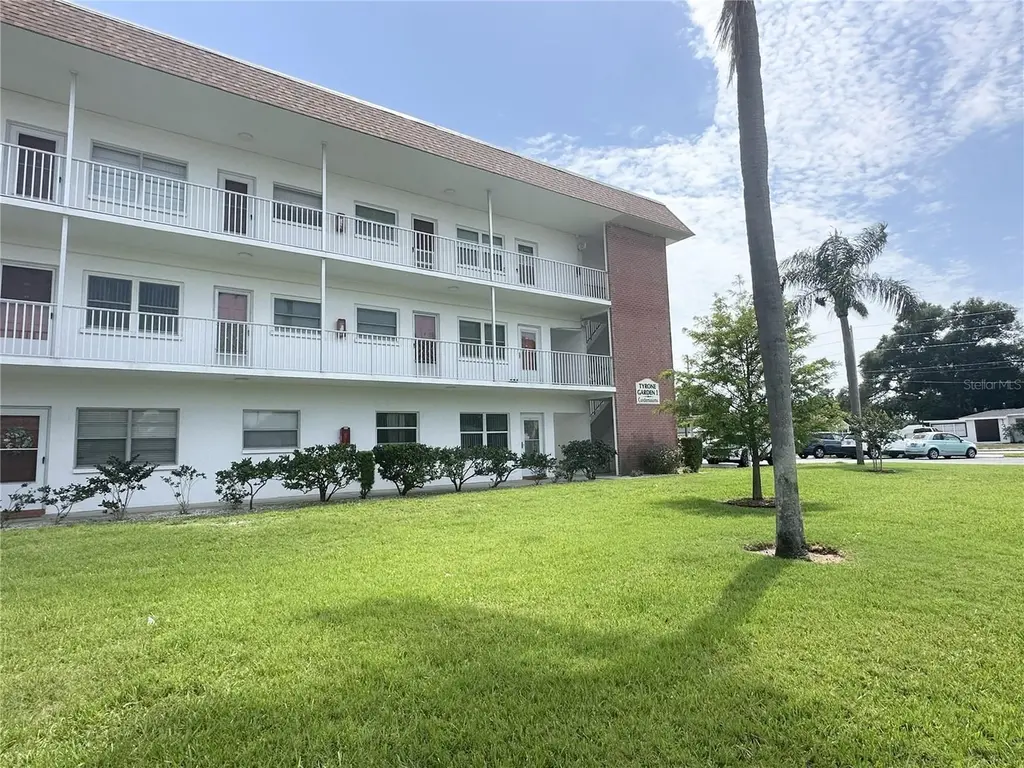
5728 14th Ave N Unit 206B · St. Petersburg, FL
Flood risk 1/10 · Minimal
- FEMA flood zone
- X (unshaded)
- Chance of flooding over 30 yrs
- 0.0%
- Est. flood insurance / yr
- $507 – $1,088
Fire risk 1/10 · Minimal
- Est. fire insurance / yr
- $947 – $1,759
Heat risk 10/10 · Severe
- Hot days now (above 106°F)
- 7 days/yr
- Hot days in 30 yrs
- 27 days/yr
Wind risk 10/10 · Severe
- Chance of severe wind over 30 yrs
- 99.0%
Air-quality risk 4/10 · Minor
- Unhealthy air days now
- 4 days/yr
- Unhealthy air days in 30 yrs
- 4 days/yr
Risk factors via First Street. Map © Google.
Why this score? — see what drove the C grade
The composite is a weighted blend of 9 inputs, each scored 0–100. Each bar is that input's sub-score; the figure is the points it added to the 100-point composite (weight × sub-score).
- Cash flow +21.8/30.0
- 1% rule +10.0/10.0
- ARV discount +7.5/15.0
- DSCR +7.0/10.0
- Schools +4.3/10.0
- Livability +2.5/5.0
- Condition / age +2.5/5.0
- Rent growth +2.4/5.0
- Appreciation +0.0/10.0
$120,000
🖨 Deal sheet 📄 Offer letter ✓ Due diligence
Listing remarks
Welcome to this charming 2-bedroom, 2-bathroom condo nestled in an established, quiet Saint Petersburg neighborhood. This all-ages community offers a rare assigned covered parking space and beautifully manicured grounds filled with lush greenery. Inside, you'll find white kitchen cabinets and an easy-to-clean kitchen tile floor. The home also features a built-in desk with drawers, ideal for a home office, and a bonus room that can be customized as a family room, office, or guest space. Convenience is key with in-unit laundry (stackable washer and dryer), insulated windows, and extra private storage. The layout is perfect for roommates, with the second bedroom having its own exterior door. E
Key facts
- Bonus room
- In-unit laundry
- Insulated windows
Tags
Property features AI
Finance
- Other: Homestead exempt; Association contact listed
- Financial info: Land lease fee $165; Total annual fees $6,744; Total monthly fees $562
- HOA & community: Monthly condo fee of $562 (includes cable TV, insurance, internet, structure maintenance, grounds maintenance, sewer, trash, water); Community sidewalks; Pets allowed (maximum 20 lbs)
Exterior
- Parking: Covered parking; 1-car carport
- Utilities: Public water; Public sewer; Public utilities
- Home design: Residential condominium; One story; Faces north; Second-floor unit
- Construction: Block construction; Built-up roof; Slab foundation; Built in 5728 (building number noted)
- Exterior features: Sidewalk
Interior
- Kitchen: Dishwasher; Microwave; Range; Refrigerator; Electric water heater
- Bedrooms: 2 bedrooms
- Flooring: Carpet; Ceramic tile; Laminate
- Bathrooms: 2 full bathrooms
- Heating & cooling: Central heating; Central air conditioning
- Interior features: Ceiling fans; Eat-in kitchen; Living room/dining room combo; Open floorplan; Double pane windows; Building elevator
- Laundry & utility: Washer; Dryer; Inside laundry in a laundry closet
Neighborhood map
What this means for you Summary
Snapshot
- This is a 2-bed/2.0-bath condo listed at $120k.
Deal economics
- At list price, monthly cash flow is $186 ($2k/yr) — positive.
- The deal already cash-flows at list — no discount required.
- Meets the 1% rule at list price ($2k rent vs $120k).
- Recommended offer: $116k (3.0% below list) — sets the bar for market timing.
- Cap rate 8.2% vs local median 2.6% in St. Petersburg — top-decile yield for the area; either an underpriced asset or a hidden risk that comps aren't pricing in. Stress-test before assuming the spread holds.
Location & tenants
- Location reads: area grade C — affects rentability + tenant quality, not the cash-flow math above.
- Pinellas (suburban): math 51% / reading 51% proficiency, ranked #31 of 73 in FL (top 42%) — acceptable for families but not a draw, mixed tenant base, ~2y average lease.
- Zoned schools: Northwest Elementary School (math 56% / reading 50%, grade C, #963 of 2,144 statewide, top 45%, 477 students, 63% FRL); St. Petersburg High School (math 31% / reading 61%, grade D-, #220 of 667 statewide, top 33%, 1,723 students, 39% FRL) — zoned schools at 51% FRL track the district average.
- Market conditions: Rents soft (-0.5%/yr); 313 active listings in the ZIP; 40 comparable units currently listed for rent nearby; rentals leasing fast (median 5d on market — plan ~1-2 weeks tenant-placement turnaround); solid renter incomes; 2,676 units permitted in Pinellas County in 2024 (1,422 in 5+ unit buildings).
- This rent runs 30% of the median local income ($79k/yr) — at the standard rent-burdened threshold; future hikes will face affordability resistance.
Forward outlook
- Local home prices are declining (-3.0%/yr); year-one equity from $830 of loan paydown is wiped out by about $4k of value loss. Plan a longer hold.
- Pinellas County population projected at +14% by 2050 — modest demand growth; plan on rents tracking national, not racing it.
Negotiation context
- It's been on market 37 days — a 3% lower offer ($116k) is reasonable based on typical stale-listing flexibility.
- Current owner paid $60k; list at $120k implies a 100% gain — meaningful room to come down on a strong offer.
Risks & watch-outs
- Watch-outs: HOA is 28% of rent.
- Climate carrying-cost: severe wind risk, 99% chance of damaging wind over 30y; extreme-heat days projected 7→27/yr by 2055 (HVAC capex compounding) — expect insurance premiums to compound above CPI over the hold.
Questions for the listing agent
- It's been on market 37 days. Have you received any prior offers? Is the seller open to a 3% concession, seller financing, or rate buy-down credit?
- Built in 1969 — when were the roof, HVAC, electrical panel, plumbing, and water heater last replaced?
- What does the HOA fee cover, when was the last increase, and are there any pending special assessments or reserve-fund shortfalls?
- Any open or pending special assessments — roof, HVAC, plumbing, elevator, façade? What's the per-unit balance and payoff schedule, and is the seller paying it off at close or rolling it to the buyer?
- Is there a deadline driving the sale (1031 exchange, divorce, estate, relocation)? That informs how much negotiation room exists.
- What's the average days-on-market for RENTAL listings here right now (not sales)? A rising rental-DOM trend means longer vacancies and softer asking-rent achievability than the comps imply.
- What's the recent tenant-quality profile in this submarket — average credit score on applications, eviction rate, late-payment / NSF rate, and stable-employment percentage? A property-management company in the area should have these aggregated.
- How much new apartment / multifamily construction is in the pipeline within 1–3 miles? Heavy new supply (>2% of stock underway) typically softens rents 12–24 months out; light construction supports rent growth.
Investment metrics
- 1% rule
- 1.66% ✓
- Cap rate
- 8.15%
- Cash-on-cash
- 6.64%
- DSCR
- 1.30
- GRM
- 5.0
CMA / ARV
No comps found within radius.
Projected returns pro-forma
-3.0% appreciation · 0.0% rent growth · sell at horizon
- IRR
- -11.2%
- Equity multiple
- 0.61×
- Total profit
- $-13,076
- Equity at exit
- $17,892
- IRR
- -10.8%
- Equity multiple
- 0.49×
- Total profit
- $-17,222
- Equity at exit
- $10,375
Cash invested: $33,600 (down + closing). Projections, not guarantees.
Landlord ↔ Tenant lean methodology
- Overall (STATE)
- 87 Strongly Landlord-Friendly
- State Florida
- 87 Strongly Landlord-Friendly · R+3
- County
- — inherits STATE
- City
- — inherits STATE
ZIP-level market 33710
- Rents YoY
- -0.5%
- Active inventory
- 313
- Price-to-rent
- 5.0×
Monthly cashflow live
- Estimated rent
- $1,997 high interval (Pro) →
- Mortgage (P&I)
- −$629
- Tax est. 1.5%
- −$150 /mo · $1,800/yr
- Insurance
- −$50
- HOA
- −$562
- Vacancy / Maint / Mgmt
- −$419
- Net cashflow
- $186
Break-even live
UW: 25.0% down · 7.5% · 30yr · 1.5% tax · 5.0% vac · 8.0% maint · 8.0% mgmt
Financing live
Cash to close
- Down payment
- $30,000
- Closing costs
- $3,600
- Reserves months
- —
- Total cash needed
- —
Loan-product check · same deal, 3 products live
Conventional
25% down · 7.5% · 30yr
- Down + closing
- —
- Monthly P&I
- —
- Monthly cashflow
- —
- DSCR
- —
- Eligible?
- —
Personal DTI + credit; lowest rate.
DSCR
20% down · 8.5% · 30yr
- Down + closing
- —
- Monthly P&I
- —
- Monthly cashflow
- —
- DSCR
- —
- Eligible?
- —
No personal income docs; deal must DSCR.
Hard money
10% down · 12.0% · 12mo
- Down + closing
- —
- Monthly P&I
- —
- Monthly cashflow
- —
- DSCR
- —
- Eligible?
- —
Short-term bridge; refi at stabilization.
Rent comps 40 comps
| Address | Beds | Baths | Sqft | Rent | $/sqft | DOM | Units | Dist |
|---|---|---|---|---|---|---|---|---|
| 1108 Winchester Rd N St Petersburg, FL | 3.0 | 1.0 | 1011 | $1,800 | $1.78 | 20d | 1 | 0.39mi |
| 5330 11th Ave N Saint Petersburg, FL | 2.0 | 1.0 | 756 | $1,800 | $2.38 | 4d | 1 | 0.41mi |
| 5860 22nd Ave N Apt 5 St. Petersburg, FL | 2.0 | 1.0 | 800 | $1,300 | $1.62 | 24d | 1 | 0.44mi |
| 5900 22nd Ave N Unit 1 St. Petersburg, FL | 3.0 | 2.0 | 1100 | $1,999 | $1.82 | 18d | 1 | 0.45mi |
| 5701 21st Ave N Saint Petersburg, FL | 1.0–2.0 | 1.0 | 775 | $1,899 | $2.45 | 8d | 3 | 0.45mi |
| 5900 22nd Ave N Unit 14 St. Petersburg, FL | 2.0 | 1.0 | 1000 | $1,650 | $1.65 | 14d | 1 | 0.45mi |
| 5900 22nd Ave N Saint Petersburg, FL | 3.0 | 1.0 | 1100 | $1,950 | $1.77 | 4d | 1 | 0.45mi |
| 5318 9th Ave N Saint Petersburg, FL | 3.0 | 2.0 | 1142 | $2,600 | $2.28 | 4d | 1 | 0.48mi |
| 2176 Winchester Rd N #2 Saint Petersburg, FL | 3.0 | 2.0 | 1080 | $2,250 | $2.08 | 15d | 1 | 0.48mi |
| 6080 22nd Ave N #3 Saint Petersburg, FL | 2.0 | 2.0 | 890 | $1,825 | $2.05 | 24d | 1 | 0.55mi |
| 6080 22nd Ave N #3 Saint Petersburg, FL | 2.0 | 2.0 | 900 | $1,825 | $2.03 | 4d | 1 | 0.55mi |
| 6080 22nd Ave N #5 Saint Petersburg, FL | 2.0 | 2.0 | 890 | $1,725 | $1.94 | 24d | 1 | 0.55mi |
| 5521 5th Ave N Saint Petersburg, FL | 2.0 | 1.0 | 952 | $1,750 | $1.84 | 4d | 1 | 0.56mi |
| 441 57th St N Saint Petersburg, FL | 2.0 | 1.0 | 1160 | $1,950 | $1.68 | 3d | 1 | 0.58mi |
| 430 55th St N Saint Petersburg, FL | 2.0 | 1.5 | 735 | $1,850 | $2.52 | 8d | 1 | 0.65mi |
| 5919 4th Ave N Saint Petersburg, FL | 2.0 | 1.0 | 1053 | $2,650 | $2.52 | 4d | 1 | 0.66mi |
| 4942 Oxford Ave N Saint Petersburg, FL | 2.0 | 1.0 | 776 | $1,700 | $2.19 | 24d | 1 | 0.68mi |
| 5545 3rd Ave N Saint Petersburg, FL | 2.0 | 1.0 | 962 | $2,400 | $2.49 | 4d | 1 | 0.73mi |
| 630 50th St N Saint Petersburg, FL | 2.0 | 1.0 | 1085 | $2,070 | $1.91 | 24d | 1 | 0.78mi |
| 6366 Hampton Dr N Saint Petersburg, FL | 3.0 | 1.0 | 924 | $1,995 | $2.16 | 4d | 1 | 0.82mi |
| 5428 Burlington Ave N Saint Petersburg, FL | 2.0 | 1.0 | 726 | $2,150 | $2.96 | 24d | 1 | 0.85mi |
| 5762 2nd Ave N Saint Petersburg, FL | 2.0 | 1.0 | 843 | $2,000 | $2.37 | 4d | 1 | 0.86mi |
| 2819 53rd St N Saint Petersburg, FL | 2.0 | 1.0 | 900 | $1,995 | $2.22 | 4d | 1 | 0.92mi |
| 1101 46th St N Saint Petersburg, FL | 2.0 | 1.0 | 1300 | $2,300 | $1.77 | 4d | 1 | 1.01mi |
| 4594 10th Ave N Saint Petersburg, FL | 3.0 | 2.0 | 1432 | $3,100 | $2.16 | 24d | 1 | 1.03mi |
| 5050 2nd Ave N Saint Petersburg, FL | 2.0 | 1.0 | 816 | $1,495 | $1.83 | 4d | 1 | 1.06mi |
| 4526 6th Ave N Saint Petersburg, FL | 2.0 | 1.0 | 888 | $1,950 | $2.20 | 4d | 1 | 1.18mi |
| 5034 2nd Ave S Unit A St. Petersburg, FL | 2.0 | 1.0 | 1062 | $1,950 | $1.84 | 4d | 1 | 1.27mi |
| 5055 3rd Ave S Saint Petersburg, FL | 3.0 | 2.0 | 1254 | $2,100 | $1.67 | 4d | 1 | 1.28mi |
| 1699 68th St N Saint Petersburg, FL | 3.0 | 1.0–2.0 | 775 | $1,975 | $2.55 | 2d | 43 | 1.30mi |
| 1803 42nd Way N Saint Petersburg, FL | 2.0 | 2.0 | 1421 | $4,200 | $2.96 | 24d | 1 | 1.33mi |
| 4148 11th Ave N Saint Petersburg, FL | 2.0 | 1.0 | 806 | $2,000 | $2.48 | 24d | 1 | 1.36mi |
| 4136 13th Ave N Saint Petersburg, FL | 3.0 | 2.0 | 1154 | $2,600 | $2.25 | 11d | 1 | 1.37mi |
| 6221 5th Ave S Saint Petersburg, FL | 3.0 | 2.0 | 924 | $2,050 | $2.22 | 4d | 1 | 1.37mi |
| 6190 36th Ave N Saint Petersburg, FL | 2.0 | 1.0 | 1008 | $2,500 | $2.48 | 4d | 1 | 1.38mi |
| 4218 24th Ave N Saint Petersburg, FL | 2.0 | 1.0 | 1121 | $1,925 | $1.72 | 4d | 1 | 1.38mi |
| 4227 5th Ave N Saint Petersburg, FL | 2.0 | 1.0 | 930 | $2,100 | $2.26 | 4d | 1 | 1.39mi |
| 5156 5th Ave S Saint Petersburg, FL | 3.0 | 1.0 | 1139 | $1,995 | $1.75 | 24d | 1 | 1.40mi |
| 2871 67th St N Saint Petersburg, FL | 3.0 | 1.0 | 1075 | $2,500 | $2.33 | 24d | 1 | 1.41mi |
| 6810 Stones Throw Cir N #13203 Saint Petersburg, FL | 2.0 | 2.0 | 905 | $2,100 | $2.32 | 4d | 1 | 1.42mi |
HOA detail condo
- Monthly dues
- $562 · $6,744/yr
- Likely covers
- landscaping
- Assessments
- None detected in remarks — confirm with the listing agent.
Listing history 17 events
-
2026-06-18days on market $120,000 Active 37 DOM
-
2026-06-17days on market $120,000 Active 36 DOM
-
2026-06-16days on market $120,000 Active 35 DOM
-
2026-06-15days on market $120,000 Active 34 DOM
-
2026-06-13days on market $120,000 Active 32 DOM
-
2026-06-09days on market $120,000 Active 28 DOM
-
2026-06-08days on market $120,000 Active 27 DOM
-
2026-06-07days on market $120,000 Active 26 DOM
-
2026-06-04days on market $120,000 Active 23 DOM
-
2026-06-03days on market $120,000 Active 22 DOM
-
2026-06-01days on market $120,000 Active 20 DOM
-
2026-05-31days on market $120,000 Active 19 DOM
-
2026-05-12$120,000 Active
-
2004-06-04soldstatus $60,000
-
1987-08-26soldstatus $40,500
-
1984-11-01soldstatus $38,000
-
1981-07-01soldstatus $37,000
ⓘ Source: listings_history table (triggers on properties + properties_extension) + one-shot
backfill from property_details.listing_events for pre-trigger history.
Climate risk First Street
- Flood 1/10 Low FEMA zone X (unshaded) · 0% chance over 30 yrs
- Wildfire 1/10 Low
- Heat 10/10 Extreme 7 d/yr ≥106°F today · 27 d/yr by 30 yrs out
- Wind 10/10 Extreme 99% chance of damaging wind over 30 yrs
- Air quality 4/10 Moderate 4 unhealthy d/yr today · 4 by 30 yrs out
Nearby sold comps map
Loading sold comps map…
Walkable amenities ~0.75 mi
Loading nearby amenities…
Taxation est. · year 1
- Rental income
- $23,958
- − Mortgage interest
- −$6,722
- − Property taxes
- −$1,800
- − Insurance
- −$600
- − Repairs & maintenance
- −$1,917
- − Management
- −$1,917
- − HOA
- −$6,744
- − Depreciation
- −$3,491
- Taxable income
- $768
- Est. tax owed @ 24.0%
- −$184
- After-tax cash flow
- $2,047/yr
For passive investors: Depreciation is non-cash, so a rental often shows a tax loss while cash-flowing — sheltering income. Rental losses are passive: they offset passive income freely, and up to $25,000/yr can offset ordinary (W-2) income if you actively participate and your MAGI is under $100k (phasing out to $0 by $150k); unused losses carry forward. On sale, claimed depreciation is recaptured at up to 25%, and gains may owe capital-gains tax (a 1031 exchange can defer both). Figures are a year-1 estimate at your 24.0% rate — not tax advice; consult a CPA.
Schools (NCES district)
- District
- Pinellas
- NCES district ID
- 1201560
- Math proficiency
- 51% ▼ -5.00%
- Reading proficiency
- 51% ▼ -3.00%
- Median HH income
- $46,270
- Composite
- 43.27/100
- National rank
- #3046
- State rank
- #31 of 73 in FL
Livability — St. Petersburg
No livability data for this city. (Only ~50 U.S. cities are tracked.)
Census & demographics
- Census place
- St. Petersburg, FL
- County
- Pinellas County · 939,478 people
- City population
- 249,151
- Metro
- Tampa-St. Petersburg-Clearwater, FL
- Population (ZIP)
- 33,796
- Household income
- $78,611
- Rent vs Own
- Severe rent burden
- 542.0
Population outlook (Pinellas County) Hauer SSP2
- Today (2025)
- 1,027,532 people
- By 2030
- 1,063,586 · +3.5%
- By 2040
- 1,125,020 · +9.5%
- By 2050
- 1,168,637 · +13.7%
- By 2075
- 1,265,188 · +23.1%
- By 2100
- 1,260,357 · +22.7%
Race, ethnicity, and origin ACS 2023
- Neighborhood character
- Predominantly White (77%)
- Race & ethnicity
- White 77% Two or more races 10% Hispanic / Latino 9% Asian 5% Black 4%
- Hispanic origin (detail)
- Mexican 1% Puerto Rican 2% Cuban 2%
- Common ancestry
- Lithuanian 3% Romanian 3% Slovak 2%
- Foreign-born
- 12% · Canada, Vietnam, China
- Languages at home
- 85% English-only · Spanish 7% Other Indo-European 2% Russian/Polish/Slavic 2%
Political lean MEDSL · Pinellas
- 2024 margin
- Lean R (+5.2) · D 46.9% · R 52.1%
- 2008→2024 swing
- -13.5pp toward R · 2008: 8.3pp · 2024: -5.2pp
- All cycles
- 2024: R+5.2 2020: D+0.2 2016: R+1.1 2012: D+5.6 2008: D+8.3
Not yet ingested
- Civics
- —
Market trends
- HPI YoY
- ▼ -547.31%
- Current HPI
- 405.0731
- Rent YoY
- ▼ -0.48%
- Metro
- Tampa-St. Petersburg-Clearwater, FL
- State GDP YoY
- ▲ 3.28%
- F500 in state
- 36
Industry mix (Fortune 500 HQ in FL)
| Industry | F500 HQs | Revenue |
|---|---|---|
| Industrial Technology | 2 | $29B |
|
||
| Insurance | 2 | $17B |
|
||
| Retail | 1 | $60B |
|
||
| Technology Distribution | 1 | $58B |
|
||
| Homebuilding | 1 | $35B |
|
||
| Technology Manufacturing | 1 | $35B |
|
||
Price history
+224.3% since first listed5 events — show timeline
- 2026-05-12 Listed $120,000 Stellar MLS as Distributed by MLS Grid
- 2004-06-04 Sold (Public Records) $60,000 Public Records
- 1987-08-26 Sold (Public Records) $40,500 Public Records
- 1984-11-01 Sold (Public Records) $38,000 Public Records
- 1981-07-01 Sold (Public Records) $37,000 Public Records
Property tax history
-15.2%/yrLatest (2025): $59 · +39.3% YoY. Source: county tax records.
Cash-flow waterfall
monthlySold comps — $/sqft
last 12 mo · ≤1 miLoading sold comps…