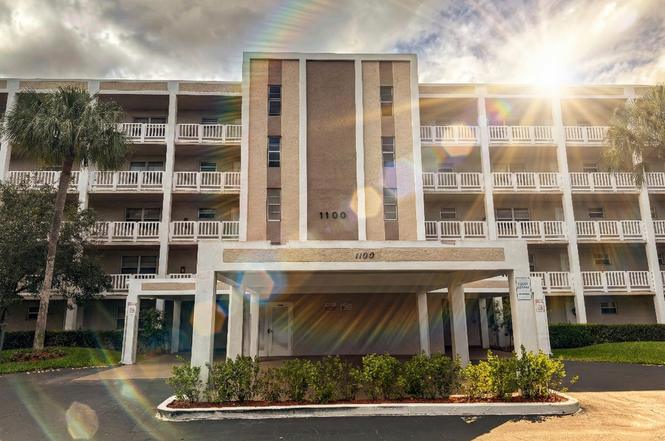
1100 NW 87th Ave #405 · Coral Springs, FL
Flood risk 1/10 · Minimal
- FEMA flood zone
- X (shaded)
- Chance of flooding over 30 yrs
- 0.0%
- Est. flood insurance / yr
- $507 – $1,088
Fire risk 1/10 · Minimal
- Est. fire insurance / yr
- $947 – $1,759
Heat risk 9/10 · Severe
- Hot days now (above 106°F)
- 6 days/yr
- Hot days in 30 yrs
- 23 days/yr
Wind risk 10/10 · Severe
- Chance of severe wind over 30 yrs
- 99.0%
Air-quality risk 3/10 · Minor
- Unhealthy air days now
- 3 days/yr
- Unhealthy air days in 30 yrs
- 3 days/yr
Risk factors via First Street. Map © Google.
Why this score? — see what drove the C grade
The composite is a weighted blend of 9 inputs, each scored 0–100. Each bar is that input's sub-score; the figure is the points it added to the 100-point composite (weight × sub-score).
- Cash flow +19.0/30.0
- 1% rule +10.0/10.0
- ARV discount +7.5/15.0
- DSCR +6.0/10.0
- Schools +4.1/10.0
- Livability +4.0/5.0
- Condition / age +2.5/5.0
- Rent growth +2.4/5.0
- Appreciation +0.0/10.0
$99,000
🖨 Deal sheet 📄 Offer letter ✓ Due diligence
Listing remarks
Bright 1 Bed / 1.5 Bath, 835 sq ft Condo in the Heart of Coral Springs. Welcome to this inviting 1-bedroom, 1.5-bath condo in the quiet and well-kept Sherwood Square community for all ages. The unit has new carpet floors, but original kitchen, bathrooms and everything else. It's priced as Handyman Special and is ready for the new owner. This bright and spacious unit has a great potential, and features an open layout filled with natural light, a comfortable living area, and sliding doors leading to a screened-in balcony overlooking a private, beautifully landscaped green space — perfect for morning coffee or unwinding in the evening. The bedroom offers generous closet space, and the ha
Key facts
- New carpet floors
- Natural light
- Open layout
Tags
Property features AI
Finance
- HOA & community: Monthly HOA with elevator(s), pool, and tennis court(s)
Exterior
- Parking: 1 open parking space
- Utilities: Cable availability
- Home design: Condominium; 5 total stories; Faces east
- Construction: Concrete construction
- Exterior features: Not waterfront; No waterfront features listed
Interior
- Bedrooms: 1 bedroom on the main level
- Flooring: Carpet flooring
- Bathrooms: 1 full bathroom; 1 half bathroom
- Heating & cooling: Central heating; Central air conditioning
- Interior features: Unfurnished; No special interior features listed
Neighborhood map
What this means for you Summary
Snapshot
- This is a 1-bed/2.0-bath condo listed at $99k.
Deal economics
- At list price, monthly cash flow is $103 ($1k/yr) — positive.
- The deal already cash-flows at list — no discount required.
- Meets the 1% rule at list price ($2k rent vs $99k).
- Recommended offer: $87k (12.0% below list) — sets the bar for market timing.
- Cap rate 7.5% vs local median 3.6% in Coral Springs — top-decile yield for the area; either an underpriced asset or a hidden risk that comps aren't pricing in. Stress-test before assuming the spread holds.
Location & tenants
- Location reads 79/100 on livability (#145 in FL, #2,163 nationally) — a middle-class / working-renter tenant base. Strengths: housing A+, health & safety A+, crime A; Watch: amenities F, cost of living F.
- Broward (suburban): math 42% / reading 53% proficiency, ranked #46 of 73 in FL (top 63%) — families likely to look elsewhere, expect single-tenant / working-renter base with shorter leases.
- Market conditions: Rents soft (-0.6%/yr); 243 active listings in the ZIP; 40 comparable units currently listed for rent nearby; rentals at typical pace (median 17d on market — plan ~3-4 weeks tenant-placement turnaround); solid renter incomes; 2,111 units permitted in Broward County in 2024 (1,265 in 5+ unit buildings).
Forward outlook
- Local home prices are declining (-3.0%/yr); year-one equity from $684 of loan paydown is wiped out by about $3k of value loss. Plan a longer hold.
- Broward County population projected at +34% by 2050 — long-run rental-demand tailwind backs the buy-and-hold thesis.
Negotiation context
- It's been on market 148 days — a 12% lower offer ($87k) is reasonable based on typical stale-listing flexibility.
- 2 sale attempts; this cycle's ask has dropped $10k (9%) from the opening price — seller is motivated, your offer sets the floor, not the list.
- Current owner paid $44k; list at $99k implies a 125% gain — meaningful room to come down on a strong offer.
Risks & watch-outs
- Watch-outs: property tax is 3.8% of price; HOA is 28% of rent.
- Climate carrying-cost: severe wind risk, 99% chance of damaging wind over 30y; extreme-heat days projected 6→23/yr by 2055 (HVAC capex compounding) — expect insurance premiums to compound above CPI over the hold.
Questions for the listing agent
- It's been on market 148 days. Have you received any prior offers? Is the seller open to a 12% concession, seller financing, or rate buy-down credit?
- Property tax is high relative to price — has the assessment been appealed recently, and will the sale trigger a re-assessment?
- What does the HOA fee cover, when was the last increase, and are there any pending special assessments or reserve-fund shortfalls?
- Any open or pending special assessments — roof, HVAC, plumbing, elevator, façade? What's the per-unit balance and payoff schedule, and is the seller paying it off at close or rolling it to the buyer?
- Why hasn't it sold? Are there any deal-killer items the seller is aware of (foundation, flood, title, zoning, code violations)?
- Is there a deadline driving the sale (1031 exchange, divorce, estate, relocation)? That informs how much negotiation room exists.
- Schools are A-rated — typically a magnet for longer-tenancy family renters. What's the average tenant stay here, and is there a school-zone premium baked into asking?
- What's the average days-on-market for RENTAL listings here right now (not sales)? A rising rental-DOM trend means longer vacancies and softer asking-rent achievability than the comps imply.
- What's the recent tenant-quality profile in this submarket — average credit score on applications, eviction rate, late-payment / NSF rate, and stable-employment percentage? A property-management company in the area should have these aggregated.
- How much new apartment / multifamily construction is in the pipeline within 1–3 miles? Heavy new supply (>2% of stock underway) typically softens rents 12–24 months out; light construction supports rent growth.
Investment metrics
- 1% rule
- 1.95% ✓
- Cap rate
- 7.55%
- Cash-on-cash
- 4.48%
- DSCR
- 1.20
- GRM
- 4.3
CMA / ARV
No comps found within radius.
Projected returns pro-forma
-3.0% appreciation · 0.0% rent growth · sell at horizon
- IRR
- -15.7%
- Equity multiple
- 0.47×
- Total profit
- $-14,623
- Equity at exit
- $14,761
- IRR
- -24.9%
- Equity multiple
- 0.13×
- Total profit
- $-24,123
- Equity at exit
- $8,560
Cash invested: $27,720 (down + closing). Projections, not guarantees.
Landlord ↔ Tenant lean methodology
- Overall (STATE)
- 87 Strongly Landlord-Friendly
- State Florida
- 87 Strongly Landlord-Friendly · R+3
- County
- — inherits STATE
- City
- — inherits STATE
ZIP-level market 33071
- Home prices YoY
- -35.0%
- Rents YoY
- -0.6%
- Active inventory
- 243
- Price-to-rent
- 4.3×
Monthly cashflow live
- Estimated rent
- $1,927 high interval (Pro) →
- Mortgage (P&I)
- −$519
- Tax from tax record
- −$311 /mo · $3,736/yr
- Insurance
- −$41
- HOA
- −$547
- Vacancy / Maint / Mgmt
- −$405
- Net cashflow
- $103
Break-even live
UW: 25.0% down · 7.5% · 30yr · 1.5% tax · 5.0% vac · 8.0% maint · 8.0% mgmt
Financing live
Cash to close
- Down payment
- $24,750
- Closing costs
- $2,970
- Reserves months
- —
- Total cash needed
- —
Loan-product check · same deal, 3 products live
Conventional
25% down · 7.5% · 30yr
- Down + closing
- —
- Monthly P&I
- —
- Monthly cashflow
- —
- DSCR
- —
- Eligible?
- —
Personal DTI + credit; lowest rate.
DSCR
20% down · 8.5% · 30yr
- Down + closing
- —
- Monthly P&I
- —
- Monthly cashflow
- —
- DSCR
- —
- Eligible?
- —
No personal income docs; deal must DSCR.
Hard money
10% down · 12.0% · 12mo
- Down + closing
- —
- Monthly P&I
- —
- Monthly cashflow
- —
- DSCR
- —
- Eligible?
- —
Short-term bridge; refi at stabilization.
Rent comps 40 comps
| Address | Beds | Baths | Sqft | Rent | $/sqft | DOM | Units | Dist |
|---|---|---|---|---|---|---|---|---|
| 1100 NW 87th Ave Coral Springs, FL | 2.0 | 2.0 | 1045 | $1,675 | $1.60 | 14d | 2 | 0.04mi |
| 1100 NW 87th Ave #208 Coral Springs, FL | 2.0 | 2.0 | 1100 | $1,700 | $1.55 | 17d | 1 | 0.04mi |
| 1075 Riverside Dr #306 Coral Springs, FL | 2.0 | 2.0 | 990 | $1,899 | $1.92 | 24d | 1 | 0.08mi |
| 8720 Shadow Wood Blvd Coral Springs, FL | 1.0–2.0 | 1.5–2.0 | 1050 | $1,750 | $1.67 | 3d | 3 | 0.08mi |
| 995 Riverside Dr #111 Coral Springs, FL | 2.0 | 2.0 | 1200 | $2,400 | $2.00 | 17d | 1 | 0.15mi |
| 875 Riverside Dr Coral Springs, FL | 2.0 | 2.0 | 1000 | $2,225 | $2.23 | 7d | 2 | 0.23mi |
| 875 Riverside Dr Coral Springs, FL | 2.0 | 2.0 | 1000 | $2,225 | $2.23 | 11d | 2 | 0.23mi |
| 799 Riverside Dr #1021 Coral Springs, FL | 2.0 | 2.0 | 1060 | $2,400 | $2.26 | 18d | 1 | 0.24mi |
| 9000 Ramblewood Dr Apt 605 Coral Springs, FL | 1.0 | 1.0 | 743 | $1,971 | $2.65 | 3d | 1 | 0.25mi |
| 9000 Ramblewood Dr Apt 605 Coral Springs, FL | 1.0 | 1.0 | 743 | $2,208 | $2.97 | 24d | 1 | 0.25mi |
| 755 Riverside Dr Coral Springs, FL | 1.0 | 1.0 | 780 | $1,700 | $2.18 | 11d | 2 | 0.27mi |
| 777 Riverside Dr #1512 Coral Springs, FL | 1.0 | 1.0 | 950 | $1,750 | $1.84 | 24d | 1 | 0.28mi |
| 755 Riverside Dr #1335 Coral Springs, FL | 1.0 | 1.0 | 780 | $1,800 | $2.31 | 7d | 1 | 0.28mi |
| 9000 Ramblewood Dr Coral Springs, FL | 2.0 | 2.0 | 1127 | $2,655 | $2.36 | 20d | 1 | 0.28mi |
| 9000 Ramblewood Dr Coral Springs, FL | 2.0 | 2.0 | 1127 | $2,675 | $2.37 | 24d | 1 | 0.28mi |
| 1599 NW 91st Ave Coral Springs, FL | 1.0–3.0 | 1.0–2.0 | 1120 | $1,758 | $1.57 | 1d | 29 | 0.41mi |
| 9111 Ramblewood Dr Coral Springs, FL | 1.0–3.0 | 1.0–2.0 | 1131 | $1,748 | $1.54 | 2d | 26 | 0.43mi |
| 1351 NW 94th Way Unit 1 Coral Springs, FL | 2.0 | 1.5 | 837 | $1,700 | $2.03 | 2d | 1 | 0.59mi |
| 1351 NW 94th Way #1351 Coral Springs, FL | 2.0 | 1.5 | 837 | $1,700 | $2.03 | 24d | 1 | 0.59mi |
| 1357 NW 94th Way #1357 Coral Springs, FL | 2.0 | 1.5 | 837 | $1,875 | $2.24 | 15d | 1 | 0.59mi |
| 9022 W Atlantic Blvd #214 Coral Springs, FL | 2.0 | 2.0 | 986 | $2,000 | $2.03 | 4d | 1 | 0.60mi |
| 9066 W Atlantic Blvd #433 Coral Springs, FL | 2.0 | 2.0 | 986 | $1,950 | $1.98 | 24d | 1 | 0.60mi |
| 9288 W Atlantic Blvd #1114 Coral Springs, FL | 2.0 | 2.0 | 986 | $2,250 | $2.28 | 24d | 1 | 0.61mi |
| 9266 W Atlantic Blvd #1025 Coral Springs, FL | 2.0 | 2.0 | 986 | $2,000 | $2.03 | 15d | 1 | 0.61mi |
| 9266 W Atlantic Blvd #1026 Coral Springs, FL | 2.0 | 2.0 | 986 | $2,000 | $2.03 | 24d | 1 | 0.61mi |
| 9266 W Atlantic Blvd #1025 Coral Springs, FL | 2.0 | 2.0 | 986 | $2,000 | $2.03 | 7d | 1 | 0.61mi |
| 9088 W Atlantic Blvd #523 Coral Springs, FL | 2.0 | 2.0 | 986 | $1,900 | $1.93 | 18d | 1 | 0.64mi |
| 1020 NW 80th Ave #203 Margate, FL | 2.0 | 2.0 | 1000 | $1,900 | $1.90 | 2d | 1 | 0.69mi |
| 1020 NW 80th Ave #203 Margate, FL | 2.0 | 2.0 | 1000 | $1,900 | $1.90 | 12d | 1 | 0.69mi |
| 9122 W Atlantic Blvd #724 Coral Springs, FL | 2.0 | 2.0 | 986 | $2,150 | $2.18 | 7d | 1 | 0.69mi |
| 1480 NW 80th Ave #402 Margate, FL | 2.0 | 2.0 | 1000 | $1,875 | $1.88 | 7d | 1 | 0.70mi |
| 1025 Country Club Dr #302 Margate, FL | 2.0 | 2.0 | 920 | $1,475 | $1.60 | 24d | 1 | 0.78mi |
| 1035 Country Club Dr Margate, FL | 1.0–2.0 | 1.0–2.0 | 925 | $1,390 | $1.50 | 24d | 2 | 0.78mi |
| 1700 NW 80th Ave #108 Margate, FL | 2.0 | 2.0 | 1000 | $1,800 | $1.80 | 24d | 1 | 0.79mi |
| 1005 Country Club Dr Margate, FL | 2.0 | 2.0 | 925 | $1,475 | $1.59 | 22d | 2 | 0.81mi |
| 1030 Country Club Dr #309 Margate, FL | 2.0 | 2.0 | 1038 | $1,450 | $1.40 | 24d | 1 | 0.84mi |
| 1030 Country Club Dr #401 Margate, FL | 2.0 | 2.0 | 930 | $1,450 | $1.56 | 18d | 1 | 0.84mi |
| 1030 Country Club Dr #401 Margate, FL | 2.0 | 2.0 | 930 | $1,450 | $1.56 | 4d | 1 | 0.84mi |
| 8820 Royal Palm Blvd Unit 209 Coral Springs, FL | 2.0 | 2.0 | 805 | $1,795 | $2.23 | 4d | 1 | 0.90mi |
| 1010 Country Club Dr #206 Margate, FL | 1.0 | 1.5 | 775 | $1,450 | $1.87 | 24d | 1 | 0.92mi |
HOA detail condo
- Monthly dues
- $547 · $6,564/yr
- Assessments
- None detected in remarks — confirm with the listing agent.
Listing history 18 events
-
2026-06-18days on market $99,000 Active 148 DOM
-
2026-06-17days on market $99,000 Active 147 DOM
-
2026-06-16days on market $99,000 Active 146 DOM
-
2026-06-15days on market $99,000 Active 145 DOM
-
2026-06-13days on market $99,000 Active 143 DOM
-
2026-06-09days on market $99,000 Active 139 DOM
-
2026-06-07days on market $99,000 Active 137 DOM
-
2026-06-04days on market $99,000 Active 134 DOM
-
2026-06-03days on market $99,000 Active 133 DOM
-
2026-06-02days on market $99,000 Active 132 DOM
-
2026-06-01days on market $99,000 Active 131 DOM
-
2026-05-31days on market $99,000 Active 130 DOM
-
2026-03-27status Active
-
2026-03-18historical Active Under Contract
-
2026-01-28price $99,000
-
2026-01-21$109,000 Active
-
2001-07-12soldstatus $44,000
-
1980-04-01soldstatus $48,800
ⓘ Source: listings_history table (triggers on properties + properties_extension) + one-shot
backfill from property_details.listing_events for pre-trigger history.
Tax reassessment forecast FL · Resets to sale price
- Current annual tax
- $3,736 · $311/mo
- Projected year-2 tax
- $3,736 · $311/mo
- Expected delta
- $0/yr ($0/mo · 0.0%)
ⓘ Screening estimate from a state-policy table — verify with the county assessor before closing.
Climate risk First Street
- Flood 1/10 Low FEMA zone X (shaded) · 0% chance over 30 yrs
- Wildfire 1/10 Low
- Heat 9/10 Extreme 6 d/yr ≥106°F today · 23 d/yr by 30 yrs out
- Wind 10/10 Extreme 99% chance of damaging wind over 30 yrs
- Air quality 3/10 Moderate 3 unhealthy d/yr today · 3 by 30 yrs out
Nearby sold comps map
Loading sold comps map…
Walkable amenities ~0.75 mi
Loading nearby amenities…
Taxation est. · year 1
- Rental income
- $23,121
- − Mortgage interest
- −$5,546
- − Property taxes
- −$3,736
- − Insurance
- −$495
- − Repairs & maintenance
- −$1,850
- − Management
- −$1,850
- − HOA
- −$6,564
- − Depreciation
- −$2,880
- Taxable income
- $201
- Est. tax owed @ 24.0%
- −$48
- After-tax cash flow
- $1,192/yr
For passive investors: Depreciation is non-cash, so a rental often shows a tax loss while cash-flowing — sheltering income. Rental losses are passive: they offset passive income freely, and up to $25,000/yr can offset ordinary (W-2) income if you actively participate and your MAGI is under $100k (phasing out to $0 by $150k); unused losses carry forward. On sale, claimed depreciation is recaptured at up to 25%, and gains may owe capital-gains tax (a 1031 exchange can defer both). Figures are a year-1 estimate at your 24.0% rate — not tax advice; consult a CPA.
Schools (NCES district)
- District
- Broward
- NCES district ID
- 1200180
- Math proficiency
- 42% ▼ -18.00%
- Reading proficiency
- 53% ▼ -5.00%
- Median HH income
- $52,139
- Composite
- 40.88/100
- National rank
- #3621
- State rank
- #46 of 73 in FL
Livability — Coral Springs
- Score
- 79/100
- State rank
- #145
- US rank
- #2163
Category grades
Schools grade is shown separately in the Schools card above.
Census & demographics
- Census place
- Coral Springs, FL
- County
- Broward County · 1,963,430 people
- City population
- 101,171
- Metro
- Miami-Fort Lauderdale-Pompano Beach, FL
- Population (ZIP)
- 42,255
- Household income
- $106,149
- Rent vs Own
- Severe rent burden
- 1123.0
Population outlook (Broward County) Hauer SSP2
- Today (2025)
- 2,207,033 people
- By 2030
- 2,360,704 · +7.0%
- By 2040
- 2,661,208 · +20.6%
- By 2050
- 2,946,698 · +33.5%
- By 2075
- 3,602,273 · +63.2%
- By 2100
- 3,970,984 · +79.9%
Race, ethnicity, and origin ACS 2023
- Neighborhood character
- Highly diverse neighborhood (Simpson 0.71)
- Race & ethnicity
- White 35% Hispanic / Latino 34% Black 22% Two or more races 20% Asian 5%
- Hispanic origin (detail)
- Mexican 2% Puerto Rican 7% Cuban 3% Dominican 3%
- Common ancestry
- Hispanic 4% Romanian 3% Scotch-Irish 2%
- Foreign-born
- 32% · Canada, Jamaica, China
- Languages at home
- 60% English-only · Spanish 28% French/Haitian/Cajun 5% Other Indo-European 2%
Political lean MEDSL · Broward
- 2024 margin
- D (+17.0) · D 58.0% · R 41.0%
- 2008→2024 swing
- -17.8pp toward R · 2008: 34.7pp · 2024: 17.0pp
- All cycles
- 2024: D+17.0 2020: D+29.8 2016: D+35.0 2012: D+34.9 2008: D+34.7
Not yet ingested
- Civics
- —
Market trends
- HPI YoY
- ▼ -203.71%
- Current HPI
- 378.3293
- Rent YoY
- ▼ -0.56%
- Metro
- Miami-Fort Lauderdale-Pompano Beach, FL
- State GDP YoY
- ▲ 3.28%
- F500 in state
- 36
Industry mix (Fortune 500 HQ in FL)
| Industry | F500 HQs | Revenue |
|---|---|---|
| Industrial Technology | 2 | $29B |
|
||
| Insurance | 2 | $17B |
|
||
| Retail | 1 | $60B |
|
||
| Technology Distribution | 1 | $58B |
|
||
| Homebuilding | 1 | $35B |
|
||
| Technology Manufacturing | 1 | $35B |
|
||
Price history
+102.9% since first listed6 events — show timeline
- 2026-03-27 Relisted — Beaches MLS
- 2026-03-18 Contingent — Beaches MLS
- 2026-01-28 Price Changed $99,000 Beaches MLS
- 2026-01-21 Listed $109,000 Beaches MLS
- 2001-07-12 Sold (Public Records) $44,000 Public Records
- 1980-04-01 Sold (Public Records) $48,800 Public Records
Property tax history
+18.1%/yrLatest (2025): $3,736 · +496.6% YoY. Source: county tax records.
Cash-flow waterfall
monthlySold comps — $/sqft
last 12 mo · ≤1 miLoading sold comps…