4329 Obsidian Pl · Mesquite, TX
Flood risk No data
- FEMA flood zone
- —
- Chance of flooding over 30 yrs
- —
- Est. flood insurance / yr
- —
Fire risk No data
- Est. fire insurance / yr
- —
Heat risk No data
- Hot days now (above threshold)
- —
- Hot days in 30 yrs
- —
Wind risk No data
- Chance of severe wind over 30 yrs
- —
Air-quality risk No data
- Unhealthy air days now
- —
- Unhealthy air days in 30 yrs
- —
Risk factors via First Street. Map © Google.
Why this score? — see what drove the D- grade
The composite is a weighted blend of 9 inputs, each scored 0–100. Each bar is that input's sub-score; the figure is the points it added to the 100-point composite (weight × sub-score).
- Cash flow +12.1/30.0
- ARV discount +6.3/15.0
- Condition / age +4.0/5.0
- DSCR +3.6/10.0
- 1% rule +3.5/10.0
- Livability +3.5/5.0
- Schools +2.9/10.0
- Rent growth +2.5/5.0
- Appreciation +0.0/10.0
$441,049
🖨 Deal sheet 📄 Offer letter ✓ Due diligence
Listing remarks
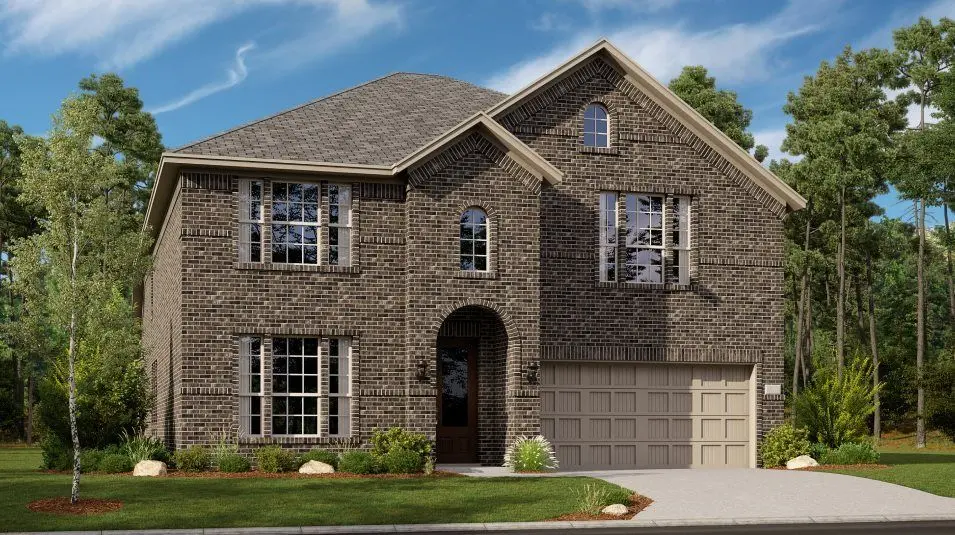
This sophisticated home boasts two floors of modern living space that makes everyday gathering effortless with a central open-concept design, covered patio and soaring ceilings. The owner's suite and walk-in closet enjoys privacy with a flexible study on the first floor as the upper-level enjoys three secondary bedrooms, a breezy game room and media room for endless possibilities.
Key facts
- Open-concept design
- Walk-in closet
- Flexible study
Tags
Property features AI
Finance
- Other: Listing status: Active
- Financial info: List price: $474,999; Inventory type: Spec
Exterior
- Home design: Sunstone w/ Media Standard plan
- Construction: Built in 2026 (new construction); Living area approximately 3,357
- Exterior features: New construction spec home; Address: 4329 Obsidian Pl, Mesquite, TX 75181
Interior
- Kitchen: Kitchen included (details not provided)
- Bedrooms: 5 bedrooms
- Bathrooms: 4 full bathrooms and 1 half bathroom (4.5 total)
- Interior features: Open plan living spaces (based on new construction plan)
- Laundry & utility: Laundry/utility area included (details not provided)
Neighborhood map
What this means for you Summary
Snapshot
- This is a 5-bed/4.5-bath single-family listed at $441k. Condition is rated good.
Deal economics
- At list price, monthly cash flow is $-100 ($-1k/yr) — negative.
- To cash-flow at today's rent, offer at most $427k (3.3% below list).
- To meet the 1% rule (rent ≥ 1% of price), the offer needs to be $373k (15.4% below list).
- Recommended offer: $373k (15.4% below list) — sets the bar for 1% rule.
- Cap rate 6.0% vs local median 4.4% in Mesquite — top-decile yield for the area; either an underpriced asset or a hidden risk that comps aren't pricing in. Stress-test before assuming the spread holds.
Location & tenants
- Location reads 70/100 on livability (#358 in TX) — a middle-class / working-renter tenant base. Strengths: cost of living A+, housing A+, health & safety A-; Watch: schools C-, crime F, commute F.
- Mesquite ISD (suburban): math 35% / reading 32% proficiency, ranked #536 of 826 in TX (top 65%) — families likely to look elsewhere, expect single-tenant / working-renter base with shorter leases; 63% free/reduced lunch — lower-income household profile, screen leases tightly.
- Market conditions: Rents flat; 590 active listings in the ZIP; 4 comparable units currently listed for rent nearby; rentals at typical pace (median 24d on market — plan ~3-4 weeks tenant-placement turnaround); high-income renter base; 12,577 units permitted in Dallas County in 2024 (6,829 in 5+ unit buildings).
- This rent runs 40% of the median local income ($111k/yr) — at the standard rent-burdened threshold; future hikes will face affordability resistance.
Forward outlook
- Local home prices are declining (-3.0%/yr); year-one equity from $3k of loan paydown is wiped out by about $13k of value loss. Plan a longer hold.
- Dallas County population projected at +35% by 2050 — long-run rental-demand tailwind backs the buy-and-hold thesis.
Negotiation context
- It's been on market 32 days — a 3% lower offer ($428k) is reasonable based on typical stale-listing flexibility.
Questions for the listing agent
- What do current leases actually rent for vs. the listed asking? Can we see a recent rent roll and the last 12 months of T-12 income?
- It's been on market 32 days. Have you received any prior offers? Is the seller open to a 15% concession, seller financing, or rate buy-down credit?
- Is there a deadline driving the sale (1031 exchange, divorce, estate, relocation)? That informs how much negotiation room exists.
- Crime grade is F in this area — have there been break-ins, vandalism, or insurance claims at this property in the last 3 years? What carrier currently insures it and at what premium?
- The area grade is low — what's the realistic commute time and amenity access for the typical tenant pool here? Any planned neighborhood developments (good or bad) we should know about?
- What's the average days-on-market for RENTAL listings here right now (not sales)? A rising rental-DOM trend means longer vacancies and softer asking-rent achievability than the comps imply.
- What's the recent tenant-quality profile in this submarket — average credit score on applications, eviction rate, late-payment / NSF rate, and stable-employment percentage? A property-management company in the area should have these aggregated.
- How much new for-sale + rental construction is in the pipeline within 1–3 miles? Heavy new supply typically softens prices + rents 12–24 months out; constrained supply supports both.
Investment metrics
- 1% rule
- 0.85% ✗
- Cap rate
- 6.02%
- Cash-on-cash
- -0.97%
- DSCR
- 0.96
- GRM
- 9.8
CMA / ARV
- ARV (on-the-fly)
- $429,696
- Comps found
- 12
Show comp detail 12 sales within ~0.75 mi
| Address | Dist | Beds/Ba | Sqft | Sold | Price | $/sf | Match |
|---|---|---|---|---|---|---|---|
| 3408 Falcon Field NONE | 0.14mi | 5/4.5 | 3,357 (0%) | 4mo | $434,599 | $129 | 90 |
| 3916 Elements Way | 0.15mi | 5/4.5 | 3,357 (0%) | 6mo | $425,674 | $127 | 88 |
| 3900 Falcon Fld | 0.19mi | 5/4.5 | 3,357 (0%) | 5mo | $428,403 | $128 | 87 |
| 3909 Falcon Fld | 0.22mi | 5/4.5 | 3,357 (0%) | 9mo | $411,849 | $123 | 82 |
| 3829 Turtle Xing | 0.26mi | 5/4.5 | 3,357 (0%) | 8mo | $417,749 | $124 | 82 |
| 3920 Elements Way | 0.15mi | 4/3.5 (-1) | 3,181 (-5%) | 2mo | $390,999 | $123 | 73 |
| 3700 Seth Pl | 0.40mi | 5/4.5 | 3,357 (0%) | 9mo | $448,294 | $134 | 73 |
| 3729 Seth Pl | 0.44mi | 5/4.5 | 3,357 (0%) | 10mo | $449,349 | $134 | 72 |
| 3501 Falcon Fld | 0.13mi | 4/3.5 (-1) | 3,181 (-5%) | 6mo | $389,974 | $123 | 71 |
| 3924 Falcon Fld | 0.25mi | 4/3.5 (-1) | 3,181 (-5%) | 9mo | $395,699 | $124 | 64 |
| 3728 Seth Pl | 0.47mi | 4/3.5 (-1) | 3,181 (-5%) | 6mo | $410,844 | $129 | 55 |
| 3733 Seth Pl | 0.45mi | 4/3.5 (-1) | 3,181 (-5%) | 10mo | $425,339 | $134 | 52 |
Match score weights: distance 35% · size 25% · config 20% · recency 20%. Top-matched comps best support the ARV.
Projected returns pro-forma
-3.0% appreciation · 0.07% rent growth · sell at horizon
- IRR
- -21.2%
- Equity multiple
- 0.28×
- Total profit
- $-88,442
- Equity at exit
- $65,762
- IRR
- -23.6%
- Equity multiple
- -0.02×
- Total profit
- $-126,318
- Equity at exit
- $38,134
Cash invested: $123,494 (down + closing). Projections, not guarantees.
Landlord ↔ Tenant lean methodology
- Overall (STATE)
- 87 Strongly Landlord-Friendly
- State Texas
- 87 Strongly Landlord-Friendly · R+5
- County
- — inherits STATE
- City
- — inherits STATE
ZIP-level market 75181
- Home prices YoY
- -9.4%
- Rents YoY
- 0.1%
- Active inventory
- 590
- Price-to-rent
- 9.8×
Monthly cashflow live
- Estimated rent
- $3,732 medium interval (Pro) →
- Mortgage (P&I)
- −$2,313
- Tax est. 1.5%
- −$551 /mo · $6,616/yr
- Insurance
- −$184
- HOA
- −$0
- Vacancy / Maint / Mgmt
- −$784
- Net cashflow
- $-100
Break-even live
UW: 25.0% down · 7.5% · 30yr · 1.5% tax · 5.0% vac · 8.0% maint · 8.0% mgmt
Financing live
Cash to close
- Down payment
- $110,262
- Closing costs
- $13,231
- Reserves months
- —
- Total cash needed
- —
Loan-product check · same deal, 3 products live
Conventional
25% down · 7.5% · 30yr
- Down + closing
- —
- Monthly P&I
- —
- Monthly cashflow
- —
- DSCR
- —
- Eligible?
- —
Personal DTI + credit; lowest rate.
DSCR
20% down · 8.5% · 30yr
- Down + closing
- —
- Monthly P&I
- —
- Monthly cashflow
- —
- DSCR
- —
- Eligible?
- —
No personal income docs; deal must DSCR.
Hard money
10% down · 12.0% · 12mo
- Down + closing
- —
- Monthly P&I
- —
- Monthly cashflow
- —
- DSCR
- —
- Eligible?
- —
Short-term bridge; refi at stabilization.
Rent comps 4 comps
| Address | Beds | Baths | Sqft | Rent | $/sqft | DOM | Units | Dist |
|---|---|---|---|---|---|---|---|---|
| 3216 Southampton Dr Mesquite, TX | 5.0 | 3.5 | 2947 | $3,250 | $1.10 | 43d | 1 | 1.20mi |
| 6308 Ashford Trl Mesquite, TX | 5.0 | 3.0 | 3279 | $3,200 | $0.98 | 18d | 1 | 1.38mi |
| 1908 Twisted Tree Ln Mesquite, TX | 5.0 | 2.5 | 2750 | $3,670 | $1.33 | 24d | 1 | 1.40mi |
| 1308 Dawson Way Mesquite, TX | 4.0 | 2.5 | 2476 | $3,573 | $1.44 | 24d | 1 | 1.42mi |
Listing history 14 events
-
2026-06-18days on market $441,049 Active 32 DOM
-
2026-06-17days on market $441,049 Active 31 DOM
-
2026-06-16days on market $441,049 Active 30 DOM
-
2026-06-15days on market $441,049 Active 29 DOM
-
2026-06-13days on market $441,049 Active 27 DOM
-
2026-06-13days on market $441,049 Active 26 DOM
-
2026-06-09days on market $441,049 Active 23 DOM
-
2026-06-08days on market $441,049 Active 22 DOM
-
2026-06-07days on market $441,049 Active 21 DOM
-
2026-06-04days on market $441,049 Active 18 DOM
-
2026-06-03days on market $441,049 Active 17 DOM
-
2026-06-02days on market $441,049 Active 16 DOM
-
2026-06-01days on market $441,049 Active 15 DOM
-
2026-05-31days on market $441,049 Active 14 DOM
ⓘ Source: listings_history table (triggers on properties + properties_extension) + one-shot
backfill from property_details.listing_events for pre-trigger history.
Nearby sold comps map
Loading sold comps map…
Walkable amenities ~0.75 mi
Loading nearby amenities…
Taxation est. · year 1
- Rental income
- $44,787
- − Mortgage interest
- −$24,706
- − Property taxes
- −$6,616
- − Insurance
- −$2,205
- − Repairs & maintenance
- −$3,583
- − Management
- −$3,583
- − Depreciation
- −$12,831
- Taxable loss
- −$8,736
- Est. tax savings @ 24.0%
- +$2,097
- After-tax cash flow
- $902/yr
For passive investors: Depreciation is non-cash, so a rental often shows a tax loss while cash-flowing — sheltering income. Rental losses are passive: they offset passive income freely, and up to $25,000/yr can offset ordinary (W-2) income if you actively participate and your MAGI is under $100k (phasing out to $0 by $150k); unused losses carry forward. On sale, claimed depreciation is recaptured at up to 25%, and gains may owe capital-gains tax (a 1031 exchange can defer both). Figures are a year-1 estimate at your 24.0% rate — not tax advice; consult a CPA.
Condition & rehab AI · 12 photos
This well-maintained, modern home with a good condition score and minimal repairs needed is ready for a new owner. It offers a good balance of updates and maintenance to increase its value.
Value-add opportunities
- Both Painting the exterior brick — Enhances curb appeal and can increase both resale and rental value
- Both Landscaping improvements — Enhances curb appeal and can increase both resale and rental value
Renovation cost estimate screening
Value-add ROI direction
- Both Painting the exterior brick — Enhances curb appeal and can increase both resale and rental value ↑
- Both Landscaping improvements — Enhances curb appeal and can increase both resale and rental value ↑
ⓘ Cost ranges are severity-bucket heuristics (US national rule-of-thumb). Get contractor quotes + a written scope before underwriting a rehab budget.
Schools (NCES district)
- District
- Mesquite ISD
- NCES district ID
- 4830390
- Math proficiency
- 35% ▼ -11.00%
- Reading proficiency
- 32% ▼ -7.00%
- Median HH income
- $49,372
- Composite
- 29.06/100
- National rank
- #6606
- State rank
- #536 of 826 in TX
Livability — Mesquite
- Score
- 70/100
- State rank
- #358
- US rank
- #7743
Category grades
Schools grade is shown separately in the Schools card above.
Census & demographics
- Census place
- Mesquite, TX
- County
- Dallas County · 2,612,404 people
- City population
- 150,788
- Metro
- Dallas-Fort Worth-Arlington, TX
- Population (ZIP)
- 29,788
- Household income
- $111,052
- Rent vs Own
- Severe rent burden
- 857.0
Population outlook (Dallas County) Hauer SSP2
- Today (2025)
- 2,979,839 people
- By 2030
- 3,191,823 · +7.1%
- By 2040
- 3,619,611 · +21.5%
- By 2050
- 4,026,915 · +35.1%
- By 2075
- 4,957,073 · +66.4%
- By 2100
- 5,508,725 · +84.9%
Race, ethnicity, and origin ACS 2023
- Neighborhood character
- Highly diverse neighborhood (Simpson 0.71)
- Race & ethnicity
- Black 39% Hispanic / Latino 32% Two or more races 21% White 16% Asian 5% Native American 1%
- Hispanic origin (detail)
- Mexican 27% Puerto Rican 1%
- Common ancestry
- Slovak 2% Italian 1%
- Foreign-born
- 22% · Canada, Vietnam
- Languages at home
- 64% English-only · Spanish 27% Tagalog/Filipino 3% Other Asian/Pacific 1%
Political lean MEDSL · Dallas
- 2024 margin
- Strong D (+22.2) · D 60.2% · R 38.0% · Other 1.8%
- 2008→2024 swing
- +6.9pp toward D · 2008: 15.3pp · 2024: 22.2pp
- All cycles
- 2024: D+22.2 2020: D+31.6 2016: D+26.2 2012: D+15.4 2008: D+15.3
Not yet ingested
- Civics
- —
Market trends
- HPI YoY
- ▼ -26.63%
- Current HPI
- 257.0959
- Rent YoY
- ▲ 0.07%
- Metro
- Dallas-Fort Worth-Arlington, TX
- State GDP YoY
- ▲ 3.95%
- F500 in state
- 110
Industry mix (Fortune 500 HQ in TX)
| Industry | F500 HQs | Revenue |
|---|---|---|
| Energy | 16 | $1,198B |
|
||
| Technology | 5 | $198B |
|
||
| Engineering / Construction | 4 | $72B |
|
||
| Energy Services | 3 | $60B |
|
||
| Utilities | 3 | $41B |
|
||
| Healthcare | 2 | $330B |
|
||
Cash-flow waterfall
monthlySold comps — $/sqft
last 12 mo · ≤1 miLoading sold comps…