 🏷️ Likely Rental
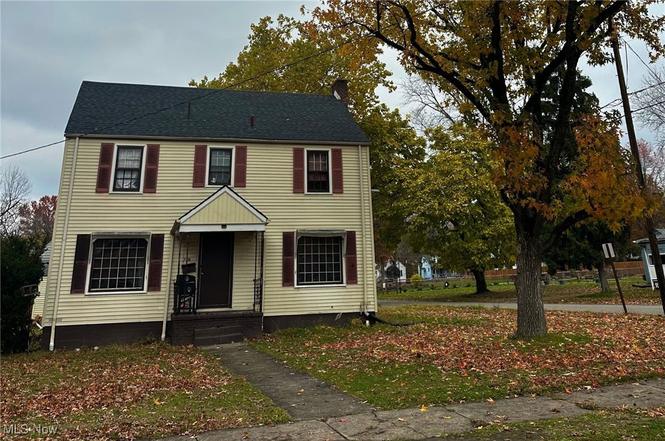
504 W Boston Ave · Youngstown, OH
Flood risk 1/10 · Minimal
- FEMA flood zone
- X (unshaded)
- Chance of flooding over 30 yrs
- 0.0%
- Est. flood insurance / yr
- $473 – $860
Fire risk 1/10 · Minimal
- Est. fire insurance / yr
- $713 – $1,323
Heat risk 2/10 · Minimal
- Hot days now (above 96°F)
- 7 days/yr
- Hot days in 30 yrs
- 16 days/yr
Wind risk 1/10 · Minimal
- Chance of severe wind over 30 yrs
- —
Air-quality risk 2/10 · Minimal
- Unhealthy air days now
- 1 days/yr
- Unhealthy air days in 30 yrs
- 2 days/yr
Risk factors via First Street. Map © Google.
Why this score? — see what drove the B grade
The composite is a weighted blend of 9 inputs, each scored 0–100. Each bar is that input's sub-score; the figure is the points it added to the 100-point composite (weight × sub-score).
- Cash flow +30.0/30.0
- ARV discount +15.0/15.0
- 1% rule +10.0/10.0
- DSCR +10.0/10.0
- Livability +4.0/5.0
- Rent growth +2.5/5.0
- Condition / age +2.5/5.0
- Schools +0.9/10.0
- Appreciation +0.0/10.0
$63,500
🖨 Deal sheet 📄 Offer letter ✓ Due diligence
Listing remarks
Tenant-occupied, income-producing single-family rental generating $800 per month in rent. Tenant pays all utilities and handles lawn care, resulting in low operating expenses. Property features a brand-new roof, reducing near-term capital expenditures. Spacious layout with original character, functional kitchen and bath, and usable basement space for storage or utilities. Interior reflects tenant occupancy and property is being sold as-is. Strong rent-to-price ratio makes this a solid long-term buy-and-hold investment. Seller owns multiple rental properties and is open to selling individually or as part of a package.
Key facts
- Functional kitchen
- Brand-new roof
- 8,712 sq ft lot
Tags
Property features AI
Exterior
- Parking: 1-car garage
- Utilities: Public water; Public sewer
- Home design: 2-story house; Shingle roof; Vinyl siding
- Construction: Built (year source: Public Records); Vinyl siding construction; Shingle roof
- Exterior features: Driveway
Interior
- Bathrooms: 1 full bathroom
- Heating & cooling: Forced air heating; Gas heating
- Interior features: Unfinished basement; Basement present; Fireplace (1)
Neighborhood map
What this means for you Summary
Snapshot
- This is a 3-bed/1.5-bath single-family listed at $64k.
Deal economics
- At list price, monthly cash flow is $574 ($7k/yr) — positive.
- The deal already cash-flows at list — no discount required.
- Meets the 1% rule at list price ($1k rent vs $64k).
- Recommended offer: $56k (12.0% below list) — sets the bar for market timing.
- Cap rate 17.1% vs local median 7.0% in Youngstown — top-decile yield for the area; either an underpriced asset or a hidden risk that comps aren't pricing in. Stress-test before assuming the spread holds.
Location & tenants
- Location reads 81/100 on livability (#99 in OH, #1,506 nationally) — a professional / high-income tenant draw. Strengths: amenities A+, commute A+, cost of living A+; Watch: crime F, employment F.
- Youngstown City (urban): math 8% / reading 17% proficiency, ranked #649 of 656 in OH (top 99%) — low school quality limits family demand, transient renter base, plan for 1-2y turnover; 88% free/reduced lunch — lower-income household profile, screen leases tightly.
- Market conditions: 73 active listings in the ZIP; 4 comparable units currently listed for rent nearby; rentals at typical pace (median 21d on market — plan ~3-4 weeks tenant-placement turnaround); 147 units permitted in Mahoning County in 2024 (0 in 5+ unit buildings).
Forward outlook
- Local home prices are declining (-3.0%/yr); year-one equity from $439 of loan paydown is wiped out by about $2k of value loss. Plan a longer hold.
- Mahoning County population projected at -14% by 2050 — secular population decline; favor cash flow + early exit over multi-decade hold.
- At projected returns (-3.0% appreciation + 3.0% rent growth), your $18k cash investment doubles in ~4 years — after that, you're playing with house money.
Negotiation context
- It's been on market 157 days — a 12% lower offer ($56k) is reasonable based on typical stale-listing flexibility.
Risks & watch-outs
- Watch-outs: built in 1945 — expect roof / HVAC / electrical / plumbing capex.
Questions for the listing agent
- It's been on market 157 days. Have you received any prior offers? Is the seller open to a 12% concession, seller financing, or rate buy-down credit?
- Built in 1945 — when were the roof, HVAC, electrical panel, plumbing, and water heater last replaced?
- Why hasn't it sold? Are there any deal-killer items the seller is aware of (foundation, flood, title, zoning, code violations)?
- Is there a deadline driving the sale (1031 exchange, divorce, estate, relocation)? That informs how much negotiation room exists.
- Crime grade is F in this area — have there been break-ins, vandalism, or insurance claims at this property in the last 3 years? What carrier currently insures it and at what premium?
- What's the average days-on-market for RENTAL listings here right now (not sales)? A rising rental-DOM trend means longer vacancies and softer asking-rent achievability than the comps imply.
- What's the recent tenant-quality profile in this submarket — average credit score on applications, eviction rate, late-payment / NSF rate, and stable-employment percentage? A property-management company in the area should have these aggregated.
- How much new for-sale + rental construction is in the pipeline within 1–3 miles? Heavy new supply typically softens prices + rents 12–24 months out; constrained supply supports both.
Investment metrics
- 1% rule
- 1.93% ✓
- Cap rate
- 17.14%
- Cash-on-cash
- 38.73%
- DSCR
- 2.72
- GRM
- 4.3
CMA / ARV
- ARV (on-the-fly)
- $102,912
- Comps found
- 12
Show comp detail 12 sales within ~0.75 mi
| Address | Dist | Beds/Ba | Sqft | Sold | Price | $/sf | Match |
|---|---|---|---|---|---|---|---|
| 537 W Ravenwood Ave | 0.29mi | 3/1.0 | 1,592 (+4%) | 11mo | $40,000 | $25 | 69 |
| 870 Canfield Rd | 0.45mi | 3/1.0 | 1,560 (+2%) | 9mo | $130,000 | $83 | 66 |
| 3414 Idlewood Ave | 0.37mi | 3/1.5 | 1,404 (-9%) | 5mo | $92,000 | $66 | 65 |
| 3412 Hudson Ave | 0.31mi | 3/1.5 | 1,716 (+12%) | 2mo | $60,250 | $35 | 64 |
| 452 W Midlothian Blvd | 0.51mi | 3/1.5 | 1,409 (-8%) | 4mo | $135,000 | $96 | 59 |
| 937 W Indianola Ave | 0.57mi | 4/1.0 (+1) | 1,598 (+4%) | 2mo | $95,500 | $60 | 58 |
| 980 W Laclede Ave | 0.70mi | 3/1.0 | 1,453 (-5%) | 2mo | $97,000 | $67 | 54 |
| 970 Bonnie Brae Ave | 0.64mi | 3/2.0 | 1,409 (-8%) | 2mo | $160,000 | $114 | 53 |
| 827 Winona Dr | 0.67mi | 4/1.5 (+1) | 1,606 (+5%) | 4mo | $140,000 | $87 | 53 |
| 123 Prestwick Dr | 0.63mi | 3/1.5 | 1,671 (+9%) | 8mo | $194,500 | $116 | 49 |
| 199 W Princeton Ave | 0.51mi | 4/2.0 (+1) | 1,728 (+12%) | 1mo | $85,000 | $49 | 47 |
| 401 Chicago Ave | 0.68mi | 4/1.0 (+1) | 1,400 (-9%) | 8mo | $80,000 | $57 | 40 |
Match score weights: distance 35% · size 25% · config 20% · recency 20%. Top-matched comps best support the ARV.
Projected returns pro-forma
-3.0% appreciation · 3.0% rent growth · sell at horizon
- IRR
- 34.9%
- Equity multiple
- 2.48×
- Total profit
- $26,252
- Equity at exit
- $9,468
- IRR
- 41.7%
- Equity multiple
- 4.93×
- Total profit
- $69,888
- Equity at exit
- $5,490
Cash invested: $17,780 (down + closing). Projections, not guarantees.
Landlord ↔ Tenant lean methodology
- Overall (STATE)
- 73 Landlord-Friendly
- State Ohio
- 73 Landlord-Friendly · R+6
- County
- — inherits STATE
- City
- — inherits STATE
ZIP-level market 44511
- Home prices YoY
- -12.6%
- Active inventory
- 73
- Price-to-rent
- 4.3×
Monthly cashflow live
- Estimated rent
- $1,226 medium interval (Pro) →
- Mortgage (P&I)
- −$333
- Tax from tax record
- −$35 /mo · $418/yr
- Insurance
- −$26
- HOA
- −$0
- Vacancy / Maint / Mgmt
- −$257
- Net cashflow
- $574
Break-even live
UW: 25.0% down · 7.5% · 30yr · 1.5% tax · 5.0% vac · 8.0% maint · 8.0% mgmt
Financing live
Cash to close
- Down payment
- $15,875
- Closing costs
- $1,905
- Reserves months
- —
- Total cash needed
- —
Loan-product check · same deal, 3 products live
Conventional
25% down · 7.5% · 30yr
- Down + closing
- —
- Monthly P&I
- —
- Monthly cashflow
- —
- DSCR
- —
- Eligible?
- —
Personal DTI + credit; lowest rate.
DSCR
20% down · 8.5% · 30yr
- Down + closing
- —
- Monthly P&I
- —
- Monthly cashflow
- —
- DSCR
- —
- Eligible?
- —
No personal income docs; deal must DSCR.
Hard money
10% down · 12.0% · 12mo
- Down + closing
- —
- Monthly P&I
- —
- Monthly cashflow
- —
- DSCR
- —
- Eligible?
- —
Short-term bridge; refi at stabilization.
Rent comps 4 comps
| Address | Beds | Baths | Sqft | Rent | $/sqft | DOM | Units | Dist |
|---|---|---|---|---|---|---|---|---|
| 236 Hilton Ave Youngstown, OH | 4.0 | 1.5 | 1488 | $1,195 | $0.80 | 21d | 1 | 1.07mi |
| 512 E Philadelphia Ave Unit 1 Youngstown, OH | 2.0 | 1.0 | 1200 | $899 | $0.75 | 21d | 1 | 1.33mi |
| 158 Beechwood Dr Youngstown, OH | 3.0 | 1.5 | 1438 | $1,100 | $0.76 | 13d | 1 | 1.41mi |
| 546 Breaden St Youngstown, OH | 3.0 | 1.0 | 1430 | $1,080 | $0.76 | 21d | 1 | 1.50mi |
Listing history 20 events
-
2026-06-19days on market $63,500 Active 157 DOM
-
2026-06-18days on market $63,500 Active 156 DOM
-
2026-06-17days on market $63,500 Active 155 DOM
-
2026-06-16days on market $63,500 Active 154 DOM
-
2026-06-15days on market $63,500 Active 153 DOM
-
2026-06-14days on market $63,500 Active 151 DOM
-
2026-06-13days on market $63,500 Active 150 DOM
-
2026-06-10days on market $63,500 Active 148 DOM
-
2026-06-09days on market $63,500 Active 147 DOM
-
2026-06-08days on market $63,500 Active 146 DOM
-
2026-06-07days on market $63,500 Active 145 DOM
-
2026-06-03days on market $63,500 Active 141 DOM
-
2026-06-02days on market $63,500 Active 140 DOM
-
2026-06-01days on market $63,500 Active 139 DOM
-
2026-05-31days on market $63,500 Active 138 DOM
-
2026-05-30days on market $63,500 Active 137 DOM
-
2026-02-03price $63,500
-
2026-01-13$72,500 Active
-
2004-08-18soldstatus $56,000
-
1993-09-02soldstatus $15,000
ⓘ Source: listings_history table (triggers on properties + properties_extension) + one-shot
backfill from property_details.listing_events for pre-trigger history.
Tax reassessment forecast OH · Partial reset (capped growth)
- Current annual tax
- $418 · $35/mo
- Projected year-2 tax
- $704 · $59/mo
- Expected delta
- +$286/yr (+$24/mo · 68.5%)
ⓘ Screening estimate from a state-policy table — verify with the county assessor before closing.
Climate risk First Street
- Flood 1/10 Low FEMA zone X (unshaded) · 0% chance over 30 yrs
- Wildfire 1/10 Low
- Heat 2/10 Low 7 d/yr ≥96°F today · 16 d/yr by 30 yrs out
- Wind 1/10 Low
- Air quality 2/10 Low 1 unhealthy d/yr today · 2 by 30 yrs out
Nearby sold comps map
Loading sold comps map…
Walkable amenities ~0.75 mi
Loading nearby amenities…
Taxation est. · year 1
- Rental income
- $14,706
- − Mortgage interest
- −$3,557
- − Property taxes
- −$418
- − Insurance
- −$318
- − Repairs & maintenance
- −$1,176
- − Management
- −$1,176
- − Depreciation
- −$1,847
- Taxable income
- $6,214
- Est. tax owed @ 24.0%
- −$1,491
- After-tax cash flow
- $5,395/yr
For passive investors: Depreciation is non-cash, so a rental often shows a tax loss while cash-flowing — sheltering income. Rental losses are passive: they offset passive income freely, and up to $25,000/yr can offset ordinary (W-2) income if you actively participate and your MAGI is under $100k (phasing out to $0 by $150k); unused losses carry forward. On sale, claimed depreciation is recaptured at up to 25%, and gains may owe capital-gains tax (a 1031 exchange can defer both). Figures are a year-1 estimate at your 24.0% rate — not tax advice; consult a CPA.
Schools (NCES district)
- District
- Youngstown City
- NCES district ID
- 3904516
- Math proficiency
- 8% ▼ -15.00%
- Reading proficiency
- 17% ▼ -10.00%
- Median HH income
- $25,257
- Composite
- 9.29/100
- National rank
- #9858
- State rank
- #649 of 656 in OH
Livability — Youngstown
- Score
- 81/100
- State rank
- #99
- US rank
- #1506
Category grades
Schools grade is shown separately in the Schools card above.
Census & demographics
- Census place
- Youngstown, OH
- County
- Mahoning County · 84,956 people
- City population
- 28,503
- Metro
- Youngstown-Warren-Boardman, OH-PA
- Population (ZIP)
- 18,909
- Household income
- $56,880
- Rent vs Own
- Severe rent burden
- 336.0
Population outlook (Mahoning County) Hauer SSP2
- Today (2025)
- 223,932 people
- By 2030
- 218,387 · -2.5%
- By 2040
- 205,367 · -8.3%
- By 2050
- 193,606 · -13.5%
- By 2075
- 173,694 · -22.4%
- By 2100
- 151,147 · -32.5%
Race, ethnicity, and origin ACS 2023
- Neighborhood character
- Majority White (64%)
- Race & ethnicity
- White 64% Black 23% Hispanic / Latino 8% Two or more races 7% Native American 1%
- Hispanic origin (detail)
- Mexican 2% Puerto Rican 4%
- Common ancestry
- Romanian 5% Lithuanian 1% Slovak 1%
- Foreign-born
- 1% · Canada
- Languages at home
- 96% English-only · Spanish 3%
Political lean MEDSL · Mahoning
- 2024 margin
- Lean R (+9.4) · D 44.9% · R 54.4%
- 2008→2024 swing
- -36.1pp toward R · 2008: 26.6pp · 2024: -9.4pp
- All cycles
- 2024: R+9.4 2020: R+1.9 2016: D+3.0 2012: D+27.7 2008: D+26.6
Not yet ingested
- Civics
- —
Market trends
- HPI YoY
- ▼ -40.81%
- Current HPI
- 283.9088
- Rent YoY
- —
- Metro
- Youngstown-Warren-Boardman, OH-PA
- State GDP YoY
- ▲ 1.98%
- F500 in state
- 48
Industry mix (Fortune 500 HQ in OH)
| Industry | F500 HQs | Revenue |
|---|---|---|
| Insurance | 3 | $145B |
|
||
| Industrial Machinery | 3 | $49B |
|
||
| Financial Services | 3 | $24B |
|
||
| Consumer Goods | 2 | $93B |
|
||
| Aerospace / Defense | 2 | $47B |
|
||
| Utilities | 2 | $33B |
|
||
Price history
+323.3% since first listed4 events — show timeline
- 2026-02-03 Price Changed $63,500 MLSNOW
- 2026-01-13 Listed $72,500 MLSNOW
- 2004-08-18 Sold (Public Records) $56,000 Public Records
- 1993-09-02 Sold (Public Records) $15,000 Public Records
Property tax history
-1.5%/yrLatest (2025): $418 · -11.8% YoY. Source: county tax records.
Cash-flow waterfall
monthlySold comps — $/sqft
last 12 mo · ≤1 miLoading sold comps…