66 Daisy Ln #66 · Weigelstown, PA
Flood risk 1/10 · Minimal
- FEMA flood zone
- X (unshaded)
- Chance of flooding over 30 yrs
- 0.0%
- Est. flood insurance / yr
- $507 – $1,088
Fire risk 1/10 · Minimal
- Est. fire insurance / yr
- $511 – $949
Heat risk 5/10 · Moderate
- Hot days now (above 103°F)
- 7 days/yr
- Hot days in 30 yrs
- 15 days/yr
Wind risk 4/10 · Minor
- Chance of severe wind over 30 yrs
- 9.0%
Air-quality risk 3/10 · Minor
- Unhealthy air days now
- 2 days/yr
- Unhealthy air days in 30 yrs
- 4 days/yr
Risk factors via First Street. Map © Google.
Why this score? — see what drove the C+ grade
The composite is a weighted blend of 9 inputs, each scored 0–100. Each bar is that input's sub-score; the figure is the points it added to the 100-point composite (weight × sub-score).
- Cash flow +29.3/30.0
- 1% rule +10.0/10.0
- DSCR +10.0/10.0
- Schools +4.0/10.0
- Livability +3.7/5.0
- Rent growth +2.5/5.0
- Condition / age +2.5/5.0
- ARV discount +0.0/15.0
- Appreciation +0.0/10.0
$74,900
🖨 Deal sheet 📄 Offer letter ✓ Due diligence
Listing remarks
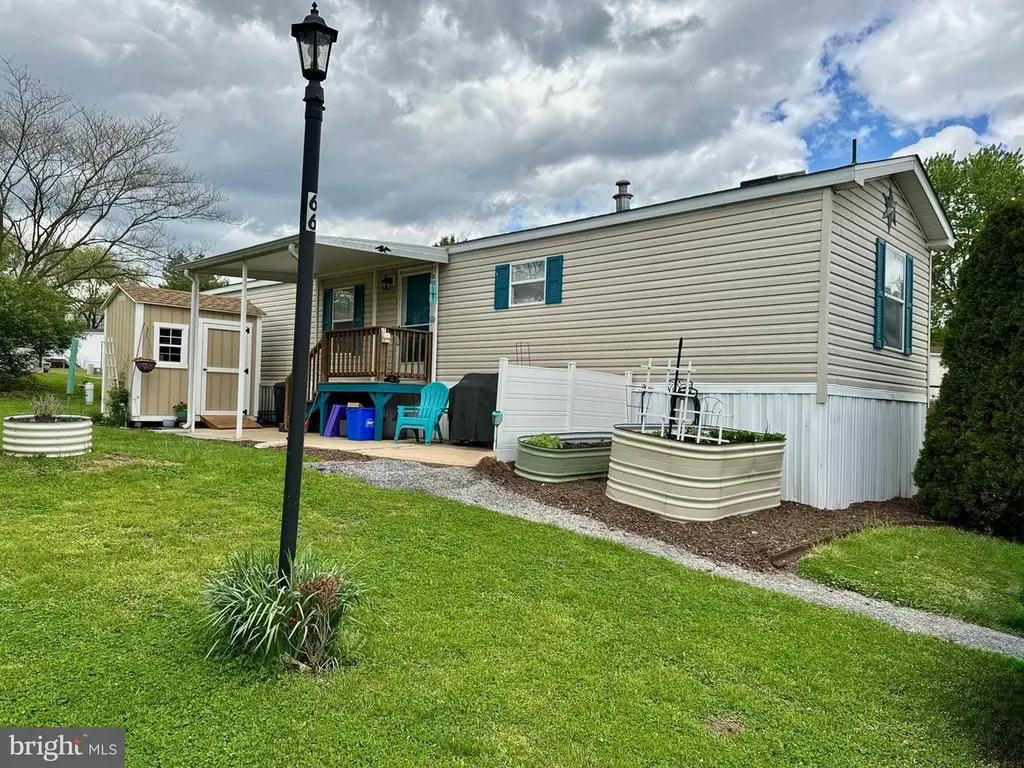
Welcome to 66 Daisy lane! This is the one you have been looking for. Situated on a nice corner lot, this extra large unit is very clean and well kept and ready for you to move right in . Special features include a new roof, new shed, new rear steps, newer dryer, and raised bed planters. Be sure to checkout the video and schedule your showing now so you can make 66 Daisy lane your new home !
Key facts
- 2 parking spots
- Built 2006
- Listed 6 days
Property features AI
Finance
- Other: Located in Meadowview Estates (private paved roads); Not in a federal flood zone
- HOA & community: Monthly association fee includes water, sewer, trash and snow removal
Exterior
- Parking: Paved driveway with space for 2 vehicles; Total of 2 garage/parking spaces
- Utilities: Public water; Public sewer
- Home design: Manufactured single-wide home; Single-story; Entry level main floor; Shingle roof; Facing direction not specified
- Construction: Vinyl siding; Pilings foundation; Built year per assessor (not specified here)
- Exterior features: Awning(s); Patio with roof; Shed; Corner lot/unit; Rented lot
Interior
- Kitchen: Dishwasher; Gas range/oven; Range hood; Refrigerator; Stainless steel appliances
- Bedrooms: Three bedrooms on the main level
- Flooring: Carpet; Laminate; Vinyl
- Bathrooms: Two full bathrooms on the main level
- Heating & cooling: 90% efficient forced air heating (natural gas); Central air conditioning (electric); Electric hot water
- Interior features: Skylights; Tub with shower; Breakfast area; Ceiling fans; Eat-in kitchen with table space; Pantry; Primary/master bathroom; Window treatments; Entry-level bedroom
- Laundry & utility: In-unit washer and electric dryer on the main floor
Neighborhood map
What this means for you Summary
Snapshot
- This is a 3-bed/2.0-bath manufactured listed at $75k.
Deal economics
- At list price, monthly cash flow is $263 ($3k/yr) — positive.
- The deal already cash-flows at list — no discount required.
- Meets the 1% rule at list price ($2k rent vs $75k).
- Cap rate 10.5% vs local median 3.4% in Weigelstown — top-decile yield for the area; either an underpriced asset or a hidden risk that comps aren't pricing in. Stress-test before assuming the spread holds.
Location & tenants
- Location reads 74/100 on livability (#527 in PA, #4,886 nationally) — a middle-class / working-renter tenant base. Strengths: cost of living A+, housing A+, health & safety A+; Watch: amenities F, commute F.
- Dover Area SD (suburban): math 39% / reading 54% proficiency, ranked #232 of 539 in PA (top 43%) — families likely to look elsewhere, expect single-tenant / working-renter base with shorter leases.
- Zoned schools: Dover Area Hs (math 72% / reading 15%, grade F, #213 of 437 statewide, top 49%, 1,016 students, 49% FRL) — zoned schools average 49% FRL vs 30% district-wide (20 pts higher); higher-poverty schools than district average — tighter screening recommended.
- Market conditions: 170 active listings in the ZIP; 5 comparable units currently listed for rent nearby; rentals leasing fast (median 14d on market — plan ~1-2 weeks tenant-placement turnaround); 1,328 units permitted in York County in 2024 (338 in 5+ unit buildings).
Forward outlook
- Local home prices are declining (-3.0%/yr); year-one equity from $518 of loan paydown is wiped out by about $2k of value loss. Plan a longer hold.
- At projected returns (-3.0% appreciation + 3.0% rent growth), your $21k cash investment doubles in ~8 years — after that, you're playing with house money.
Negotiation context
- Only 6 days on market — expect competitive offers; lowballing is unlikely to land.
- 2 sale attempts since 11y ago with the ask held roughly flat each time — persistent listings suggest the price (not the market) is what's stuck; bring a comps-based counter.
Risks & watch-outs
- Watch-outs: HOA is 37% of rent.
- Climate carrying-cost: extreme-heat days projected 7→15/yr by 2055 (HVAC capex compounding) — expect insurance premiums to compound above CPI over the hold.
Questions for the listing agent
- What does the HOA fee cover, when was the last increase, and are there any pending special assessments or reserve-fund shortfalls?
- Is there a deadline driving the sale (1031 exchange, divorce, estate, relocation)? That informs how much negotiation room exists.
- Schools are D-rated, which usually means shorter tenancies and higher turnover. Who's the typical renter profile here, and what's been the actual vacancy rate?
- What's the average days-on-market for RENTAL listings here right now (not sales)? A rising rental-DOM trend means longer vacancies and softer asking-rent achievability than the comps imply.
- What's the recent tenant-quality profile in this submarket — average credit score on applications, eviction rate, late-payment / NSF rate, and stable-employment percentage? A property-management company in the area should have these aggregated.
- How much new for-sale + rental construction is in the pipeline within 1–3 miles? Heavy new supply typically softens prices + rents 12–24 months out; constrained supply supports both.
Investment metrics
- 1% rule
- 2.49% ✓
- Cap rate
- 10.51%
- Cash-on-cash
- 15.07%
- DSCR
- 1.67
- GRM
- 3.3
CMA / ARV
- ARV (median comp)
- $51,823
- List price
- $74,900
- Delta
- 44.53%
- Verdict
- OVERPRICED
- Comps
- 2 within 2.0 mi
Projected returns pro-forma
-3.0% appreciation · 3.0% rent growth · sell at horizon
- IRR
- 6.2%
- Equity multiple
- 1.24×
- Total profit
- $5,093
- Equity at exit
- $11,168
- IRR
- 16.0%
- Equity multiple
- 2.33×
- Total profit
- $27,881
- Equity at exit
- $6,476
Cash invested: $20,972 (down + closing). Projections, not guarantees.
Landlord ↔ Tenant lean methodology
- Overall (STATE)
- 62 Landlord-Friendly
- State Pennsylvania
- 62 Landlord-Friendly · EVEN
- County
- — inherits STATE
- City
- — inherits STATE
ZIP-level market 17315
- Home prices YoY
- -28.5%
- Active inventory
- 170
- Price-to-rent
- 3.3×
Monthly cashflow live
- Estimated rent
- $1,866 high interval (Pro) →
- Mortgage (P&I)
- −$393
- Tax from tax record
- −$91 /mo · $1,097/yr
- Insurance
- −$31
- HOA
- −$695
- Vacancy / Maint / Mgmt
- −$392
- Net cashflow
- $263
Break-even live
UW: 25.0% down · 7.5% · 30yr · 1.5% tax · 5.0% vac · 8.0% maint · 8.0% mgmt
Financing live
Cash to close
- Down payment
- $18,725
- Closing costs
- $2,247
- Reserves months
- —
- Total cash needed
- —
Loan-product check · same deal, 3 products live
Conventional
25% down · 7.5% · 30yr
- Down + closing
- —
- Monthly P&I
- —
- Monthly cashflow
- —
- DSCR
- —
- Eligible?
- —
Personal DTI + credit; lowest rate.
DSCR
20% down · 8.5% · 30yr
- Down + closing
- —
- Monthly P&I
- —
- Monthly cashflow
- —
- DSCR
- —
- Eligible?
- —
No personal income docs; deal must DSCR.
Hard money
10% down · 12.0% · 12mo
- Down + closing
- —
- Monthly P&I
- —
- Monthly cashflow
- —
- DSCR
- —
- Eligible?
- —
Short-term bridge; refi at stabilization.
Rent comps 5 comps
| Address | Beds | Baths | Sqft | Rent | $/sqft | DOM | Units | Dist |
|---|---|---|---|---|---|---|---|---|
| 3127 Galaxy Rd Dover, PA | 2.0 | 1.5 | 1200 | $1,685 | $1.40 | 13d | 1 | 0.36mi |
| 2670 Springhouse Bnd Dover, PA | 1.0–2.0 | 1.0–2.0 | 991 | $1,765 | $1.78 | 13d | 17 | 0.51mi |
| 3712 Castle Dr Dover, PA | 3.0 | 2.5 | 1450 | $1,895 | $1.31 | 43d | 1 | 0.72mi |
| 2619 Emig Mill Rd Dover, PA | 4.0 | 2.0 | 1156 | $2,100 | $1.82 | 13d | 1 | 0.73mi |
| 3807 Castle Dr Dover, PA | 3.0 | 2.5 | 1402 | $2,150 | $1.53 | 20d | 1 | 0.74mi |
HOA detail
- Monthly dues
- $695 · $8,340/yr
Listing history 4 events
-
2026-05-10historical Active Under Contract 396-char remark
-
2026-05-04$74,900 Active 396-char remark
-
2015-07-06historical
-
2015-01-06$38,500
ⓘ Source: listings_history table (triggers on properties + properties_extension) + one-shot
backfill from property_details.listing_events for pre-trigger history.
Tax reassessment forecast PA · Partial reset (capped growth)
- Current annual tax
- $1,097 · $91/mo
- Projected year-2 tax
- $1,140 · $95/mo
- Expected delta
- +$43/yr (+$4/mo · 3.9%)
ⓘ Screening estimate from a state-policy table — verify with the county assessor before closing.
Climate risk First Street
- Flood 1/10 Low FEMA zone X (unshaded) · 0% chance over 30 yrs
- Wildfire 1/10 Low
- Heat 5/10 Major 7 d/yr ≥103°F today · 15 d/yr by 30 yrs out
- Wind 4/10 Moderate 9% chance of damaging wind over 30 yrs
- Air quality 3/10 Moderate 2 unhealthy d/yr today · 4 by 30 yrs out
Nearby sold comps map
Loading sold comps map…
Walkable amenities ~0.75 mi
Loading nearby amenities…
Taxation est. · year 1
- Rental income
- $22,387
- − Mortgage interest
- −$4,196
- − Property taxes
- −$1,097
- − Insurance
- −$374
- − Repairs & maintenance
- −$1,791
- − Management
- −$1,791
- − HOA
- −$8,340
- − Depreciation
- −$2,179
- Taxable income
- $2,619
- Est. tax owed @ 24.0%
- −$629
- After-tax cash flow
- $2,532/yr
For passive investors: Depreciation is non-cash, so a rental often shows a tax loss while cash-flowing — sheltering income. Rental losses are passive: they offset passive income freely, and up to $25,000/yr can offset ordinary (W-2) income if you actively participate and your MAGI is under $100k (phasing out to $0 by $150k); unused losses carry forward. On sale, claimed depreciation is recaptured at up to 25%, and gains may owe capital-gains tax (a 1031 exchange can defer both). Figures are a year-1 estimate at your 24.0% rate — not tax advice; consult a CPA.
Schools (NCES district)
- District
- Dover Area SD
- NCES district ID
- 4207680
- Math proficiency
- 39% ▼ -12.00%
- Reading proficiency
- 54% ▼ -9.00%
- Median HH income
- $56,418
- Composite
- 40.44/100
- National rank
- #3725
- State rank
- #232 of 539 in PA
Livability — Weigelstown
- Score
- 74/100
- State rank
- #527
- US rank
- #4886
Category grades
Schools grade is shown separately in the Schools card above.
Census & demographics
- Census place
- Weigelstown, PA
- Population (ZIP)
- 26,434
Population outlook (York County) Hauer SSP2
- Today (2025)
- 454,205 people
- By 2030
- 457,407 · +0.7%
- By 2040
- 457,529 · +0.7%
- By 2050
- 448,261 · -1.3%
- By 2075
- 427,388 · -5.9%
- By 2100
- 384,218 · -15.4%
Race, ethnicity, and origin ACS 2023
- Neighborhood character
- Predominantly White (88%)
- Race & ethnicity
- White 88% Two or more races 5% Hispanic / Latino 4% Black 3% Asian 1%
- Common ancestry
- Romanian 3% Iranian 2% Lithuanian 1%
- Foreign-born
- 3% · Canada
- Languages at home
- 95% English-only · Spanish 2% Other Indo-European 1%
Political lean MEDSL · York
- 2024 margin
- Strong R (+25.3) · D 36.9% · R 62.1%
- 2008→2024 swing
- -11.7pp toward R · 2008: -13.6pp · 2024: -25.3pp
- All cycles
- 2024: R+25.3 2020: R+24.6 2016: R+29.3 2012: R+21.2 2008: R+13.6
Not yet ingested
- Civics
- —
Market trends
- HPI YoY
- ▼ -98.65%
- Current HPI
- 247.2403
- Rent YoY
- —
- Metro
- —
- State GDP YoY
- ▲ 1.68%
- F500 in state
- 34
Industry mix (Fortune 500 HQ in PA)
| Industry | F500 HQs | Revenue |
|---|---|---|
| Healthcare | 2 | $309B |
|
||
| Insurance | 2 | $27B |
|
||
| Telecommunications / Media | 1 | $124B |
|
||
| Industrial Distribution | 1 | $22B |
|
||
| Financial Services | 1 | $20B |
|
||
| Chemicals / Materials | 1 | $18B |
|
||
Price history
+94.5% since first listed6 events — show timeline
- 2026-06-09 Sold (MLS) $74,900 BRIGHT MLS
- 2026-05-19 Pending — BRIGHT MLS
- 2026-05-10 Contingent — BRIGHT MLS
- 2026-05-04 Listed $74,900 BRIGHT MLS
- 2015-07-06 Listing Removed — BRIGHT MLS
- 2015-01-06 Listed $38,500 BRIGHT MLS
Property tax history
+1.8%/yrLatest (2026): $1,097 · +2.0% YoY. Source: county tax records.
Cash-flow waterfall
monthlySold comps — $/sqft
last 12 mo · ≤1 miLoading sold comps…