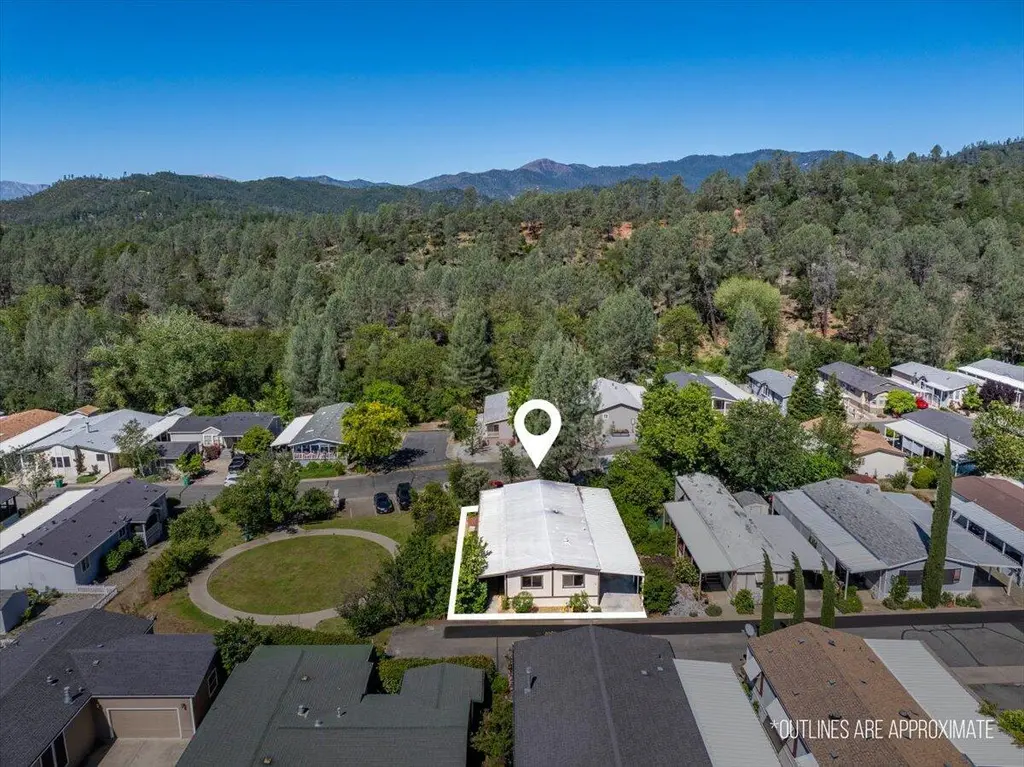
3304 Shasta Dam Blvd Spc 73 · Shasta Lake, CA
Flood risk 6/10 · Moderate
- FEMA flood zone
- X (unshaded)
- Chance of flooding over 30 yrs
- 0.69%
- Est. flood insurance / yr
- $507 – $1,088
Fire risk 7/10 · Major
- Est. fire insurance / yr
- $659 – $1,223
Heat risk 8/10 · Major
- Hot days now (above 105°F)
- 7 days/yr
- Hot days in 30 yrs
- 17 days/yr
Wind risk 1/10 · Minimal
- Chance of severe wind over 30 yrs
- —
Air-quality risk 10/10 · Severe
- Unhealthy air days now
- 44 days/yr
- Unhealthy air days in 30 yrs
- 46 days/yr
Risk factors via First Street. Map © Google.
Why this score? — see what drove the B+ grade
The composite is a weighted blend of 9 inputs, each scored 0–100. Each bar is that input's sub-score; the figure is the points it added to the 100-point composite (weight × sub-score).
- Cash flow +30.0/30.0
- ARV discount +15.0/15.0
- 1% rule +10.0/10.0
- DSCR +10.0/10.0
- Livability +3.2/5.0
- Rent growth +2.5/5.0
- Schools +2.5/10.0
- Condition / age +2.5/5.0
- Appreciation +0.0/10.0
$57,500
🖨 Deal sheet 📄 Offer letter ✓ Due diligence
Listing remarks MLS
Brand new remodel in Shasta County's Nicest 55+ community! You'll love the location and privacy of this home! It's right in front of Circle Park (a grassy park) 3 bedrooms, 2 bathrooms, 1,536 sf. Park has a refinished pool, beautiful pond with wildlife, nature trail, & grassy parks where dear graze. Minutes from Shasta Lake! Updated homes like this are rare! Hurry! New kitchen cabinets, sink and counters! New flooring! New foam roof! New HVAC! New deck on the left side that looks out onto Circle Park (a grassy common area) New stairs on the drive side New paint inside and out! Rent 685.00 Sewer 72.35 Water 31.08 base rate plus 2.58 per unit of water used (a unit is approx 747 gallons)
Key facts
- Split floor plan
- Swimming pool
- Updated kitchen
Tags
Property features AI
Finance
- Other: Directions: Into park, make first left. Follow until road Y's, stay right all the way to the end. Home on right. Cross street: Lakeview
- HOA & community: Located in Twin Lakes Estate (manufactured home park)
Exterior
- Parking: Carport with 3 spaces
- Utilities: Public water
- Home design: Manufactured home located in a park; Mobile home; Model: United States; Entry located at park lot (space in park)
- Construction: Wood siding; Pillar/post/pier foundation; Composition roof; Built as a manufactured/mobile home
- Exterior features: Deck; Level topography; Asphalt road access; Has a view
Interior
- Kitchen: Dishwasher; Range; Oven
- Flooring: Vinyl; Carpet
- Heating & cooling: Central air conditioning; Forced air heating
- Interior features: Dishwasher; Range; Oven; Vinyl and carpet flooring; No fireplace
Neighborhood map
What this means for you Summary
Snapshot
- This is a 3-bed/2.0-bath manufactured listed at $58k.
Deal economics
- At list price, monthly cash flow is $1k ($13k/yr) — positive.
- The deal already cash-flows at list — no discount required.
- Meets the 1% rule at list price ($2k rent vs $58k).
- Recommended offer: $56k (3.0% below list) — sets the bar for market timing.
- Cap rate 28.4% vs local median 3.8% in Shasta Lake — top-decile yield for the area; either an underpriced asset or a hidden risk that comps aren't pricing in. Stress-test before assuming the spread holds.
Location & tenants
- Location reads 65/100 on livability (#399 in CA) — a middle-class / working-renter tenant base. Strengths: housing A+, health & safety A+, commute A; Watch: employment C-, schools D-, crime F.
- Gateway Unified (suburban): math 25% / reading 35% proficiency, ranked #355 of 517 in CA (top 69%) — families likely to look elsewhere, expect single-tenant / working-renter base with shorter leases.
- Market conditions: 93 active listings in the ZIP; 1 comparable units currently listed for rent nearby; 246 units permitted in Shasta County in 2024 (0 in 5+ unit buildings).
- This rent runs 33% of the median local income ($67k/yr) — at the standard rent-burdened threshold; future hikes will face affordability resistance.
Forward outlook
- Local home prices are declining (-3.0%/yr); year-one equity from $398 of loan paydown is wiped out by about $2k of value loss. Plan a longer hold.
- Shasta County population projected to shrink 9% by 2050 — rents likely to lag national; underwrite the cash flow, not the appreciation.
- At projected returns (-3.0% appreciation + 3.0% rent growth), your $16k cash investment doubles in ~2 years — after that, you're playing with house money.
Negotiation context
- It's been on market 31 days — a 3% lower offer ($56k) is reasonable based on typical stale-listing flexibility.
- 2 sale attempts since 5y ago with the ask held roughly flat each time — persistent listings suggest the price (not the market) is what's stuck; bring a comps-based counter.
Risks & watch-outs
- Climate carrying-cost: major flood risk; major wildfire risk; extreme-heat days projected 7→17/yr by 2055 (HVAC capex compounding) — expect insurance premiums to compound above CPI over the hold.
Questions for the listing agent
- It's been on market 31 days. Have you received any prior offers? Is the seller open to a 3% concession, seller financing, or rate buy-down credit?
- Built in 1978 — when were the roof, HVAC, electrical panel, plumbing, and water heater last replaced?
- Is there a deadline driving the sale (1031 exchange, divorce, estate, relocation)? That informs how much negotiation room exists.
- Schools are D-rated, which usually means shorter tenancies and higher turnover. Who's the typical renter profile here, and what's been the actual vacancy rate?
- Crime grade is F in this area — have there been break-ins, vandalism, or insurance claims at this property in the last 3 years? What carrier currently insures it and at what premium?
- What's the average days-on-market for RENTAL listings here right now (not sales)? A rising rental-DOM trend means longer vacancies and softer asking-rent achievability than the comps imply.
- What's the recent tenant-quality profile in this submarket — average credit score on applications, eviction rate, late-payment / NSF rate, and stable-employment percentage? A property-management company in the area should have these aggregated.
- How much new for-sale + rental construction is in the pipeline within 1–3 miles? Heavy new supply typically softens prices + rents 12–24 months out; constrained supply supports both.
Investment metrics
- 1% rule
- 3.21% ✓
- Cap rate
- 28.45%
- Cash-on-cash
- 79.13%
- DSCR
- 4.52
- GRM
- 2.6
CMA / ARV
- ARV (on-the-fly)
- $74,664
- Comps found
- 12
Show comp detail 12 sales within ~0.75 mi
| Address | Dist | Beds/Ba | Sqft | Sold | Price | $/sf | Match |
|---|---|---|---|---|---|---|---|
| 3304 Shasta Dam Blvd Spc 60 | 0.13mi | 3/2.0 | 1,440 (-2%) | 2mo | $76,500 | $53 | 90 |
| 3304 Shasta Dam Blvd Spc 124 | 0.13mi | 3/2.0 | 1,508 (+3%) | 2mo | $148,000 | $98 | 87 |
| 3304 Shasta Dam Blvd #96 | 0.07mi | 2/2.0 (-1) | 1,536 (+5%) | 3mo | $69,000 | $45 | 81 |
| 3304 Shasta Dam Blvd #147 | 0.05mi | 3/2.0 | 1,368 (-7%) | 8mo | $103,500 | $76 | 80 |
| 3304 Shasta Dam Blvd #65 | 0.12mi | 2/2.0 (-1) | 1,400 (-4%) | 3mo | $46,000 | $33 | 80 |
| 3304 Shasta Dam Blvd #136 | 0.09mi | 3/2.0 | 1,326 (-9%) | 1mo | $97,000 | $73 | 80 |
| 3304 Shasta Dam Blvd #67 | 0.05mi | 3/2.0 | 1,344 (-8%) | 6mo | $44,000 | $33 | 78 |
| 3304 Shasta Dam Blvd #131 | 0.11mi | 3/2.0 | 1,560 (+7%) | 7mo | $94,000 | $60 | 78 |
| 3304 Shasta Dam Blvd #29 | 0.19mi | 2/2.0 (-1) | 1,440 (-2%) | 8mo | $40,000 | $28 | 77 |
| 3304 Shasta Dam Blvd Spc 39 | 0.27mi | 2/2.0 (-1) | 1,440 (-2%) | 7mo | $72,500 | $50 | 74 |
| 3304 Shasta Dam Blvd #52 | 0.20mi | 2/2.0 (-1) | 1,248 (-15%) | 2mo | $63,500 | $51 | 59 |
| 3304 Shasta Dam Blvd #8 | 0.29mi | 2/2.0 (-1) | 1,248 (-15%) | 12mo | $52,000 | $42 | 47 |
Match score weights: distance 35% · size 25% · config 20% · recency 20%. Top-matched comps best support the ARV.
Projected returns pro-forma
-3.0% appreciation · 3.0% rent growth · sell at horizon
- IRR
- 79.2%
- Equity multiple
- 4.62×
- Total profit
- $58,325
- Equity at exit
- $8,573
- IRR
- 82.7%
- Equity multiple
- 9.57×
- Total profit
- $137,966
- Equity at exit
- $4,972
Cash invested: $16,100 (down + closing). Projections, not guarantees.
Landlord ↔ Tenant lean methodology
- Overall (STATE)
- 18 Strongly Tenant-Friendly
- State California
- 18 Strongly Tenant-Friendly · D+13
- County
- — inherits STATE
- City
- — inherits STATE
ZIP-level market 96019
- Active inventory
- 93
- Price-to-rent
- 2.6×
Monthly cashflow live
- Estimated rent
- $1,847 medium interval (Pro) →
- Mortgage (P&I)
- −$302
- Tax est. 1.5%
- −$72 /mo · $862/yr
- Insurance
- −$24
- HOA
- −$0
- Vacancy / Maint / Mgmt
- −$388
- Net cashflow
- $1,062
Break-even live
UW: 25.0% down · 7.5% · 30yr · 1.5% tax · 5.0% vac · 8.0% maint · 8.0% mgmt
Financing live
Cash to close
- Down payment
- $14,375
- Closing costs
- $1,725
- Reserves months
- —
- Total cash needed
- —
Loan-product check · same deal, 3 products live
Conventional
25% down · 7.5% · 30yr
- Down + closing
- —
- Monthly P&I
- —
- Monthly cashflow
- —
- DSCR
- —
- Eligible?
- —
Personal DTI + credit; lowest rate.
DSCR
20% down · 8.5% · 30yr
- Down + closing
- —
- Monthly P&I
- —
- Monthly cashflow
- —
- DSCR
- —
- Eligible?
- —
No personal income docs; deal must DSCR.
Hard money
10% down · 12.0% · 12mo
- Down + closing
- —
- Monthly P&I
- —
- Monthly cashflow
- —
- DSCR
- —
- Eligible?
- —
Short-term bridge; refi at stabilization.
Rent comps 1 comps
| Address | Beds | Baths | Sqft | Rent | $/sqft | DOM | Units | Dist |
|---|---|---|---|---|---|---|---|---|
| 13710 Pit St Shasta Lake, CA | 2.0 | 1.0 | 1165 | $1,475 | $1.27 | 44d | 1 | 0.56mi |
Listing history 19 events
-
2026-06-19days on market $57,500 Active 31 DOM
-
2026-06-18days on market $57,500 Active 30 DOM
-
2026-06-17days on market $57,500 Active 29 DOM
-
2026-06-16pricedays on market $57,500 Active 28 DOM
-
2026-06-15days on market $58,500 Active 27 DOM
-
2026-06-14days on market $58,500 Active 25 DOM
-
2026-06-13days on market $58,500 Active 24 DOM
-
2026-06-10days on market $58,500 Active 22 DOM
-
2026-06-09days on market $58,500 Active 21 DOM
-
2026-06-08days on market $58,500 Active 20 DOM
-
2026-06-07days on market $58,500 Active 19 DOM
-
2026-06-03days on market $58,500 Active 15 DOM
-
2026-06-02days on market $58,500 Active 14 DOM
-
2026-06-01days on market $58,500 Active 13 DOM
-
2026-05-31days on market $58,500 Active 12 DOM
-
2026-05-30days on market $58,500 Active 11 DOM
-
2026-05-19$58,500 Active
-
2021-09-17soldstatus $54,800 708-char remark
Show marketing remark (708 chars)
Brand new remodel in Shasta County's Nicest 55+ community! You'll love the location and privacy of this home! It's right in front of Circle Park (a grassy park) 3 bedrooms, 2 bathrooms, 1,536 sf. Park has a refinished pool, beautiful pond with wildlife, nature trail, & grassy parks where dear graze. Minutes from Shasta Lake! Updated homes like this are rare! Hurry! New kitchen cabinets, sink and counters! New flooring! New foam roof! New HVAC! New deck on the left side that looks out onto Circle Park (a grassy common area) New stairs on the drive side New paint inside and out! Rent 685.00 Sewer 72.35 Water 31.08 base rate plus 2.58 per unit of water used (a unit is approx 747 gallons)
-
2021-08-24$58,000 708-char remark
Show marketing remark (708 chars)
Brand new remodel in Shasta County's Nicest 55+ community! You'll love the location and privacy of this home! It's right in front of Circle Park (a grassy park) 3 bedrooms, 2 bathrooms, 1,536 sf. Park has a refinished pool, beautiful pond with wildlife, nature trail, & grassy parks where dear graze. Minutes from Shasta Lake! Updated homes like this are rare! Hurry! New kitchen cabinets, sink and counters! New flooring! New foam roof! New HVAC! New deck on the left side that looks out onto Circle Park (a grassy common area) New stairs on the drive side New paint inside and out! Rent 685.00 Sewer 72.35 Water 31.08 base rate plus 2.58 per unit of water used (a unit is approx 747 gallons)
ⓘ Source: listings_history table (triggers on properties + properties_extension) + one-shot
backfill from property_details.listing_events for pre-trigger history.
Climate risk First Street
- Flood 6/10 Major FEMA zone X (unshaded) · 69% chance over 30 yrs
- Wildfire 7/10 Severe
- Heat 8/10 Severe 7 d/yr ≥105°F today · 17 d/yr by 30 yrs out
- Wind 1/10 Low
- Air quality 10/10 Extreme 44 unhealthy d/yr today · 46 by 30 yrs out
Nearby sold comps map
Loading sold comps map…
Walkable amenities ~0.75 mi
Loading nearby amenities…
Taxation est. · year 1
- Rental income
- $22,162
- − Mortgage interest
- −$3,221
- − Property taxes
- −$862
- − Insurance
- −$288
- − Repairs & maintenance
- −$1,773
- − Management
- −$1,773
- − Depreciation
- −$1,673
- Taxable income
- $12,572
- Est. tax owed @ 24.0%
- −$3,017
- After-tax cash flow
- $9,722/yr
For passive investors: Depreciation is non-cash, so a rental often shows a tax loss while cash-flowing — sheltering income. Rental losses are passive: they offset passive income freely, and up to $25,000/yr can offset ordinary (W-2) income if you actively participate and your MAGI is under $100k (phasing out to $0 by $150k); unused losses carry forward. On sale, claimed depreciation is recaptured at up to 25%, and gains may owe capital-gains tax (a 1031 exchange can defer both). Figures are a year-1 estimate at your 24.0% rate — not tax advice; consult a CPA.
Schools (NCES district)
- District
- Gateway Unified
- NCES district ID
- 0614950
- Math proficiency
- 25% ▼ -5.00%
- Reading proficiency
- 35% ▲ 2.00%
- Median HH income
- $41,888
- Composite
- 25.39/100
- National rank
- #7465
- State rank
- #355 of 517 in CA
Livability — Shasta Lake
- Score
- 65/100
- State rank
- #399
- US rank
- #13546
Category grades
Schools grade is shown separately in the Schools card above.
Census & demographics
- Census place
- Shasta Lake, CA
- County
- Shasta County · 147,641 people
- City population
- 10,350
- Metro
- Redding, CA
- Population (ZIP)
- 10,350
- Household income
- $67,446
- Rent vs Own
- Severe rent burden
- 260.0
Population outlook (Shasta County) Hauer SSP2
- Today (2025)
- 179,231 people
- By 2030
- 176,953 · -1.3%
- By 2040
- 169,982 · -5.2%
- By 2050
- 162,547 · -9.3%
- By 2075
- 145,649 · -18.7%
- By 2100
- 123,025 · -31.4%
Race, ethnicity, and origin ACS 2023
- Neighborhood character
- Predominantly White (77%)
- Race & ethnicity
- White 77% Two or more races 12% Hispanic / Latino 9% Asian 4% Native American 2%
- Hispanic origin (detail)
- Mexican 8%
- Common ancestry
- Russian 4% Romanian 4% Italian 4%
- Foreign-born
- 2% · Canada
- Languages at home
- 94% English-only · Spanish 4% Other Asian/Pacific 1%
Political lean MEDSL · Shasta
- 2024 margin
- Solid R (+36.5) · D 30.5% · R 67.0% · Other 2.5%
- 2008→2024 swing
- -10.7pp toward R · 2008: -25.8pp · 2024: -36.5pp
- All cycles
- 2024: R+36.5 2020: R+33.1 2016: R+37.4 2012: R+30.3 2008: R+25.8
Not yet ingested
- Civics
- —
Market trends
- HPI YoY
- ▼ -194.66%
- Current HPI
- 170.6085
- Rent YoY
- —
- Metro
- Redding, CA
- State GDP YoY
- ▲ 3.21%
- F500 in state
- 116
Industry mix (Fortune 500 HQ in CA)
| Industry | F500 HQs | Revenue |
|---|---|---|
| Technology | 27 | $1,492B |
|
||
| Financial Services | 3 | $174B |
|
||
| Retail | 3 | $44B |
|
||
| Insurance | 3 | $26B |
|
||
| Media / Entertainment | 2 | $115B |
|
||
| Pharmaceuticals / Biotech | 2 | $62B |
|
||
Price history
+0.9% since first listed3 events — show timeline
- 2026-05-19 Listed $58,500 SAOR
- 2021-09-17 Sold (MLS) $54,800 SAOR
- 2021-08-24 Listed $58,000 SAOR
Property tax history
+1.5%/yrLatest (2020): $55 · +1.2% YoY. Source: county tax records.
Cash-flow waterfall
monthlySold comps — $/sqft
last 12 mo · ≤1 miLoading sold comps…