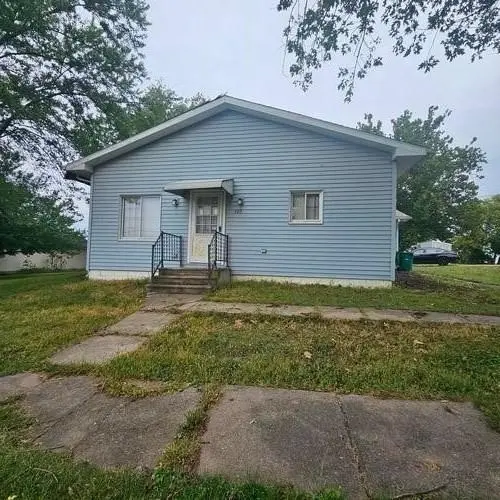
405 E Broadway St · What Cheer, IA
Flood risk 1/10 · Minimal
- FEMA flood zone
- X (unshaded)
- Chance of flooding over 30 yrs
- 0.0%
- Est. flood insurance / yr
- $473 – $860
Fire risk 2/10 · Minimal
- Est. fire insurance / yr
- $902 – $1,676
Heat risk 3/10 · Minor
- Hot days now (above 104°F)
- 7 days/yr
- Hot days in 30 yrs
- 15 days/yr
Wind risk 2/10 · Minimal
- Chance of severe wind over 30 yrs
- —
Air-quality risk 2/10 · Minimal
- Unhealthy air days now
- 1 days/yr
- Unhealthy air days in 30 yrs
- 1 days/yr
Risk factors via First Street. Map © Google.
Why this score? — see what drove the C+ grade
The composite is a weighted blend of 9 inputs, each scored 0–100. Each bar is that input's sub-score; the figure is the points it added to the 100-point composite (weight × sub-score).
- Cash flow +15.0/30.0
- ARV discount +15.0/15.0
- Appreciation +7.8/10.0
- Schools +5.2/10.0
- 1% rule +5.0/10.0
- DSCR +5.0/10.0
- Livability +2.9/5.0
- Rent growth +2.5/5.0
- Condition / age +2.5/5.0
$18,830
🖨 Deal sheet (PDF) 📄 Offer letter ✓ Due diligence
Listing remarks
Put on your imagination hat on and check out the potential this home could have. On a nice size lot this 2 bed 1 bath ranch could be your next chapter. The oversized-2 car garage allows ample room for cars, toys and hobbies. Call your favorite agent today to take a look. Please visit MyNextBid.com for additional details or to submit an offer.
Key facts
- 2 garage spots
- Built 1916
- Listed 22 days
Property features AI
Exterior
- Parking: Attached two-car garage
- Utilities: Public water; Public sewer
- Home design: Single-story home; Vinyl siding exterior; Asphalt shingle roof
- Construction: Vinyl siding construction; Asphalt shingle roof
- Exterior features: Rectangular lot; Zoned residential
Interior
- Bedrooms: Two main-level bedrooms
- Bathrooms: One full bathroom
- Heating & cooling: Central air; Forced air heating (natural gas)
- Interior features: Central air conditioning; Forced air heating (natural gas)
Neighborhood map
What this means for you Summary
Snapshot
- This is a 2-bed/1.0-bath single-family listed at $19k.
Deal economics
- At list price, monthly cash flow is $663 ($8k/yr) — positive.
- The deal already cash-flows at list — no discount required.
- Meets the 1% rule at list price ($1k rent vs $19k).
- Recommended offer: $19k (1.5% below list) — sets the bar for market timing.
Location & tenants
- Location reads 58/100 on livability (#892 in IA) — a working-class tenant base; expect higher turnover. Strengths: cost of living A+, housing A; Watch: crime D+, health & safety D, schools F.
- Tri-County Community School District (rural): math 60% / reading 60% proficiency, ranked #289 of 330 in IA (top 88%) — acceptable for families but not a draw, mixed tenant base, ~2y average lease.
- Market conditions: 5 active listings in the ZIP; 1 units permitted in Keokuk County in 2024 (0 in 5+ unit buildings).
Forward outlook
- In year one you build about $1k of equity ($130 loan paydown + $1k appreciation (5.6% local appreciation)).
- Keokuk County population projected at -24% by 2050 — secular population decline; favor cash flow + early exit over multi-decade hold.
- At projected returns (5.6% appreciation + 3.0% rent growth), your $5k cash investment doubles in ~1 year — after that, you're playing with house money.
Negotiation context
- It's been on market 22 days — a 2% lower offer ($19k) is reasonable based on typical stale-listing flexibility.
- 2 sale attempts; this cycle's ask has dropped $1k (5%) from the opening price — seller is motivated, your offer sets the floor, not the list.
Risks & watch-outs
- Watch-outs: property tax is 2.9% of price; built in 1916 — expect roof / HVAC / electrical / plumbing capex.
Questions for the listing agent
- Built in 1916 — when were the roof, HVAC, electrical panel, plumbing, and water heater last replaced?
- Property tax is high relative to price — has the assessment been appealed recently, and will the sale trigger a re-assessment?
- Is there a deadline driving the sale (1031 exchange, divorce, estate, relocation)? That informs how much negotiation room exists.
- Schools are F-rated, which usually means shorter tenancies and higher turnover. Who's the typical renter profile here, and what's been the actual vacancy rate?
- Crime grade is D in this area — have there been break-ins, vandalism, or insurance claims at this property in the last 3 years? What carrier currently insures it and at what premium?
- What's the average days-on-market for RENTAL listings here right now (not sales)? A rising rental-DOM trend means longer vacancies and softer asking-rent achievability than the comps imply.
- What's the recent tenant-quality profile in this submarket — average credit score on applications, eviction rate, late-payment / NSF rate, and stable-employment percentage? A property-management company in the area should have these aggregated.
- How much new for-sale + rental construction is in the pipeline within 1–3 miles? Heavy new supply typically softens prices + rents 12–24 months out; constrained supply supports both.
Investment metrics
- 1% rule
- 5.48% ✓
- Cap rate
- 48.55%
- Cash-on-cash
- 150.91%
- DSCR
- 7.71
- GRM
- 1.5
CMA / ARV
- ARV (median comp)
- $36,735
- List price
- $18,830
- Delta
- -43.05%
- Verdict
- UNDERPRICED
- Comps
- 7 within 1.0 mi
Show comp detail 4 sales within ~0.75 mi
| Address | Dist | Beds/Ba | Sqft | Sold | Price | $/sf | Match |
|---|---|---|---|---|---|---|---|
| 106 E Briney St | 0.19mi | 2/1.0 | 1,336 (+11%) | 15mo | $88,000 | $66 | 60 |
| 205 W Briney St | 0.31mi | 3/1.5 (+1) | 1,320 (+10%) | 9mo | $12,000 | $9 | 54 |
| 203 W Briney St | 0.30mi | 3/1.5 (+1) | 1,138 (-5%) | 22mo | $36,000 | $32 | 52 |
| 707 N Barnes St | 0.55mi | 3/1.0 (+1) | 1,056 (-12%) | 9mo | $29,000 | $27 | 42 |
Match score weights: distance 35% · size 25% · config 20% · recency 20%. Top-matched comps best support the ARV.
Projected returns pro-forma
5.64% appreciation · 3.0% rent growth · sell at horizon
- IRR
- —
- Equity multiple
- 9.97×
- Total profit
- $47,296
- Equity at exit
- $11,414
- IRR
- —
- Equity multiple
- 21.15×
- Total profit
- $106,225
- Equity at exit
- $20,342
Cash invested: $5,272 (down + closing). Projections, not guarantees.
Landlord ↔ Tenant lean methodology
- Overall (STATE)
- 83 Strongly Landlord-Friendly
- State Iowa
- 83 Strongly Landlord-Friendly · R+6
- County
- — inherits STATE
- City
- — inherits STATE
ZIP-level market 50268
- Home prices YoY
- 5.9%
- Active inventory
- 5
- Price-to-rent
- 1.5×
Monthly cashflow live
- Estimated rent
- $1,031 medium interval (Pro) →
- Mortgage (P&I)
- −$99
- Tax from tax record
- −$45 /mo · $542/yr
- Insurance
- −$8
- HOA
- −$0
- Vacancy / Maint / Mgmt
- −$217
- Net cashflow
- $663
Break-even live
Sensitivity live
| Price | -10% $674 | -5% $668 | +0% $663 | +5% $658 | +10% $652 |
|---|---|---|---|---|---|
| Rent | -10% $582 | -5% $622 | +0% $663 | +5% $704 | +10% $745 |
| Rate | -1.0pp $673 | -0.5pp $668 | base $663 | +0.5pp $658 | +1.0pp $653 |
UW: 25.0% down · 7.5% · 30yr · 1.5% tax · 5.0% vac · 8.0% maint · 8.0% mgmt
Financing live
Cash to close
- Down payment
- $4,708
- Closing costs
- $565
- Reserves months
- —
- Total cash needed
- —
Loan-product check · same deal, 3 products live
Conventional
25% down · 7.5% · 30yr
- Down + closing
- —
- Monthly P&I
- —
- Monthly cashflow
- —
- DSCR
- —
- Eligible?
- —
Personal DTI + credit; lowest rate.
DSCR
20% down · 8.5% · 30yr
- Down + closing
- —
- Monthly P&I
- —
- Monthly cashflow
- —
- DSCR
- —
- Eligible?
- —
No personal income docs; deal must DSCR.
Hard money
10% down · 12.0% · 12mo
- Down + closing
- —
- Monthly P&I
- —
- Monthly cashflow
- —
- DSCR
- —
- Eligible?
- —
Short-term bridge; refi at stabilization.
Listing history 17 events
-
2026-06-21days on market $18,830 Active 22 DOM
-
2026-06-18days on market $18,830 Active 20 DOM
-
2026-06-17days on market $18,830 Active 19 DOM
-
2026-06-16days on market $18,830 Active 18 DOM
-
2026-06-15days on market $18,830 Active 17 DOM
-
2026-06-13days on market $18,830 Active 15 DOM
-
2026-06-12days on market $18,830 Active 14 DOM
-
2026-06-09days on market $18,830 Active 11 DOM
-
2026-06-08days on market $18,830 Active 10 DOM
-
2026-06-07pricedays on market $18,830 Active 9 DOM
-
2026-06-05days on market $19,876 Active 7 DOM
-
2026-06-04days on market $19,876 Active 5 DOM
-
2026-06-02days on market $19,876 Active 4 DOM
-
2026-06-01days on market $19,876 Active 3 DOM
-
2026-05-31days on market $19,876 Active 2 DOM
-
2026-03-25$20,922 Active 344-char remark
-
2016-10-07soldstatus $44,875
ⓘ Source: listings_history table (triggers on properties + properties_extension) + one-shot
backfill from property_details.listing_events for pre-trigger history.
Tax reassessment forecast IA · Partial reset (capped growth)
- Current annual tax
- $542 · $45/mo
- Projected year-2 tax
- $542 · $45/mo
- Expected delta
- $0/yr ($0/mo · 0.0%)
ⓘ Screening estimate from a state-policy table — verify with the county assessor before closing.
Climate risk First Street
- Flood 1/10 Low FEMA zone X (unshaded) · 0% chance over 30 yrs
- Wildfire 2/10 Low
- Heat 3/10 Moderate 7 d/yr ≥104°F today · 15 d/yr by 30 yrs out
- Wind 2/10 Low
- Air quality 2/10 Low 1 unhealthy d/yr today · 1 by 30 yrs out
Nearby sold comps map
Loading sold comps map…
Walkable amenities ~0.75 mi
Loading nearby amenities…
Taxation est. · year 1
- Rental income
- $12,377
- − Mortgage interest
- −$1,055
- − Property taxes
- −$542
- − Insurance
- −$94
- − Repairs & maintenance
- −$990
- − Management
- −$990
- − Depreciation
- −$548
- Taxable income
- $8,158
- Est. tax owed @ 24.0%
- −$1,958
- After-tax cash flow
- $5,999/yr
For passive investors: Depreciation is non-cash, so a rental often shows a tax loss while cash-flowing — sheltering income. Rental losses are passive: they offset passive income freely, and up to $25,000/yr can offset ordinary (W-2) income if you actively participate and your MAGI is under $100k (phasing out to $0 by $150k); unused losses carry forward. On sale, claimed depreciation is recaptured at up to 25%, and gains may owe capital-gains tax (a 1031 exchange can defer both). Figures are a year-1 estimate at your 24.0% rate — not tax advice; consult a CPA.
Schools (NCES district)
- District
- Tri-County Community School District
- NCES district ID
- 1928020
- Math proficiency
- 60% ▼ -5.00%
- Reading proficiency
- 60% ▼ -10.00%
- Median HH income
- $43,222
- Composite
- 52.04/100
- National rank
- #3512
- State rank
- #289 of 330 in IA
Livability — What Cheer
- Score
- 58/100
- State rank
- #892
- US rank
- #20942
Category grades
Schools grade is shown separately in the Schools card above.
Census & demographics
- Census place
- What Cheer, IA
- City population
- 997
- Population (ZIP)
- 997
Population outlook (Keokuk County) Hauer SSP2
- Today (2025)
- 9,354 people
- By 2030
- 8,885 · -5.0%
- By 2040
- 7,956 · -14.9%
- By 2050
- 7,123 · -23.9%
- By 2075
- 5,777 · -38.2%
- By 2100
- 4,808 · -48.6%
Race, ethnicity, and origin ACS 2023
- Neighborhood character
- Predominantly White (95%)
- Race & ethnicity
- White 95% Two or more races 3% Hispanic / Latino 2%
- Common ancestry
- Lithuanian 4% Iranian 4% Portuguese 4%
- Foreign-born
- 1% · Canada
- Languages at home
- 98% English-only · Spanish 2%
Political lean MEDSL · Keokuk
- 2024 margin
- Solid R (+51.5) · D 23.7% · R 75.2% · Other 1.1%
- 2008→2024 swing
- -47.9pp toward R · 2008: -3.6pp · 2024: -51.5pp
- All cycles
- 2024: R+51.5 2020: R+44.9 2016: R+43.6 2012: R+10.4 2008: R+3.6
Not yet ingested
- Civics
- —
Market trends
- HPI YoY
- ▲ 5.64%
- Current HPI
- 100.9501
- Rent YoY
- —
- Metro
- —
- State GDP YoY
- ▲ 2.48%
- F500 in state
- 4
Industry mix (Fortune 500 HQ in IA)
| Industry | F500 HQs | Revenue |
|---|---|---|
| Financial Services | 1 | $16B |
|
||
| Retail / Convenience | 1 | $15B |
|
||
Price history
-58.0% since first listed4 events — show timeline
- 2026-06-05 Price Changed $18,830 DMMLS
- 2026-05-29 Listed $19,876 DMMLS
- 2026-03-25 Listed $20,922 IAR
- 2016-10-07 Sold (Public Records) $44,875 Public Records
Property tax history
-2.6%/yrLatest (2025): $542 · +4.2% YoY. Source: county tax records.
Cash-flow waterfall
monthlySold comps — $/sqft
last 12 mo · ≤1 miLoading sold comps…