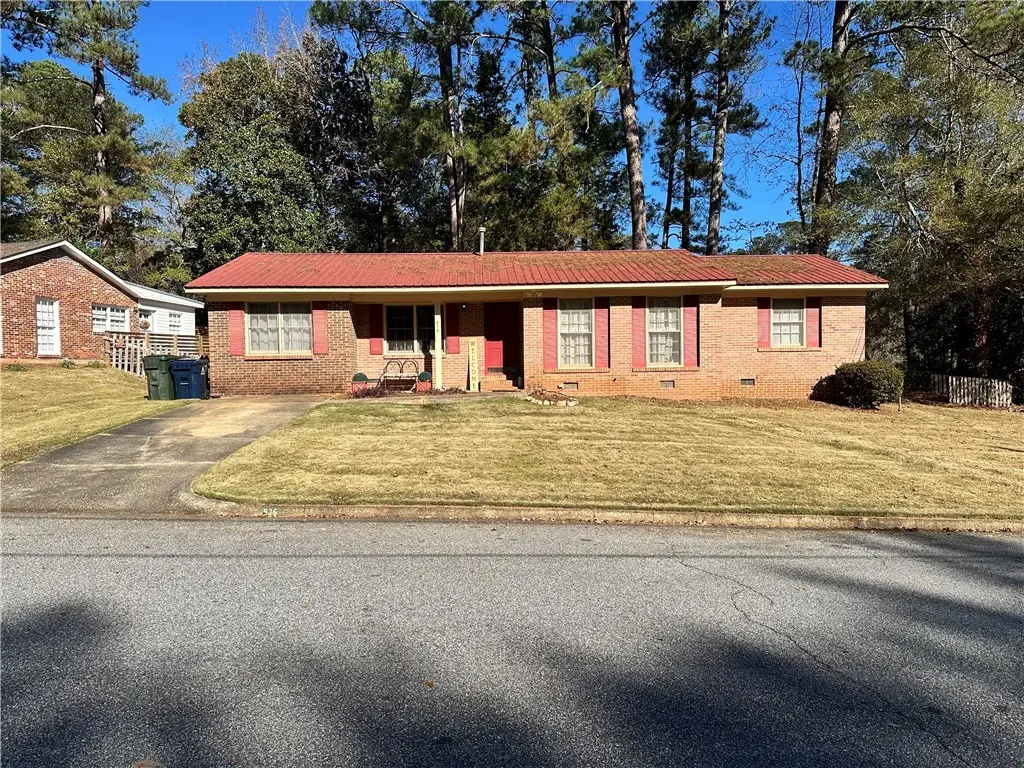
836 Cahaba Dr · Auburn, AL
Flood risk 1/10 · Minimal
- FEMA flood zone
- X (unshaded)
- Chance of flooding over 30 yrs
- 0.0%
- Est. flood insurance / yr
- $507 – $1,088
Fire risk 1/10 · Minimal
- Est. fire insurance / yr
- $916 – $1,700
Heat risk 6/10 · Moderate
- Hot days now (above 104°F)
- 7 days/yr
- Hot days in 30 yrs
- 20 days/yr
Wind risk 6/10 · Moderate
- Chance of severe wind over 30 yrs
- 75.0%
Air-quality risk 2/10 · Minimal
- Unhealthy air days now
- 1 days/yr
- Unhealthy air days in 30 yrs
- 1 days/yr
Risk factors via First Street. Map © Google.
Why this score? — see what drove the D grade
The composite is a weighted blend of 9 inputs, each scored 0–100. Each bar is that input's sub-score; the figure is the points it added to the 100-point composite (weight × sub-score).
- ARV discount +10.6/15.0
- Cash flow +9.7/30.0
- Schools +5.0/10.0
- Livability +4.0/5.0
- Rent growth +3.8/5.0
- DSCR +2.7/10.0
- Condition / age +2.5/5.0
- 1% rule +2.3/10.0
- Appreciation +0.0/10.0
$279,000
🖨 Deal sheet (PDF) 📄 Offer letter ✓ Due diligence
Listing remarks MLS
Charming brick home in a fantastic neighborhood, featuring an all-brick exterior, beautiful knotted pine walls in select areas, and a sturdy metal roof. This one-level gem is perfectly priced for anyone seeking comfort and value.
Key facts
- Metal roof
- Brick home
- All brick exterior
Tags
Neighborhood map
What this means for you Summary
Snapshot
- This is a 3-bed/2.0-bath single-family listed at $279k.
Deal economics
- At list price, monthly cash flow is $-186 ($-2k/yr) — negative.
- To cash-flow at today's rent, offer at most $246k (11.8% below list).
- To meet the 1% rule (rent ≥ 1% of price), the offer needs to be $202k (27.5% below list).
- Recommended offer: $202k (27.5% below list) — sets the bar for 1% rule.
- Cap rate 5.5% vs local median 2.7% in Auburn — top-decile yield for the area; either an underpriced asset or a hidden risk that comps aren't pricing in. Stress-test before assuming the spread holds.
Location & tenants
- Location reads 80/100 on livability (#6 in AL, #1,842 nationally) — a professional / high-income tenant draw. Strengths: crime A+, amenities A+, health & safety A+; Watch: commute F.
- Auburn City (urban): math 51% / reading 69% proficiency, ranked #7 of 129 in AL (top 5%) — acceptable for families but not a draw, mixed tenant base, ~2y average lease.
- Market conditions: Rents rising fast (+5.4%/yr); 899 active listings in the ZIP; 31 comparable units currently listed for rent nearby; rentals lingering (median 44d on market — plan ~5-8 weeks vacancy on turnover, expect pricing pressure); 65% of comp listings sitting > 30 days — soft ceiling on asking rent; 1,858 units permitted in Lee County in 2024 (113 in 5+ unit buildings).
- This rent runs 35% of the median local income ($70k/yr) — at the standard rent-burdened threshold; future hikes will face affordability resistance.
Forward outlook
- Local home prices are declining (-3.0%/yr); year-one equity from $2k of loan paydown is wiped out by about $8k of value loss. Plan a longer hold.
- Lee County population projected at +54% by 2050 — long-run rental-demand tailwind backs the buy-and-hold thesis.
Negotiation context
- It's been on market 197 days — a 12% lower offer ($246k) is reasonable based on typical stale-listing flexibility.
Risks & watch-outs
- Climate carrying-cost: major wind risk, 75% chance of damaging wind over 30y; extreme-heat days projected 7→20/yr by 2055 (HVAC capex compounding) — expect insurance premiums to compound above CPI over the hold.
Questions for the listing agent
- What do current leases actually rent for vs. the listed asking? Can we see a recent rent roll and the last 12 months of T-12 income?
- It's been on market 197 days. Have you received any prior offers? Is the seller open to a 27% concession, seller financing, or rate buy-down credit?
- Built in 1968 — when were the roof, HVAC, electrical panel, plumbing, and water heater last replaced?
- Why hasn't it sold? Are there any deal-killer items the seller is aware of (foundation, flood, title, zoning, code violations)?
- Is there a deadline driving the sale (1031 exchange, divorce, estate, relocation)? That informs how much negotiation room exists.
- Schools are A-rated — typically a magnet for longer-tenancy family renters. What's the average tenant stay here, and is there a school-zone premium baked into asking?
- The area grade is low — what's the realistic commute time and amenity access for the typical tenant pool here? Any planned neighborhood developments (good or bad) we should know about?
- What's the average days-on-market for RENTAL listings here right now (not sales)? A rising rental-DOM trend means longer vacancies and softer asking-rent achievability than the comps imply.
- What's the recent tenant-quality profile in this submarket — average credit score on applications, eviction rate, late-payment / NSF rate, and stable-employment percentage? A property-management company in the area should have these aggregated.
- How much new for-sale + rental construction is in the pipeline within 1–3 miles? Heavy new supply typically softens prices + rents 12–24 months out; constrained supply supports both.
Investment metrics
- 1% rule
- 0.73% ✗
- Cap rate
- 5.49%
- Cash-on-cash
- -2.86%
- DSCR
- 0.87
- GRM
- 11.5
CMA / ARV
- ARV (median comp)
- $299,634
- List price
- $279,000
- Delta
- -6.89%
- Verdict
- FAIR
- Comps
- 20 within 1.0 mi
Show comp detail 12 sales within ~0.75 mi
| Address | Dist | Beds/Ba | Sqft | Sold | Price | $/sf | Match |
|---|---|---|---|---|---|---|---|
| 333 Tullahoma Dr | 0.25mi | 3/2.0 | 1,371 (-5%) | 10mo | $315,000 | $230 | 70 |
| 863 Cahaba Dr | 0.05mi | 3/1.0 | 1,250 (-14%) | 2mo | $320,000 | $256 | 69 |
| 417 Jack Hampton Dr | 0.37mi | 3/3.5 | 1,440 (-1%) | 12mo | $368,000 | $256 | 66 |
| 317 Tullahoma Dr | 0.19mi | 3/2.0 | 1,597 (+10%) | 11mo | $297,000 | $186 | 65 |
| 573 Hudson Ter | 0.35mi | 4/3.0 (+1) | 1,372 (-5%) | 6mo | $550,000 | $401 | 60 |
| 670 Craig Ct | 0.60mi | 3/2.0 | 1,507 (+4%) | 13mo | $310,000 | $206 | 55 |
| 551 Lincoln St | 0.58mi | 3/2.0 | 1,520 (+5%) | 12mo | $230,000 | $151 | 54 |
| 783 Iroquois Cir | 0.69mi | 3/2.0 | 1,570 (+8%) | 2mo | $280,000 | $178 | 52 |
| 436 Frazier St | 0.73mi | 3/2.0 | 1,500 (+3%) | 11mo | $415,000 | $277 | 52 |
| 215 W Drake Ave | 0.67mi | 2/2.0 (-1) | 1,366 (-6%) | 12mo | $645,000 | $472 | 44 |
| 859 Dekalb St | 0.72mi | 3/2.0 | 1,611 (+11%) | 11mo | $320,000 | $199 | 38 |
| 424 Frazier St | 0.75mi | 3/2.0 | 1,631 (+12%) | 10mo | $434,000 | $266 | 36 |
Match score weights: distance 35% · size 25% · config 20% · recency 20%. Top-matched comps best support the ARV.
Projected returns pro-forma
-3.0% appreciation · 5.36% rent growth · sell at horizon
- IRR
- -18.7%
- Equity multiple
- 0.33×
- Total profit
- $-52,208
- Equity at exit
- $41,600
- IRR
- -7.4%
- Equity multiple
- 0.49×
- Total profit
- $-39,785
- Equity at exit
- $24,123
Cash invested: $78,120 (down + closing). Projections, not guarantees.
Landlord ↔ Tenant lean methodology
- Overall (STATE)
- 90 Strongly Landlord-Friendly
- State Alabama
- 90 Strongly Landlord-Friendly · R+15
- County
- — inherits STATE
- City
- — inherits STATE
ZIP-level market 36830
- Rents YoY
- 5.4%
- Active inventory
- 899
- Price-to-rent
- 11.5×
Monthly cashflow live
- Estimated rent
- $2,023 high interval (Pro) →
- Mortgage (P&I)
- −$1,463
- Tax from tax record
- −$205 /mo · $2,465/yr
- Insurance
- −$116
- HOA
- −$0
- Vacancy / Maint / Mgmt
- −$425
- Net cashflow
- $-186
Break-even live
Sensitivity live
| Price | -10% $-28 | -5% $-107 | +0% $-186 | +5% $-265 | +10% $-344 |
|---|---|---|---|---|---|
| Rent | -10% $-346 | -5% $-266 | +0% $-186 | +5% $-106 | +10% $-26 |
| Rate | -1.0pp $-46 | -0.5pp $-115 | base $-186 | +0.5pp $-258 | +1.0pp $-332 |
UW: 25.0% down · 7.5% · 30yr · 1.5% tax · 5.0% vac · 8.0% maint · 8.0% mgmt
Financing live
Cash to close
- Down payment
- $69,750
- Closing costs
- $8,370
- Reserves months
- —
- Total cash needed
- —
Loan-product check · same deal, 3 products live
Conventional
25% down · 7.5% · 30yr
- Down + closing
- —
- Monthly P&I
- —
- Monthly cashflow
- —
- DSCR
- —
- Eligible?
- —
Personal DTI + credit; lowest rate.
DSCR
20% down · 8.5% · 30yr
- Down + closing
- —
- Monthly P&I
- —
- Monthly cashflow
- —
- DSCR
- —
- Eligible?
- —
No personal income docs; deal must DSCR.
Hard money
10% down · 12.0% · 12mo
- Down + closing
- —
- Monthly P&I
- —
- Monthly cashflow
- —
- DSCR
- —
- Eligible?
- —
Short-term bridge; refi at stabilization.
Rent comps 31 comps
| Address | Beds | Baths | Sqft | Rent | $/sqft | DOM | Units | Dist |
|---|---|---|---|---|---|---|---|---|
| 108 Mimosa Ave Auburn, AL | 4.0 | 2.5 | 1528 | $2,200 | $1.44 | 44d | 1 | 0.18mi |
| 675 Nissa Ct Auburn, AL | 3.0 | 3.0 | 1500 | $1,850 | $1.23 | 44d | 1 | 0.27mi |
| 601 N Gay St Auburn, AL | 2.0 | 2.0 | 1150 | $1,700 | $1.48 | 44d | 1 | 0.33mi |
| 640 N Ross St Auburn, AL | 1.0–3.0 | 1.0–3.0 | 927 | $1,775 | $1.91 | 13d | 1 | 0.38mi |
| 535 Heritage Ct Auburn, AL | 2.0 | 3.0 | 1150 | $3,500 | $3.04 | 44d | 1 | 0.47mi |
| 510 Oak Meadow Ln Auburn, AL | 3.0 | 2.0 | 1551 | $1,800 | $1.16 | 44d | 1 | 0.51mi |
| 650 DeKalb St Auburn, AL | 2.0–3.0 | 2.5–3.0 | 1326 | $2,800 | $2.11 | 44d | 1 | 0.54mi |
| 427 Harper Ave Auburn, AL | 2.0 | 2.0 | 1136 | $1,400 | $1.23 | 44d | 1 | 0.77mi |
| 555 N Dean Rd Auburn, AL | 1.0–2.0 | 1.0–2.0 | 895 | $1,495 | $1.67 | 21d | 1 | 0.79mi |
| 555 N Dean Rd Auburn, AL | 2.0 | 2.0 | 1235 | $1,625 | $1.32 | 44d | 1 | 0.79mi |
| Ross Park 3/3 TH Auburn, AL | 3.0 | 3.0 | 1495 | $1,575 | $1.05 | 44d | 1 | 0.80mi |
| 310 Briar Creek Cir Auburn, AL | 3.0 | 3.0 | 1869 | $1,950 | $1.04 | 21d | 1 | 0.82mi |
| 846 Choctaw Ave Auburn, AL | 3.0 | 2.0 | 1158 | $1,600 | $1.38 | 44d | 1 | 0.87mi |
| 449 N Donahue Dr Auburn, AL | 1.0–3.0 | 1.0–3.0 | 1080 | $1,650 | $1.53 | 44d | 1 | 0.92mi |
| Ross Park 3/3 Duplex Auburn, AL | 3.0 | 3.0 | 1448 | $1,762 | $1.22 | 13d | 3 | 0.96mi |
| 507 E Glenn Ave Auburn, AL | 2.0 | 1.0 | 876 | $1,250 | $1.43 | 13d | 1 | 0.96mi |
| 516 E Glenn Ave Auburn, AL | 1.0–2.0 | 1.0–2.0 | 775 | $1,495 | $1.93 | 13d | 1 | 1.01mi |
| 340 N Donahue Dr Unit A103 Auburn, AL | 2.0 | 2.0 | 944 | $2,800 | $2.97 | 44d | 1 | 1.02mi |
| 122 N College St Unit 1 Auburn, AL | 2.0 | 2.0 | 1010 | $1,600 | $1.58 | 21d | 1 | 1.04mi |
| 420 N Dean Rd Auburn, AL | 1.0–3.0 | 1.0–2.0 | 840 | $1,575 | $1.88 | 13d | 1 | 1.04mi |
| 121 Wright St Unit 1E Auburn, AL | 2.0 | 2.0 | 950 | $2,500 | $2.63 | 44d | 1 | 1.05mi |
| 807 Harvard Dr Auburn, AL | 2.0 | 2.5 | 1273 | $1,600 | $1.26 | 44d | 1 | 1.05mi |
| 145 E Magnolia Ave #311 Auburn, AL | 2.0 | 2.0 | 1233 | $3,500 | $2.84 | 44d | 1 | 1.06mi |
| 720 Harper Ave Auburn, AL | 4.0 | 2.0 | 1320 | $2,800 | $2.12 | 44d | 1 | 1.06mi |
| 433 Cherry St Auburn, AL | 3.0 | 2.5 | 1760 | $2,300 | $1.31 | 44d | 1 | 1.17mi |
| 129 Carolina Ct Auburn, AL | 3.0 | 2.5 | 1796 | $2,650 | $1.48 | 45d | 1 | 1.19mi |
| 374 Cherry St Auburn, AL | 3.0 | 2.0 | 1460 | $2,400 | $1.64 | 21d | 1 | 1.19mi |
| 1117 Rustic Ridge Rd Auburn, AL | 3.0 | 2.0 | 1550 | $1,700 | $1.10 | 44d | 1 | 1.21mi |
| 981 Pleasant Ave Auburn, AL | 3.0 | 2.0 | 1268 | $1,650 | $1.30 | 44d | 1 | 1.44mi |
| 836 W Glenn Ave #212 Auburn, AL | 2.0 | 2.0 | 1200 | $2,000 | $1.67 | 13d | 1 | 1.46mi |
| 2260 E University Dr Auburn, AL | 1.0–2.0 | 1.0–2.0 | 777 | $1,264 | $1.63 | 13d | 8 | 1.48mi |
Listing history 16 events
-
2026-06-18days on market $279,000 Active 197 DOM
-
2026-06-17days on market $279,000 Active 196 DOM
-
2026-06-16days on market $279,000 Active 195 DOM
-
2026-06-15days on market $279,000 Active 194 DOM
-
2026-06-14days on market $279,000 Active 192 DOM
-
2026-06-13days on market $279,000 Active 191 DOM
-
2026-06-10days on market $279,000 Active 189 DOM
-
2026-06-09days on market $279,000 Active 188 DOM
-
2026-06-08days on market $279,000 Active 187 DOM
-
2026-06-07days on market $279,000 Active 186 DOM
-
2026-06-05days on market $279,000 Active 183 DOM
-
2026-06-03pricedays on market $279,000 Active 182 DOM
-
2026-05-08price $282,000 229-char remark
Show marketing remark (229 chars)
Charming brick home in a fantastic neighborhood, featuring an all-brick exterior, beautiful knotted pine walls in select areas, and a sturdy metal roof. This one-level gem is perfectly priced for anyone seeking comfort and value.
-
2026-04-01price $290,000 229-char remark
Show marketing remark (229 chars)
Charming brick home in a fantastic neighborhood, featuring an all-brick exterior, beautiful knotted pine walls in select areas, and a sturdy metal roof. This one-level gem is perfectly priced for anyone seeking comfort and value.
-
2026-02-16price $299,000 229-char remark
Show marketing remark (229 chars)
Charming brick home in a fantastic neighborhood, featuring an all-brick exterior, beautiful knotted pine walls in select areas, and a sturdy metal roof. This one-level gem is perfectly priced for anyone seeking comfort and value.
-
2025-11-30$305,000 Active 229-char remark
Show marketing remark (229 chars)
Charming brick home in a fantastic neighborhood, featuring an all-brick exterior, beautiful knotted pine walls in select areas, and a sturdy metal roof. This one-level gem is perfectly priced for anyone seeking comfort and value.
ⓘ Source: listings_history table (triggers on properties + properties_extension) + one-shot
backfill from property_details.listing_events for pre-trigger history.
Tax reassessment forecast AL · Resets to sale price
- Current annual tax
- $2,465 · $205/mo
- Projected year-2 tax
- $2,465 · $205/mo
- Expected delta
- $0/yr ($0/mo · -0.0%)
ⓘ Screening estimate from a state-policy table — verify with the county assessor before closing.
Climate risk First Street
- Flood 1/10 Low FEMA zone X (unshaded) · 0% chance over 30 yrs
- Wildfire 1/10 Low
- Heat 6/10 Major 7 d/yr ≥104°F today · 20 d/yr by 30 yrs out
- Wind 6/10 Major 75% chance of damaging wind over 30 yrs
- Air quality 2/10 Low 1 unhealthy d/yr today · 1 by 30 yrs out
Nearby sold comps map
Loading sold comps map…
Walkable amenities ~0.75 mi
Loading nearby amenities…
Taxation est. · year 1
- Rental income
- $24,282
- − Mortgage interest
- −$15,628
- − Property taxes
- −$2,465
- − Insurance
- −$1,395
- − Repairs & maintenance
- −$1,943
- − Management
- −$1,943
- − Depreciation
- −$8,116
- Taxable loss
- −$7,208
- Est. tax savings @ 24.0%
- +$1,730
- After-tax cash flow
- $-504/yr
For passive investors: Depreciation is non-cash, so a rental often shows a tax loss while cash-flowing — sheltering income. Rental losses are passive: they offset passive income freely, and up to $25,000/yr can offset ordinary (W-2) income if you actively participate and your MAGI is under $100k (phasing out to $0 by $150k); unused losses carry forward. On sale, claimed depreciation is recaptured at up to 25%, and gains may owe capital-gains tax (a 1031 exchange can defer both). Figures are a year-1 estimate at your 24.0% rate — not tax advice; consult a CPA.
Schools (NCES district)
- District
- Auburn City
- NCES district ID
- 0100210
- Math proficiency
- 51% ▼ -21.00%
- Reading proficiency
- 69% ▲ 5.00%
- Median HH income
- $38,126
- Composite
- 49.87/100
- National rank
- #1944
- State rank
- #7 of 129 in AL
Livability — Auburn
- Score
- 80/100
- State rank
- #6
- US rank
- #1842
Category grades
Schools grade is shown separately in the Schools card above.
Census & demographics
- Census place
- Auburn, AL
- County
- Lee County · 144,175 people
- City population
- 80,251
- Metro
- Auburn-Opelika, AL
- Population (ZIP)
- 49,292
- Household income
- $70,188
- Rent vs Own
- Severe rent burden
- 2961.0
Population outlook (Lee County) Hauer SSP2
- Today (2025)
- 196,440 people
- By 2030
- 217,417 · +10.7%
- By 2040
- 259,467 · +32.1%
- By 2050
- 301,557 · +53.5%
- By 2075
- 402,186 · +104.7%
- By 2100
- 474,503 · +141.6%
Race, ethnicity, and origin ACS 2023
- Neighborhood character
- Predominantly White (70%)
- Race & ethnicity
- White 70% Black 14% Asian 10% Hispanic / Latino 4% Two or more races 3%
- Common ancestry
- Slovak 4% Italian 3% Serbian 2%
- Foreign-born
- 11% · South Korea, Canada, China
- Languages at home
- 87% English-only · Korean 4% Spanish 3% Chinese 2%
Political lean MEDSL · Lee
- 2024 margin
- Strong R (+27.8) · D 35.5% · R 63.3% · Other 1.2%
- 2008→2024 swing
- -8.1pp toward R · 2008: -19.8pp · 2024: -27.8pp
- All cycles
- 2024: R+27.8 2020: R+20.1 2016: R+23.1 2012: R+19.9 2008: R+19.8
Not yet ingested
- Civics
- —
Market trends
- HPI YoY
- ▼ -156.53%
- Current HPI
- 270.6646
- Rent YoY
- ▲ 5.36%
- Metro
- Auburn-Opelika, AL
- State GDP YoY
- ▲ 2.94%
- F500 in state
- 4
Industry mix (Fortune 500 HQ in AL)
| Industry | F500 HQs | Revenue |
|---|---|---|
| Financial Services | 1 | $8B |
|
||
| Healthcare | 1 | $5B |
|
||
Price history
-7.5% since first listed4 events — show timeline
- 2026-05-08 Price Changed $282,000 LCMLS
- 2026-04-01 Price Changed $290,000 LCMLS
- 2026-02-16 Price Changed $299,000 LCMLS
- 2025-11-30 Listed $305,000 LCMLS
Property tax history
+6.7%/yrLatest (2025): $2,465 · +0.0% YoY. Source: county tax records.
Cash-flow waterfall
monthlySold comps — $/sqft
last 12 mo · ≤1 miLoading sold comps…