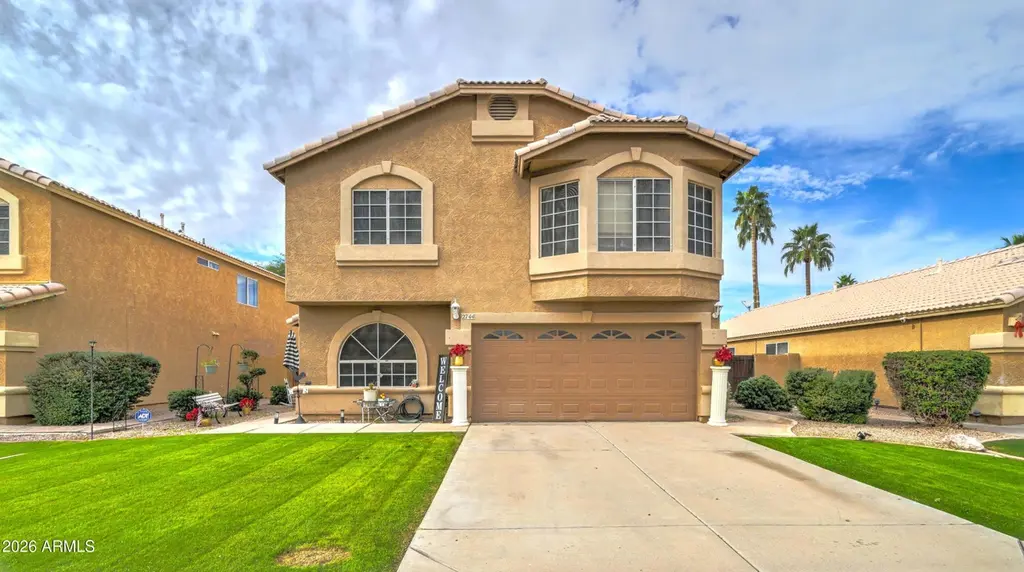
2744 S Raven -- · Mesa, AZ
Flood risk 1/10 · Minimal
- FEMA flood zone
- X (shaded)
- Chance of flooding over 30 yrs
- 0.0%
- Est. flood insurance / yr
- $507 – $1,088
Fire risk 4/10 · Minor
- Est. fire insurance / yr
- $610 – $1,132
Heat risk 9/10 · Severe
- Hot days now (above 111°F)
- 6 days/yr
- Hot days in 30 yrs
- 16 days/yr
Wind risk 1/10 · Minimal
- Chance of severe wind over 30 yrs
- —
Air-quality risk 2/10 · Minimal
- Unhealthy air days now
- 1 days/yr
- Unhealthy air days in 30 yrs
- 2 days/yr
Risk factors via First Street. Map © Google.
Why this score? — see what drove the D grade
The composite is a weighted blend of 9 inputs, each scored 0–100. Each bar is that input's sub-score; the figure is the points it added to the 100-point composite (weight × sub-score).
- ARV discount +11.8/15.0
- Cash flow +7.0/30.0
- Appreciation +5.7/10.0
- Schools +4.6/10.0
- Livability +4.0/5.0
- Rent growth +2.6/5.0
- Condition / age +2.5/5.0
- DSCR +1.2/10.0
- 1% rule +0.8/10.0
$435,000
🖨 Deal sheet 📄 Offer letter ✓ Due diligence
Listing remarks MLS
3 bedrooms and 2.5 bathrooms located in Superstition Springs neighborhood. Property has been updated, painted and shows fantastic! The kitchen island and pantry make for cooking meals a dream. Wonderful neighborhood with community park in a Super location!
Key facts
- Community park
- Kitchen island
- 5,240 sq ft lot
Tags
Neighborhood map
What this means for you Summary
Snapshot
- This is a 3-bed/3.0-bath single-family listed at $435k.
Deal economics
- At list price, monthly cash flow is $-630 ($-8k/yr) — negative.
- To cash-flow at today's rent, offer at most $324k (25.6% below list).
- To meet the 1% rule (rent ≥ 1% of price), the offer needs to be $252k (42.0% below list).
- Recommended offer: $252k (42.0% below list) — sets the bar for 1% rule.
- Cap rate 4.6% vs local median 3.4% in Mesa — top-decile yield for the area; either an underpriced asset or a hidden risk that comps aren't pricing in. Stress-test before assuming the spread holds.
Location & tenants
- Location reads 79/100 on livability (#6 in AZ, #2,034 nationally) — a middle-class / working-renter tenant base. Strengths: amenities A+, commute A+, housing A+; Watch: health & safety C-, crime D.
- Gilbert Unified District (4239) (suburban): math 49% / reading 52% proficiency, ranked #38 of 249 in AZ (top 15%) — acceptable for families but not a draw, mixed tenant base, ~2y average lease; only 14% free/reduced lunch — higher-income household profile.
- Market conditions: Rents flat; 165 active listings in the ZIP; 40 comparable units currently listed for rent nearby; rentals at typical pace (median 24d on market — plan ~3-4 weeks tenant-placement turnaround); solid renter incomes; 36,011 units permitted in Maricopa County in 2024 (12,801 in 5+ unit buildings).
- This rent runs 36% of the median local income ($84k/yr) — at the standard rent-burdened threshold; future hikes will face affordability resistance.
Forward outlook
- In year one you build about $9k of equity ($3k loan paydown + $6k appreciation (1.4% local appreciation)).
- Maricopa County population projected at +38% by 2050 — long-run rental-demand tailwind backs the buy-and-hold thesis.
- By year 4, paydown + projected appreciation supports a ~$33k cash-out refi (75% LTV) — recoverable capital for the next deal without selling this one.
Negotiation context
- It's been on market 152 days — a 12% lower offer ($383k) is reasonable based on typical stale-listing flexibility.
- 6 sale attempts since 19y ago; this cycle's ask is 15718% above the opening price — seller raised mid-cycle; expect resistance to lowballs.
Risks & watch-outs
- Climate carrying-cost: extreme-heat days projected 6→16/yr by 2055 (HVAC capex compounding) — expect insurance premiums to compound above CPI over the hold.
Questions for the listing agent
- What do current leases actually rent for vs. the listed asking? Can we see a recent rent roll and the last 12 months of T-12 income?
- It's been on market 152 days. Have you received any prior offers? Is the seller open to a 42% concession, seller financing, or rate buy-down credit?
- What does the HOA fee cover, when was the last increase, and are there any pending special assessments or reserve-fund shortfalls?
- Why hasn't it sold? Are there any deal-killer items the seller is aware of (foundation, flood, title, zoning, code violations)?
- Is there a deadline driving the sale (1031 exchange, divorce, estate, relocation)? That informs how much negotiation room exists.
- Crime grade is D in this area — have there been break-ins, vandalism, or insurance claims at this property in the last 3 years? What carrier currently insures it and at what premium?
- The area grade is low — what's the realistic commute time and amenity access for the typical tenant pool here? Any planned neighborhood developments (good or bad) we should know about?
- What's the average days-on-market for RENTAL listings here right now (not sales)? A rising rental-DOM trend means longer vacancies and softer asking-rent achievability than the comps imply.
- What's the recent tenant-quality profile in this submarket — average credit score on applications, eviction rate, late-payment / NSF rate, and stable-employment percentage? A property-management company in the area should have these aggregated.
- How much new for-sale + rental construction is in the pipeline within 1–3 miles? Heavy new supply typically softens prices + rents 12–24 months out; constrained supply supports both.
Investment metrics
- 1% rule
- 0.58% ✗
- Cap rate
- 4.55%
- Cash-on-cash
- -6.21%
- DSCR
- 0.72
- GRM
- 14.4
CMA / ARV
- ARV (median comp)
- $481,154
- List price
- $435,000
- Delta
- -9.59%
- Verdict
- FAIR
- Comps
- 20 within 1.0 mi
Show comp detail 12 sales within ~0.75 mi
| Address | Dist | Beds/Ba | Sqft | Sold | Price | $/sf | Match |
|---|---|---|---|---|---|---|---|
| 7417 E Naranja Ave | 0.05mi | 3/2.5 | 1,544 (0%) | 3mo | $430,000 | $278 | 94 |
| 7506 E Navarro Ave | 0.18mi | 3/2.5 | 1,544 (0%) | 1mo | $440,000 | $285 | 89 |
| 7533 E Navarro Ave | 0.21mi | 3/2.0 | 1,610 (+4%) | 3mo | $410,000 | $255 | 76 |
| 2950 S Mesita -- | 0.57mi | 3/2.0 | 1,438 (-7%) | 1mo | $430,000 | $299 | 58 |
| 7522 E Lobo Ave | 0.48mi | 3/2.0 | 1,409 (-9%) | 3mo | $388,900 | $276 | 57 |
| 7246 E Lomita Ave | 0.63mi | 3/2.0 | 1,630 (+6%) | 1mo | $440,000 | $270 | 56 |
| 7344 E Medina Ave | 0.43mi | 4/2.0 (+1) | 1,715 (+11%) | 3mo | $445,000 | $259 | 50 |
| 7836 E Neville Ave | 0.61mi | 2/2.0 (-1) | 1,656 (+7%) | 1mo | $425,000 | $257 | 50 |
| 7726 E Navarro Ave | 0.41mi | 2/2.0 (-1) | 1,331 (-14%) | 2mo | $327,500 | $246 | 47 |
| 3041 S Aletta -- | 0.58mi | 3/2.0 | 1,751 (+13%) | 3mo | $505,000 | $288 | 44 |
| 7805 E Neville Ave | 0.53mi | 2/2.0 (-1) | 1,345 (-13%) | 2mo | $349,900 | $260 | 44 |
| 7866 E Neville Ave | 0.69mi | 2/2.0 (-1) | 1,658 (+7%) | 3mo | $440,000 | $265 | 44 |
Match score weights: distance 35% · size 25% · config 20% · recency 20%. Top-matched comps best support the ARV.
Projected returns pro-forma
1.44% appreciation · 0.54% rent growth · sell at horizon
- IRR
- -4.6%
- Equity multiple
- 0.76×
- Total profit
- $-28,838
- Equity at exit
- $158,550
- IRR
- -0.5%
- Equity multiple
- 0.94×
- Total profit
- $-7,852
- Equity at exit
- $218,700
Cash invested: $121,800 (down + closing). Projections, not guarantees.
Landlord ↔ Tenant lean methodology
- Overall (STATE)
- 87 Strongly Landlord-Friendly
- State Arizona
- 87 Strongly Landlord-Friendly · R+3
- County
- — inherits STATE
- City
- — inherits STATE
ZIP-level market 85209
- Home prices YoY
- 0.5%
- Rents YoY
- 0.5%
- Active inventory
- 165
- Price-to-rent
- 14.4×
Monthly cashflow live
- Estimated rent
- $2,523 high interval (Pro) →
- Mortgage (P&I)
- −$2,281
- Tax from tax record
- −$105 /mo · $1,265/yr
- Insurance
- −$181
- HOA
- −$55
- Vacancy / Maint / Mgmt
- −$530
- Net cashflow
- $-630
Break-even live
UW: 25.0% down · 7.5% · 30yr · 1.5% tax · 5.0% vac · 8.0% maint · 8.0% mgmt
Financing live
Cash to close
- Down payment
- $108,750
- Closing costs
- $13,050
- Reserves months
- —
- Total cash needed
- —
Loan-product check · same deal, 3 products live
Conventional
25% down · 7.5% · 30yr
- Down + closing
- —
- Monthly P&I
- —
- Monthly cashflow
- —
- DSCR
- —
- Eligible?
- —
Personal DTI + credit; lowest rate.
DSCR
20% down · 8.5% · 30yr
- Down + closing
- —
- Monthly P&I
- —
- Monthly cashflow
- —
- DSCR
- —
- Eligible?
- —
No personal income docs; deal must DSCR.
Hard money
10% down · 12.0% · 12mo
- Down + closing
- —
- Monthly P&I
- —
- Monthly cashflow
- —
- DSCR
- —
- Eligible?
- —
Short-term bridge; refi at stabilization.
Rent comps 40 comps
| Address | Beds | Baths | Sqft | Rent | $/sqft | DOM | Units | Dist |
|---|---|---|---|---|---|---|---|---|
| 7323 E Navarro Ave Mesa, AZ | 3.0 | 2.5 | 2212 | $2,266 | $1.02 | 22d | 1 | 0.13mi |
| 2728 S Sawyer Cir Mesa, AZ | 3.0 | 3.0 | 2241 | $2,595 | $1.16 | 43d | 1 | 0.14mi |
| 7306 E Naranja Ave Mesa, AZ | 4.0 | 2.0 | 1700 | $2,200 | $1.29 | 43d | 1 | 0.16mi |
| 7246 E Naranja Ave Mesa, AZ | 3.0 | 2.0 | 1710 | $2,495 | $1.46 | 3d | 1 | 0.20mi |
| 7414 E Onza Ave Mesa, AZ | 3.0 | 2.0 | 1637 | $2,630 | $1.61 | 2d | 1 | 0.22mi |
| 7515 E Laguna Azul Ave Mesa, AZ | 3.0 | 3.0 | 2169 | $4,500 | $2.07 | 43d | 1 | 0.49mi |
| 7515 E Laguna Azul Ave Mesa, AZ | 3.0 | 3.0 | 2169 | $4,500 | $2.07 | 5d | 1 | 0.49mi |
| 7521 E Laguna Azul Ave Mesa, AZ | 3.0 | 2.5 | 1544 | $2,315 | $1.50 | 43d | 1 | 0.49mi |
| 7251 E Lakeview Ave Mesa, AZ | 3.0 | 2.0 | 2058 | $2,550 | $1.24 | 15d | 1 | 0.65mi |
| 7064 E Lobo Ave Mesa, AZ | 3.0 | 2.0 | 1980 | $2,440 | $1.23 | 22d | 1 | 0.68mi |
| 6910 E Madero Ave Mesa, AZ | 3.0 | 2.0 | 1608 | $2,050 | $1.27 | 12d | 1 | 0.75mi |
| 7253 E Kiva Ave Mesa, AZ | 3.0 | 2.0 | 1521 | $2,100 | $1.38 | 2d | 1 | 0.76mi |
| 3922 E Lobo Ave Mesa, AZ | 3.0 | 2.0 | 1691 | $2,200 | $1.30 | 22d | 1 | 0.82mi |
| 668 N Sparrow Ct Gilbert, AZ | 4.0 | 3.0 | 2226 | $2,800 | $1.26 | 24d | 1 | 0.82mi |
| 4754 E Olive Ave Gilbert, AZ | 3.0 | 2.5 | 2058 | $2,500 | $1.21 | 43d | 1 | 0.82mi |
| 4737 E Barbarita Ave Gilbert, AZ | 4.0 | 3.0 | 2226 | $2,900 | $1.30 | 18d | 1 | 0.82mi |
| 4752 E Laurel Ave Gilbert, AZ | 3.0 | 2.5 | 1262 | $2,850 | $2.26 | 43d | 1 | 0.86mi |
| 692 N Blackbird Dr Gilbert, AZ | 4.0 | 3.0 | 2226 | $2,350 | $1.06 | 20d | 1 | 0.87mi |
| 497 N Ranger Trl Gilbert, AZ | 4.0 | 3.0 | 2028 | $1,200 | $0.59 | 12d | 1 | 0.88mi |
| 4776 E Guadalupe Rd Gilbert, AZ | 1.0–3.0 | 1.0–2.0 | 1149 | $2,025 | $1.76 | 2d | 12 | 0.89mi |
| 4714 E Laurel Ave Gilbert, AZ | 3.0 | 2.5 | 1262 | $1,925 | $1.53 | 43d | 1 | 0.91mi |
| 6959 E Kessler Ave Mesa, AZ | 3.0 | 2.0 | 1533 | $2,150 | $1.40 | 24d | 1 | 0.91mi |
| 4649 E Towne Ln Gilbert, AZ | 4.0 | 3.0 | 2189 | $2,845 | $1.30 | 43d | 1 | 0.91mi |
| 2990 S Power Rd Mesa, AZ | 2.0–3.0 | 2.0 | 1129 | $1,596 | $1.41 | 5d | 19 | 0.92mi |
| 7052 E Keats Ave Mesa, AZ | 3.0 | 2.0 | 1533 | $2,195 | $1.43 | 43d | 1 | 0.92mi |
| 7007 E Keats Ave Mesa, AZ | 3.0 | 2.0 | 1533 | $4,000 | $2.61 | 24d | 1 | 0.93mi |
| 2047 S Jefferson Mesa, AZ | 3.0 | 2.0 | 1353 | $2,495 | $1.84 | 43d | 1 | 0.94mi |
| 4685 E Laurel Ave Gilbert, AZ | 3.0 | 2.5 | 1262 | $1,895 | $1.50 | 43d | 1 | 0.94mi |
| 2058 S Longwood Mesa, AZ | 2.0 | 2.0 | 1408 | $1,750 | $1.24 | 43d | 1 | 0.95mi |
| 7014 E Kiva Ave Mesa, AZ | 3.0 | 2.0 | 1533 | $2,185 | $1.43 | 43d | 1 | 0.97mi |
| 2311 S Farnsworth Dr #85 Mesa, AZ | 2.0 | 2.0 | 1332 | $3,300 | $2.48 | 3d | 1 | 1.01mi |
| 4526 E Towne Ln Gilbert, AZ | 4.0 | 2.0 | 1824 | $2,595 | $1.42 | 5d | 1 | 1.09mi |
| 8240 E Obispo Ave Mesa, AZ | 3.0 | 2.0 | 1655 | $2,200 | $1.33 | 18d | 1 | 1.14mi |
| 907 N Falcon Dr Gilbert, AZ | 3.0 | 2.0 | 1308 | $1,995 | $1.53 | 5d | 1 | 1.14mi |
| 7950 E Keats Ave Mesa, AZ | 2.0 | 2.0 | 1228 | $1,995 | $1.62 | 24d | 1 | 1.17mi |
| 3315 S Lotus Mesa, AZ | 3.0 | 2.5 | 1744 | $2,400 | $1.38 | 43d | 1 | 1.21mi |
| 3336 S Lotus Mesa, AZ | 3.0 | 2.5 | 1744 | $2,350 | $1.35 | 24d | 1 | 1.23mi |
| 4401 E Stanford Ave Unit 1545846P Gilbert, AZ | 3.0 | 2.0 | 1517 | $3,102 | $2.04 | 16d | 1 | 1.27mi |
| 8020 E Keats Ave #299 Mesa, AZ | 2.0 | 2.0 | 1679 | $2,600 | $1.55 | 43d | 1 | 1.27mi |
| 8433 E Guadalupe Rd Mesa, AZ | 1.0–3.0 | 1.0–2.0 | 936 | $4,045 | $4.32 | 1d | 1 | 1.28mi |
HOA detail
- Monthly dues
- $55 · $660/yr
Listing history 30 events
-
2026-06-07statusdays on market $435,000 Pending 152 DOM
-
2026-06-04days on market $435,000 Active 150 DOM
-
2026-06-03days on market $435,000 Active 149 DOM
-
2026-06-02days on market $435,000 Active 148 DOM
-
2026-06-01days on market $435,000 Active 147 DOM
-
2026-05-31days on market $435,000 Active 146 DOM
-
2026-04-24price $435,000 256-char remark
Show marketing remark (256 chars)
3 bedrooms and 2.5 bathrooms located in Superstition Springs neighborhood. Property has been updated, painted and shows fantastic! The kitchen island and pantry make for cooking meals a dream. Wonderful neighborhood with community park in a Super location!
-
2026-03-23price $439,900 256-char remark
Show marketing remark (256 chars)
3 bedrooms and 2.5 bathrooms located in Superstition Springs neighborhood. Property has been updated, painted and shows fantastic! The kitchen island and pantry make for cooking meals a dream. Wonderful neighborhood with community park in a Super location!
-
2026-02-12price $444,900 256-char remark
Show marketing remark (256 chars)
3 bedrooms and 2.5 bathrooms located in Superstition Springs neighborhood. Property has been updated, painted and shows fantastic! The kitchen island and pantry make for cooking meals a dream. Wonderful neighborhood with community park in a Super location!
-
2026-02-07price $2,600
-
2026-01-23price $2,695
-
2026-01-16$2,750
-
2026-01-05$449,900 Active 256-char remark
Show marketing remark (256 chars)
3 bedrooms and 2.5 bathrooms located in Superstition Springs neighborhood. Property has been updated, painted and shows fantastic! The kitchen island and pantry make for cooking meals a dream. Wonderful neighborhood with community park in a Super location!
-
2024-11-07soldstatus $400,000
-
2024-11-05soldstatus $400,000 Closed 305-char remark
Show marketing remark (305 chars)
Two-story home with 3 bedrooms and 2.5 bathrooms located in desirable Superstition Springs neighborhood. Property has carpet and tile flooring, as well as laminate flooring in the kitchen and family room. Kitchen has center island and pantry. Wonderful neighborhood with community park! Great location!
-
2024-10-30soldstatus $7,272,000
-
2024-09-25status Pending 305-char remark
Show marketing remark (305 chars)
Two-story home with 3 bedrooms and 2.5 bathrooms located in desirable Superstition Springs neighborhood. Property has carpet and tile flooring, as well as laminate flooring in the kitchen and family room. Kitchen has center island and pantry. Wonderful neighborhood with community park! Great location!
-
2024-09-13price $399,950 305-char remark
Show marketing remark (305 chars)
Two-story home with 3 bedrooms and 2.5 bathrooms located in desirable Superstition Springs neighborhood. Property has carpet and tile flooring, as well as laminate flooring in the kitchen and family room. Kitchen has center island and pantry. Wonderful neighborhood with community park! Great location!
-
2024-08-16$425,000 Active 305-char remark
Show marketing remark (305 chars)
Two-story home with 3 bedrooms and 2.5 bathrooms located in desirable Superstition Springs neighborhood. Property has carpet and tile flooring, as well as laminate flooring in the kitchen and family room. Kitchen has center island and pantry. Wonderful neighborhood with community park! Great location!
-
2023-11-21historical $2,045
-
2023-11-15price $2,045
-
2023-11-03$2,075
-
2019-07-01soldstatus $236,000
-
2019-06-04soldstatus $243,656
-
2008-09-22soldstatus $173,000
-
2008-08-01historical
-
2008-07-23$159,000
-
2008-03-07historical
-
2007-09-20$160,000
-
1995-10-03soldstatus $126,000
ⓘ Source: listings_history table (triggers on properties + properties_extension) + one-shot
backfill from property_details.listing_events for pre-trigger history.
Tax reassessment forecast AZ · Resets to sale price
- Current annual tax
- $1,265 · $105/mo
- Projected year-2 tax
- $2,871 · $239/mo
- Expected delta
- +$1,606/yr (+$134/mo · 127.0%)
ⓘ Screening estimate from a state-policy table — verify with the county assessor before closing.
Climate risk First Street
- Flood 1/10 Low FEMA zone X (shaded) · 0% chance over 30 yrs
- Wildfire 4/10 Moderate
- Heat 9/10 Extreme 6 d/yr ≥111°F today · 16 d/yr by 30 yrs out
- Wind 1/10 Low
- Air quality 2/10 Low 1 unhealthy d/yr today · 2 by 30 yrs out
Nearby sold comps map
Loading sold comps map…
Walkable amenities ~0.75 mi
Loading nearby amenities…
Taxation est. · year 1
- Rental income
- $30,271
- − Mortgage interest
- −$24,367
- − Property taxes
- −$1,265
- − Insurance
- −$2,175
- − Repairs & maintenance
- −$2,422
- − Management
- −$2,422
- − HOA
- −$660
- − Depreciation
- −$12,655
- Taxable loss
- −$15,694
- Est. tax savings @ 24.0%
- +$3,767
- After-tax cash flow
- $-3,794/yr
For passive investors: Depreciation is non-cash, so a rental often shows a tax loss while cash-flowing — sheltering income. Rental losses are passive: they offset passive income freely, and up to $25,000/yr can offset ordinary (W-2) income if you actively participate and your MAGI is under $100k (phasing out to $0 by $150k); unused losses carry forward. On sale, claimed depreciation is recaptured at up to 25%, and gains may owe capital-gains tax (a 1031 exchange can defer both). Figures are a year-1 estimate at your 24.0% rate — not tax advice; consult a CPA.
Schools (NCES district)
- District
- Gilbert Unified District (4239)
- NCES district ID
- 0403400
- Math proficiency
- 49% ▼ -8.00%
- Reading proficiency
- 52% ▼ -7.00%
- Median HH income
- $74,715
- Composite
- 45.55/100
- National rank
- #2600
- State rank
- #38 of 249 in AZ
Livability — Mesa
- Score
- 79/100
- State rank
- #6
- US rank
- #2034
Category grades
Schools grade is shown separately in the Schools card above.
Census & demographics
- Census place
- Mesa, AZ
- County
- Maricopa County · 4,537,380 people
- City population
- 555,266
- Metro
- Phoenix-Mesa-Chandler, AZ
- Population (ZIP)
- 43,150
- Household income
- $84,432
- Rent vs Own
- Severe rent burden
- 972.0
Population outlook (Maricopa County) Hauer SSP2
- Today (2025)
- 4,979,203 people
- By 2030
- 5,378,229 · +8.0%
- By 2040
- 6,156,598 · +23.6%
- By 2050
- 6,872,376 · +38.0%
- By 2075
- 8,401,270 · +68.7%
- By 2100
- 9,247,439 · +85.7%
Race, ethnicity, and origin ACS 2023
- Neighborhood character
- Predominantly White (72%)
- Race & ethnicity
- White 72% Hispanic / Latino 15% Two or more races 9% Black 4% Asian 3%
- Hispanic origin (detail)
- Mexican 11%
- Common ancestry
- Portuguese 4% Romanian 3% Lithuanian 3%
- Foreign-born
- 9% · Canada, China, Vietnam
- Languages at home
- 87% English-only · Spanish 9% Tagalog/Filipino 1% Chinese 1%
Political lean MEDSL · Maricopa
- 2024 margin
- Toss-up / Even · D 47.7% · R 51.2% · Other 1.1%
- 2008→2024 swing
- +7.1pp toward D · 2008: -10.6pp · 2024: -3.5pp
- All cycles
- 2024: R+3.5 2020: D+2.2 2016: R+3.5 2012: R+12.0 2008: R+10.6
Not yet ingested
- Civics
- —
Market trends
- HPI YoY
- ▲ 1.44%
- Current HPI
- 277.6198
- Rent YoY
- ▲ 0.54%
- Metro
- Phoenix-Mesa-Chandler, AZ
- State GDP YoY
- ▲ 4.54%
- F500 in state
- 20
Industry mix (Fortune 500 HQ in AZ)
| Industry | F500 HQs | Revenue |
|---|---|---|
| Technology | 2 | $13B |
|
||
| Mining / Metals | 1 | $23B |
|
||
| Environmental Services | 1 | $16B |
|
||
| Metals / Steel | 1 | $14B |
|
||
| Technology Distribution | 1 | $9B |
|
||
| Homebuilding | 1 | $8B |
|
||
Price history
+245.2% since first listed24 events — show timeline
- 2026-04-24 Price Changed $435,000 ARMLS
- 2026-03-23 Price Changed $439,900 ARMLS
- 2026-02-12 Price Changed $444,900 ARMLS
- 2026-02-07 Price Changed $2,600 ARMLS
- 2026-01-23 Price Changed $2,695 ARMLS
- 2026-01-16 Listed for Rent $2,750 ARMLS
- 2026-01-05 Listed $449,900 ARMLS
- 2024-11-07 Sold (Public Records) $400,000 Public Records
- 2024-11-05 Sold (MLS) $400,000 ARMLS
- 2024-10-30 Sold (Public Records) $7,272,000 Public Records
- 2024-09-25 Pending — ARMLS
- 2024-09-13 Price Changed $399,950 ARMLS
- 2024-08-16 Listed $425,000 ARMLS
- 2023-11-21 Rental Removed $2,045 RENTLY
- 2023-11-15 Price Changed $2,045 RENTLY
- 2023-11-03 Listed for Rent $2,075 RENTLY
- 2019-07-01 Sold (Public Records) $236,000 Public Records
- 2019-06-04 Sold (Public Records) $243,656 Public Records
- 2008-09-22 Sold (MLS) $173,000 ARMLS
- 2008-08-01 Listing Removed — ARMLS
- 2008-07-23 Listed $159,000 ARMLS
- 2008-03-07 Listing Removed — ARMLS
- 2007-09-20 Listed $160,000 ARMLS
- 1995-10-03 Sold (Public Records) $126,000 Public Records
Property tax history
+0.9%/yrLatest (2025): $1,265 · -14.3% YoY. Source: county tax records.
Cash-flow waterfall
monthlySold comps — $/sqft
last 12 mo · ≤1 miLoading sold comps…