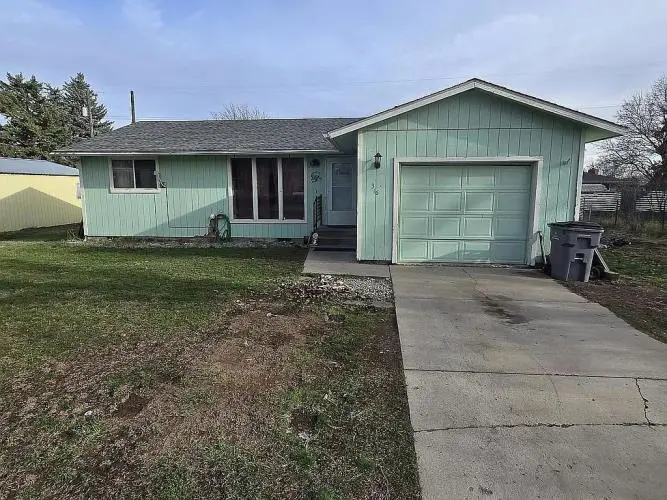
316 Washington St · Davenport, WA
Flood risk 1/10 · Minimal
- FEMA flood zone
- —
- Chance of flooding over 30 yrs
- 0.0%
- Est. flood insurance / yr
- —
Fire risk 5/10 · Moderate
- Est. fire insurance / yr
- $604 – $1,122
Heat risk 3/10 · Minor
- Hot days now (above 93°F)
- 7 days/yr
- Hot days in 30 yrs
- 14 days/yr
Wind risk 1/10 · Minimal
- Chance of severe wind over 30 yrs
- —
Air-quality risk 8/10 · Major
- Unhealthy air days now
- 13 days/yr
- Unhealthy air days in 30 yrs
- 16 days/yr
Risk factors via First Street. Map © Google.
Why this score? — see what drove the D- grade
The composite is a weighted blend of 9 inputs, each scored 0–100. Each bar is that input's sub-score; the figure is the points it added to the 100-point composite (weight × sub-score).
- ARV discount +15.0/15.0
- Cash flow +7.4/30.0
- Schools +5.7/10.0
- Livability +3.6/5.0
- Rent growth +2.5/5.0
- Condition / age +2.5/5.0
- DSCR +1.6/10.0
- 1% rule +1.3/10.0
- Appreciation +0.0/10.0
$239,000
🖨 Deal sheet (PDF) 📄 Offer letter ✓ Due diligence
Listing remarks MLS
Cute little home in Davenport WA Cute and clean, 3 BR One Bath, fenced backyard, attached garage. With appliances. Close to schools and downtown.
Key facts
- Close to schools
- Fenced backyard
- Close to downtown
Tags
Neighborhood map
What this means for you Summary
Snapshot
- This is a 3-bed/1.0-bath single-family listed at $239k.
Deal economics
- At list price, monthly cash flow is $-303 ($-4k/yr) — negative.
- To cash-flow at today's rent, offer at most $185k (22.4% below list).
- To meet the 1% rule (rent ≥ 1% of price), the offer needs to be $150k (37.2% below list).
- Recommended offer: $150k (37.2% below list) — sets the bar for 1% rule.
- Cap rate 4.8% vs local median 2.2% in Davenport — top-decile yield for the area; either an underpriced asset or a hidden risk that comps aren't pricing in. Stress-test before assuming the spread holds.
Location & tenants
- Location reads 72/100 on livability (#213 in WA) — a middle-class / working-renter tenant base. Strengths: cost of living A+, housing A+, health & safety A+; Watch: amenities F, commute F.
- Davenport School District (rural): math 63% / reading 68% proficiency, ranked #34 of 291 in WA (top 12%) — acceptable for families but not a draw, mixed tenant base, ~2y average lease.
- Market conditions: 180 active listings in the ZIP; 1 comparable units currently listed for rent nearby; 49 units permitted in Lincoln County in 2024 (0 in 5+ unit buildings).
Forward outlook
- Local home prices are declining (-3.0%/yr); year-one equity from $2k of loan paydown is wiped out by about $7k of value loss. Plan a longer hold.
- Lincoln County population projected at -20% by 2050 — secular population decline; favor cash flow + early exit over multi-decade hold.
Negotiation context
- It's been on market 71 days — a 6% lower offer ($225k) is reasonable based on typical stale-listing flexibility.
- 2 sale attempts since 13y ago with the ask held roughly flat each time — persistent listings suggest the price (not the market) is what's stuck; bring a comps-based counter.
- Current owner paid $108k; list at $239k implies a 121% gain — meaningful room to come down on a strong offer.
Risks & watch-outs
- Climate carrying-cost: moderate wildfire risk — expect insurance premiums to compound above CPI over the hold.
Questions for the listing agent
- What do current leases actually rent for vs. the listed asking? Can we see a recent rent roll and the last 12 months of T-12 income?
- It's been on market 71 days. Have you received any prior offers? Is the seller open to a 37% concession, seller financing, or rate buy-down credit?
- Why hasn't it sold? Are there any deal-killer items the seller is aware of (foundation, flood, title, zoning, code violations)?
- Is there a deadline driving the sale (1031 exchange, divorce, estate, relocation)? That informs how much negotiation room exists.
- Schools are A-rated — typically a magnet for longer-tenancy family renters. What's the average tenant stay here, and is there a school-zone premium baked into asking?
- The area grade is low — what's the realistic commute time and amenity access for the typical tenant pool here? Any planned neighborhood developments (good or bad) we should know about?
- What's the average days-on-market for RENTAL listings here right now (not sales)? A rising rental-DOM trend means longer vacancies and softer asking-rent achievability than the comps imply.
- What's the recent tenant-quality profile in this submarket — average credit score on applications, eviction rate, late-payment / NSF rate, and stable-employment percentage? A property-management company in the area should have these aggregated.
- How much new for-sale + rental construction is in the pipeline within 1–3 miles? Heavy new supply typically softens prices + rents 12–24 months out; constrained supply supports both.
Investment metrics
- 1% rule
- 0.63% ✗
- Cap rate
- 4.77%
- Cash-on-cash
- -5.43%
- DSCR
- 0.76
- GRM
- 13.3
CMA / ARV
- ARV (median comp)
- $292,652
- List price
- $239,000
- Delta
- -18.33%
- Verdict
- UNDERPRICED
- Comps
- 20 within 1.0 mi
Show comp detail 8 sales within ~0.75 mi
| Address | Dist | Beds/Ba | Sqft | Sold | Price | $/sf | Match |
|---|---|---|---|---|---|---|---|
| 422 Marshall St | 0.17mi | 3/2.0 | 1,366 (+8%) | 10mo | $300,000 | $220 | 65 |
| 312 Marshall | 0.16mi | 4/1.5 (+1) | 1,405 (+12%) | 3mo | $234,000 | $167 | 63 |
| 809 Park St | 0.39mi | 3/2.0 | 1,204 (-4%) | 8mo | $300,000 | $249 | 63 |
| 25929 N Tumbleweed Ct | 0.64mi | 3/2.0 | 1,296 (+3%) | 3mo | $360,000 | $278 | 59 |
| 817 Park St | 0.40mi | 3/2.0 | 1,205 (-4%) | 13mo | $290,000 | $241 | 59 |
| 802 10th St | 0.43mi | 3/1.0 | 1,380 (+10%) | 11mo | $265,000 | $192 | 55 |
| 1015 Morgan St | 0.52mi | 3/2.0 | 1,158 (-8%) | 13mo | $300,000 | $259 | 47 |
| 925 Morgan St | 0.48mi | 3/2.0 | 1,444 (+15%) | 11mo | $310,000 | $215 | 40 |
Match score weights: distance 35% · size 25% · config 20% · recency 20%. Top-matched comps best support the ARV.
Projected returns pro-forma
-3.0% appreciation · 3.0% rent growth · sell at horizon
- IRR
- -25.6%
- Equity multiple
- 0.13×
- Total profit
- $-58,096
- Equity at exit
- $35,636
- IRR
- -22.2%
- Equity multiple
- -0.13×
- Total profit
- $-75,744
- Equity at exit
- $20,664
Cash invested: $66,920 (down + closing). Projections, not guarantees.
Landlord ↔ Tenant lean methodology
- Overall (STATE)
- 28 Tenant-Leaning
- State Washington
- 28 Tenant-Leaning · D+8
- County
- — inherits STATE
- City
- — inherits STATE
ZIP-level market 99122
- Home prices YoY
- -17.6%
- Active inventory
- 180
- Price-to-rent
- 13.3×
Monthly cashflow live
- Estimated rent
- $1,500 medium interval (Pro) →
- Mortgage (P&I)
- −$1,253
- Tax from tax record
- −$135 /mo · $1,619/yr
- Insurance
- −$100
- HOA
- −$0
- Vacancy / Maint / Mgmt
- −$315
- Net cashflow
- $-303
Break-even live
Sensitivity live
| Price | -10% $-168 | -5% $-235 | +0% $-303 | +5% $-371 | +10% $-438 |
|---|---|---|---|---|---|
| Rent | -10% $-421 | -5% $-362 | +0% $-303 | +5% $-244 | +10% $-184 |
| Rate | -1.0pp $-183 | -0.5pp $-242 | base $-303 | +0.5pp $-365 | +1.0pp $-428 |
UW: 25.0% down · 7.5% · 30yr · 1.5% tax · 5.0% vac · 8.0% maint · 8.0% mgmt
Financing live
Cash to close
- Down payment
- $59,750
- Closing costs
- $7,170
- Reserves months
- —
- Total cash needed
- —
Loan-product check · same deal, 3 products live
Conventional
25% down · 7.5% · 30yr
- Down + closing
- —
- Monthly P&I
- —
- Monthly cashflow
- —
- DSCR
- —
- Eligible?
- —
Personal DTI + credit; lowest rate.
DSCR
20% down · 8.5% · 30yr
- Down + closing
- —
- Monthly P&I
- —
- Monthly cashflow
- —
- DSCR
- —
- Eligible?
- —
No personal income docs; deal must DSCR.
Hard money
10% down · 12.0% · 12mo
- Down + closing
- —
- Monthly P&I
- —
- Monthly cashflow
- —
- DSCR
- —
- Eligible?
- —
Short-term bridge; refi at stabilization.
Rent comps 1 comps
| Address | Beds | Baths | Sqft | Rent | $/sqft | DOM | Units | Dist |
|---|---|---|---|---|---|---|---|---|
| 906 Ross St Apt 2 Davenport, WA | 2.0 | 2.0 | 900 | $1,500 | $1.67 | 24d | 1 | 0.64mi |
Listing history 20 events
-
2026-06-21days on market $239,000 Active 71 DOM
-
2026-06-21days on market $239,000 Active 70 DOM
-
2026-06-18days on market $239,000 Active 68 DOM
-
2026-06-17days on market $239,000 Active 67 DOM
-
2026-06-16days on market $239,000 Active 66 DOM
-
2026-06-15days on market $239,000 Active 65 DOM
-
2026-06-15days on market $239,000 Active 64 DOM
-
2026-06-13days on market $239,000 Active 63 DOM
-
2026-06-12days on market $239,000 Active 62 DOM
-
2026-06-09days on market $239,000 Active 59 DOM
-
2026-06-08days on market $239,000 Active 58 DOM
-
2026-06-08days on market $239,000 Active 57 DOM
-
2026-06-07days on market $239,000 Active 56 DOM
-
2026-06-03days on market $239,000 Active 53 DOM
-
2026-06-02days on market $239,000 Active 52 DOM
-
2026-06-01days on market $239,000 Active 51 DOM
-
2026-05-31days on market $239,000 Active 50 DOM
-
2026-04-07$239,000 Active 146-char remark
Show marketing remark (146 chars)
Cute little home in Davenport WA Cute and clean, 3 BR One Bath, fenced backyard, attached garage. With appliances. Close to schools and downtown.
-
2014-03-31soldstatus $108,000 154-char remark
Show marketing remark (154 chars)
Great home, well maintained and move in ready. Painted in designer colors, great backyard and deck for entertaining. Large kitchen, close to grade school.
-
2013-07-29$115,000 154-char remark
Show marketing remark (154 chars)
Great home, well maintained and move in ready. Painted in designer colors, great backyard and deck for entertaining. Large kitchen, close to grade school.
ⓘ Source: listings_history table (triggers on properties + properties_extension) + one-shot
backfill from property_details.listing_events for pre-trigger history.
Tax reassessment forecast WA · Resets to sale price
- Current annual tax
- $1,619 · $135/mo
- Projected year-2 tax
- $2,342 · $195/mo
- Expected delta
- +$723/yr (+$60/mo · 44.6%)
ⓘ Screening estimate from a state-policy table — verify with the county assessor before closing.
Climate risk First Street
- Flood 1/10 Low 0% chance over 30 yrs
- Wildfire 5/10 Major
- Heat 3/10 Moderate 7 d/yr ≥93°F today · 14 d/yr by 30 yrs out
- Wind 1/10 Low
- Air quality 8/10 Severe 13 unhealthy d/yr today · 16 by 30 yrs out
Nearby sold comps map
Loading sold comps map…
Walkable amenities ~0.75 mi
Loading nearby amenities…
Taxation est. · year 1
- Rental income
- $18,000
- − Mortgage interest
- −$13,388
- − Property taxes
- −$1,619
- − Insurance
- −$1,195
- − Repairs & maintenance
- −$1,440
- − Management
- −$1,440
- − Depreciation
- −$6,953
- Taxable loss
- −$8,035
- Est. tax savings @ 24.0%
- +$1,928
- After-tax cash flow
- $-1,706/yr
For passive investors: Depreciation is non-cash, so a rental often shows a tax loss while cash-flowing — sheltering income. Rental losses are passive: they offset passive income freely, and up to $25,000/yr can offset ordinary (W-2) income if you actively participate and your MAGI is under $100k (phasing out to $0 by $150k); unused losses carry forward. On sale, claimed depreciation is recaptured at up to 25%, and gains may owe capital-gains tax (a 1031 exchange can defer both). Figures are a year-1 estimate at your 24.0% rate — not tax advice; consult a CPA.
Schools (NCES district)
- District
- Davenport School District
- NCES district ID
- 5302010
- Math proficiency
- 63% ▼ -5.00%
- Reading proficiency
- 68% ▼ -5.00%
- Median HH income
- $52,713
- Composite
- 57.27/100
- National rank
- #2305
- State rank
- #34 of 291 in WA
Livability — Davenport
- Score
- 72/100
- State rank
- #213
- US rank
- #6059
Category grades
Schools grade is shown separately in the Schools card above.
Census & demographics
- Census place
- Davenport, WA
- Population (ZIP)
- 4,044
Population outlook (Lincoln County) Hauer SSP2
- Today (2025)
- 9,599 people
- By 2030
- 9,146 · -4.7%
- By 2040
- 8,298 · -13.6%
- By 2050
- 7,683 · -20.0%
- By 2075
- 6,790 · -29.3%
- By 2100
- 6,029 · -37.2%
Race, ethnicity, and origin ACS 2023
- Neighborhood character
- Predominantly White (86%)
- Race & ethnicity
- White 86% Two or more races 6% Hispanic / Latino 4% Native American 4%
- Common ancestry
- Portuguese 4% Italian 3% Slovak 2%
- Foreign-born
- 1% · Canada
- Languages at home
- 97% English-only · Spanish 1% Tagalog/Filipino 1%
Political lean MEDSL · Lincoln
- 2024 margin
- Solid R (+50.6) · D 23.6% · R 74.2% · Other 2.2%
- 2008→2024 swing
- -20.9pp toward R · 2008: -29.6pp · 2024: -50.6pp
- All cycles
- 2024: R+50.6 2020: R+48.9 2016: R+50.2 2012: R+40.9 2008: R+29.6
Not yet ingested
- Civics
- —
Market trends
- HPI YoY
- ▼ -57.76%
- Current HPI
- 270.3074
- Rent YoY
- —
- Metro
- —
- State GDP YoY
- ▲ 4.65%
- F500 in state
- 22
Industry mix (Fortune 500 HQ in WA)
| Industry | F500 HQs | Revenue |
|---|---|---|
| Retail | 2 | $269B |
|
||
| Technology / Retail | 1 | $638B |
|
||
| Technology | 1 | $245B |
|
||
| Telecommunications | 1 | $38B |
|
||
| Food / Beverage | 1 | $36B |
|
||
| Automotive / Trucks | 1 | $34B |
|
||
Price history
+107.8% since first listed3 events — show timeline
- 2026-04-07 Listed $239,000 Fizber.com
- 2014-03-31 Sold (MLS) $108,000 SPOKANEMLS as Distributed by MLS Grid
- 2013-07-29 Listed $115,000 SPOKANEMLS as Distributed by MLS Grid
Property tax history
+4.6%/yrLatest (2026): $1,619 · -1.4% YoY. Source: county tax records.
Cash-flow waterfall
monthlySold comps — $/sqft
last 12 mo · ≤1 miLoading sold comps…