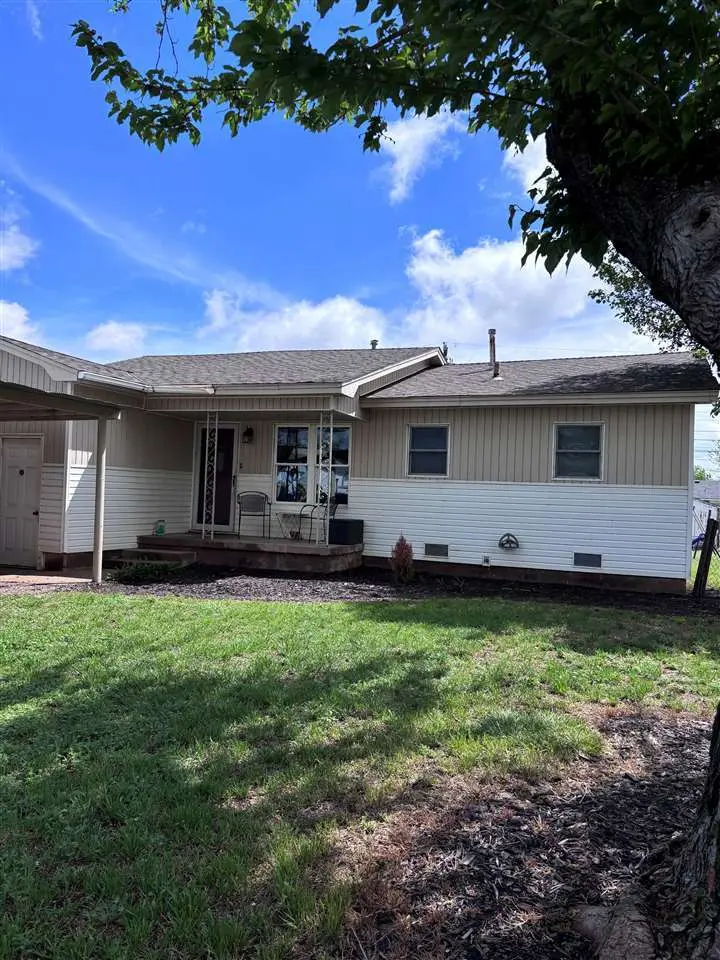
208 K St · Elgin, OK
Flood risk No data
- FEMA flood zone
- —
- Chance of flooding over 30 yrs
- —
- Est. flood insurance / yr
- —
Fire risk No data
- Est. fire insurance / yr
- —
Heat risk No data
- Hot days now (above threshold)
- —
- Hot days in 30 yrs
- —
Wind risk No data
- Chance of severe wind over 30 yrs
- —
Air-quality risk No data
- Unhealthy air days now
- —
- Unhealthy air days in 30 yrs
- —
Risk factors via First Street. Map © Google.
Why this score? — see what drove the A grade
The composite is a weighted blend of 9 inputs, each scored 0–100. Each bar is that input's sub-score; the figure is the points it added to the 100-point composite (weight × sub-score).
- Cash flow +30.0/30.0
- ARV discount +15.0/15.0
- 1% rule +10.0/10.0
- DSCR +10.0/10.0
- Appreciation +10.0/10.0
- Livability +3.7/5.0
- Schools +3.0/10.0
- Rent growth +2.5/5.0
- Condition / age +2.5/5.0
$112,000
🖨 Deal sheet (PDF) 📄 Offer letter ✓ Due diligence
Listing remarks
Welcome home to small-town charm in a tight-knit community where neighbors still look out for each other. Located within walking distance of the highly desirable Elgin Public Schools, this home offers comfort, character, and convenience all in one. Inside, you'll find beautiful original hardwood floors that bring warmth and timeless appeal throughout the home. Featuring 3 bedrooms plus a bonus room, there's flexibility for a home office, playroom, or extra space to fit your needs. With approximately 1,200 sq ft and 1 bathroom, the layout feels cozy yet functional, making it a great fit for first-time buyers, small families, investors, or anyone wanting to enjoy a welcoming community atmosph
Key facts
- 7,868 sq ft lot
- 2 parking spots
- Built 1960
Property features AI
Exterior
- Parking: Two parking spaces (covered); Two-car carport; No garage
- Utilities: Public water; Public sewer; Natural gas available
- Home design: Single-family residence; One level
- Construction: Vinyl siding
- Exterior features: Covered porch; Chain link fencing; Composition roof; Publicly maintained road frontage on a city street
Interior
- Kitchen: Cooktop; Refrigerator
- Flooring: Ceramic tile; Hardwood
- Bathrooms: One full bathroom
- Heating & cooling: Central heating; Heat pump; Central electric air conditioning
- Interior features: Cooktop; Refrigerator; Gas water heater; No fireplace
Neighborhood map
What this means for you Summary
Snapshot
- This is a 3-bed/1.0-bath single-family listed at $112k.
Deal economics
- At list price, monthly cash flow is $780 ($9k/yr) — positive.
- The deal already cash-flows at list — no discount required.
- Meets the 1% rule at list price ($2k rent vs $112k).
- Recommended offer: $109k (3.0% below list) — sets the bar for market timing.
- Cap rate 14.7% vs local median 5.1% in Elgin — top-decile yield for the area; either an underpriced asset or a hidden risk that comps aren't pricing in. Stress-test before assuming the spread holds.
Location & tenants
- Location reads 73/100 on livability (#17 in OK) — a middle-class / working-renter tenant base. Strengths: crime A+, housing A+, cost of living A; Watch: amenities F, commute F, health & safety F.
- Elgin (rural): math 29% / reading 36% proficiency, ranked #38 of 270 in OK (top 14%) — families likely to look elsewhere, expect single-tenant / working-renter base with shorter leases.
- Zoned schools: Elgin Es (math 36% / reading 33%, grade F, #168 of 845 statewide, top 24%, 945 students, 0% FRL); Elgin Ms (math 26% / reading 34%, grade F, #49 of 345 statewide, top 15%, 791 students, 0% FRL); Elgin Hs (math 27% / reading 47%, grade F, #42 of 447 statewide, top 10%, 771 students, 0% FRL) — zoned schools average 0% FRL vs 29% district-wide (29 pts lower); this property's tenant base skews higher-income than the district average.
- Market conditions: 96 active listings in the ZIP; 2 comparable units currently listed for rent nearby; solid renter incomes; 133 units permitted in Comanche County in 2024 (0 in 5+ unit buildings).
Forward outlook
- In year one you build about $12k of equity ($774 loan paydown + $11k appreciation (10.0% local appreciation)).
- Comanche County population projected to shrink 3% by 2050 — rents likely to lag national; underwrite the cash flow, not the appreciation.
- At projected returns (10.0% appreciation + 3.0% rent growth), your $31k cash investment doubles in ~2 years — after that, you're playing with house money.
- By year 3, paydown + projected appreciation supports a ~$30k cash-out refi (75% LTV) — recoverable capital for the next deal without selling this one.
Negotiation context
- It's been on market 34 days — a 3% lower offer ($109k) is reasonable based on typical stale-listing flexibility.
- Current owner paid $74k; list at $112k implies a 51% gain — meaningful room to come down on a strong offer.
Questions for the listing agent
- It's been on market 34 days. Have you received any prior offers? Is the seller open to a 3% concession, seller financing, or rate buy-down credit?
- Built in 1960 — when were the roof, HVAC, electrical panel, plumbing, and water heater last replaced?
- Is there a deadline driving the sale (1031 exchange, divorce, estate, relocation)? That informs how much negotiation room exists.
- What's the average days-on-market for RENTAL listings here right now (not sales)? A rising rental-DOM trend means longer vacancies and softer asking-rent achievability than the comps imply.
- What's the recent tenant-quality profile in this submarket — average credit score on applications, eviction rate, late-payment / NSF rate, and stable-employment percentage? A property-management company in the area should have these aggregated.
- How much new for-sale + rental construction is in the pipeline within 1–3 miles? Heavy new supply typically softens prices + rents 12–24 months out; constrained supply supports both.
Investment metrics
- 1% rule
- 1.67% ✓
- Cap rate
- 14.65%
- Cash-on-cash
- 29.86%
- DSCR
- 2.33
- GRM
- 5.0
CMA / ARV
- ARV (on-the-fly)
- $153,532
- Comps found
- 12
Show comp detail 12 sales within ~0.75 mi
| Address | Dist | Beds/Ba | Sqft | Sold | Price | $/sf | Match |
|---|---|---|---|---|---|---|---|
| 208 K St | 0.00mi | 3/1.0 | 1,200 (+2%) | 1mo | $112,000 | $93 | 95 |
| 106 Oak | 0.13mi | 3/2.0 | 1,200 (+2%) | 1mo | $118,000 | $98 | 85 |
| 107 Oak St | 0.10mi | 4/1.0 (+1) | 1,200 (+2%) | 1mo | $125,000 | $104 | 85 |
| 1105 4th Pl | 0.10mi | 3/1.5 | 1,100 (-6%) | 0mo | $159,000 | $145 | 83 |
| 203 Maple St | 0.04mi | 3/1.0 | 1,300 (+11%) | 6mo | $170,000 | $131 | 75 |
| 209 H St | 0.23mi | 2/2.0 (-1) | 1,200 (+2%) | 14mo | $73,500 | $61 | 65 |
| 304 Crestview Dr | 0.53mi | 3/2.0 | 1,200 (+2%) | 7mo | $185,000 | $154 | 62 |
| 70 NE Deerfield Dr | 0.46mi | 3/2.0 | 1,300 (+11%) | 1mo | $224,000 | $172 | 56 |
| 311 Crestview Dr | 0.59mi | 2/1.0 (-1) | 1,244 (+6%) | 3mo | $180,000 | $145 | 55 |
| 611 7th St | 0.41mi | 3/2.0 | 1,300 (+11%) | 5mo | $117,000 | $90 | 54 |
| 718 5th St | 0.22mi | 3/2.0 | 1,344 (+15%) | 9mo | $226,000 | $168 | 54 |
| 204 5th St | 0.57mi | 3/2.0 | 1,100 (-6%) | 13mo | $80,000 | $73 | 48 |
Match score weights: distance 35% · size 25% · config 20% · recency 20%. Top-matched comps best support the ARV.
Projected returns pro-forma
10.0% appreciation · 3.0% rent growth · sell at horizon
- IRR
- 47.0%
- Equity multiple
- 4.53×
- Total profit
- $110,676
- Equity at exit
- $100,898
- IRR
- 40.8%
- Equity multiple
- 10.15×
- Total profit
- $286,801
- Equity at exit
- $217,591
Cash invested: $31,360 (down + closing). Projections, not guarantees.
Landlord ↔ Tenant lean methodology
- Overall (STATE)
- 83 Strongly Landlord-Friendly
- State Oklahoma
- 83 Strongly Landlord-Friendly · R+20
- County
- — inherits STATE
- City
- — inherits STATE
ZIP-level market 73538
- Home prices YoY
- 22.9%
- Active inventory
- 96
- Price-to-rent
- 5.0×
Monthly cashflow live
- Estimated rent
- $1,869 medium interval (Pro) →
- Mortgage (P&I)
- −$587
- Tax from tax record
- −$62 /mo · $742/yr
- Insurance
- −$47
- HOA
- −$0
- Vacancy / Maint / Mgmt
- −$392
- Net cashflow
- $780
Break-even live
Sensitivity live
| Price | -10% $844 | -5% $812 | +0% $780 | +5% $749 | +10% $717 |
|---|---|---|---|---|---|
| Rent | -10% $633 | -5% $706 | +0% $780 | +5% $854 | +10% $928 |
| Rate | -1.0pp $837 | -0.5pp $809 | base $780 | +0.5pp $751 | +1.0pp $722 |
UW: 25.0% down · 7.5% · 30yr · 1.5% tax · 5.0% vac · 8.0% maint · 8.0% mgmt
Financing live
Cash to close
- Down payment
- $28,000
- Closing costs
- $3,360
- Reserves months
- —
- Total cash needed
- —
Loan-product check · same deal, 3 products live
Conventional
25% down · 7.5% · 30yr
- Down + closing
- —
- Monthly P&I
- —
- Monthly cashflow
- —
- DSCR
- —
- Eligible?
- —
Personal DTI + credit; lowest rate.
DSCR
20% down · 8.5% · 30yr
- Down + closing
- —
- Monthly P&I
- —
- Monthly cashflow
- —
- DSCR
- —
- Eligible?
- —
No personal income docs; deal must DSCR.
Hard money
10% down · 12.0% · 12mo
- Down + closing
- —
- Monthly P&I
- —
- Monthly cashflow
- —
- DSCR
- —
- Eligible?
- —
Short-term bridge; refi at stabilization.
Rent comps 2 comps
| Address | Beds | Baths | Sqft | Rent | $/sqft | DOM | Units | Dist |
|---|---|---|---|---|---|---|---|---|
| 107 Oak St Elgin, OK | 4.0 | 1.0 | 1300 | $1,295 | $1.00 | 13d | 1 | 0.09mi |
| 1201 Kensington Ln Elgin, OK | 2.0–3.0 | 2.0–2.5 | 1414 | $1,700 | $1.20 | 25d | 1 | 1.34mi |
Listing history 6 events
-
2026-05-19status Pending
-
2026-04-20historical Active Under Contract
-
2026-04-13$112,000 Active
-
2011-12-21soldstatus $74,000
-
2008-11-21soldstatus $58,000
-
2003-07-29soldstatus $51,000
ⓘ Source: listings_history table (triggers on properties + properties_extension) + one-shot
backfill from property_details.listing_events for pre-trigger history.
Tax reassessment forecast OK · Resets to sale price
- Current annual tax
- $742 · $62/mo
- Projected year-2 tax
- $1,008 · $84/mo
- Expected delta
- +$266/yr (+$22/mo · 35.8%)
ⓘ Screening estimate from a state-policy table — verify with the county assessor before closing.
Nearby sold comps map
Loading sold comps map…
Walkable amenities ~0.75 mi
Loading nearby amenities…
Taxation est. · year 1
- Rental income
- $22,422
- − Mortgage interest
- −$6,274
- − Property taxes
- −$742
- − Insurance
- −$560
- − Repairs & maintenance
- −$1,794
- − Management
- −$1,794
- − Depreciation
- −$3,258
- Taxable income
- $8,001
- Est. tax owed @ 24.0%
- −$1,920
- After-tax cash flow
- $7,443/yr
For passive investors: Depreciation is non-cash, so a rental often shows a tax loss while cash-flowing — sheltering income. Rental losses are passive: they offset passive income freely, and up to $25,000/yr can offset ordinary (W-2) income if you actively participate and your MAGI is under $100k (phasing out to $0 by $150k); unused losses carry forward. On sale, claimed depreciation is recaptured at up to 25%, and gains may owe capital-gains tax (a 1031 exchange can defer both). Figures are a year-1 estimate at your 24.0% rate — not tax advice; consult a CPA.
Schools (NCES district)
- District
- Elgin
- NCES district ID
- 4010710
- Math proficiency
- 29% ▼ -9.00%
- Reading proficiency
- 36% ▼ -5.00%
- Median HH income
- $65,900
- Composite
- 29.77/100
- National rank
- #6432
- State rank
- #38 of 270 in OK
Livability — Elgin
- Score
- 73/100
- State rank
- #17
- US rank
- #5411
Category grades
Schools grade is shown separately in the Schools card above.
Census & demographics
- Census place
- Elgin, OK
- County
- Comanche County · 96,361 people
- City population
- 7,128
- Metro
- Lawton, OK
- Population (ZIP)
- 7,128
- Household income
- $91,324
- Rent vs Own
- Severe rent burden
- 70.0
Population outlook (Comanche County) Hauer SSP2
- Today (2025)
- 124,518 people
- By 2030
- 124,231 · -0.2%
- By 2040
- 122,193 · -1.9%
- By 2050
- 120,368 · -3.3%
- By 2075
- 120,492 · -3.2%
- By 2100
- 123,113 · -1.1%
Race, ethnicity, and origin ACS 2023
- Neighborhood character
- Predominantly White (71%)
- Race & ethnicity
- White 71% Two or more races 15% Hispanic / Latino 13% Native American 4% Black 2% Asian 1%
- Hispanic origin (detail)
- Mexican 11% Puerto Rican 2%
- Common ancestry
- Slovak 5% Romanian 2% Serbian 1%
- Foreign-born
- 3% · Canada
- Languages at home
- 93% English-only · Spanish 4% German/W. Germanic 1%
Political lean MEDSL · Comanche
- 2024 margin
- Strong R (+23.3) · D 37.4% · R 60.7% · Other 1.9%
- 2008→2024 swing
- -5.8pp toward R · 2008: -17.5pp · 2024: -23.3pp
- All cycles
- 2024: R+23.3 2020: R+20.1 2016: R+23.7 2012: R+17.0 2008: R+17.5
Not yet ingested
- Civics
- —
Market trends
- HPI YoY
- ▲ 45.70%
- Current HPI
- 245.4249
- Rent YoY
- —
- Metro
- Lawton, OK
- State GDP YoY
- ▲ 1.55%
- F500 in state
- 6
Industry mix (Fortune 500 HQ in OK)
| Industry | F500 HQs | Revenue |
|---|---|---|
| Energy | 3 | $48B |
|
||
Price history
+119.6% since first listed6 events — show timeline
- 2026-05-19 Pending — LBRMLS
- 2026-04-20 Contingent — LBRMLS
- 2026-04-13 Listed $112,000 LBRMLS
- 2011-12-21 Sold (Public Records) $74,000 Public Records
- 2008-11-21 Sold (Public Records) $58,000 Public Records
- 2003-07-29 Sold (Public Records) $51,000 Public Records
Property tax history
+0.1%/yrLatest (2025): $742 · -0.4% YoY. Source: county tax records.
Cash-flow waterfall
monthlySold comps — $/sqft
last 12 mo · ≤1 miLoading sold comps…