 🏷️ Likely Rental
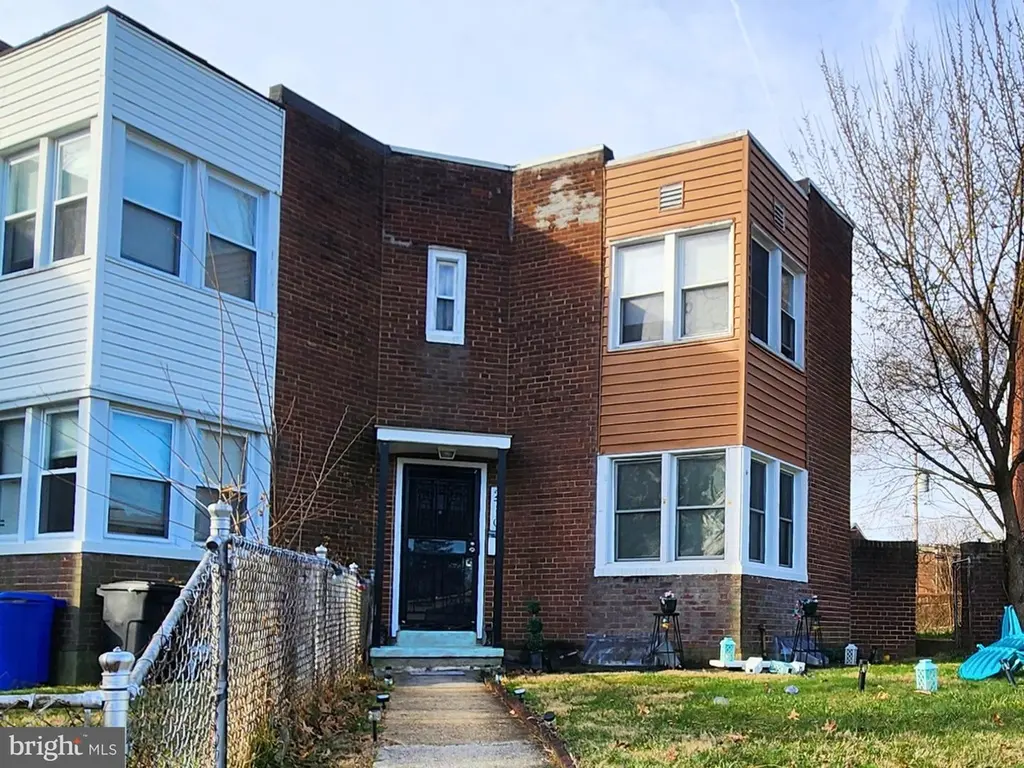
2710 Woodview Rd · Baltimore, MD
Flood risk 1/10 · Minimal
- FEMA flood zone
- X (unshaded)
- Chance of flooding over 30 yrs
- 0.0%
- Est. flood insurance / yr
- $473 – $860
Fire risk 1/10 · Minimal
- Est. fire insurance / yr
- $755 – $1,403
Heat risk 8/10 · Major
- Hot days now (above 102°F)
- 7 days/yr
- Hot days in 30 yrs
- 15 days/yr
Wind risk 6/10 · Moderate
- Chance of severe wind over 30 yrs
- 27.0%
Air-quality risk 4/10 · Minor
- Unhealthy air days now
- 5 days/yr
- Unhealthy air days in 30 yrs
- 7 days/yr
Risk factors via First Street. Map © Google.
Why this score? — see what drove the B+ grade
The composite is a weighted blend of 9 inputs, each scored 0–100. Each bar is that input's sub-score; the figure is the points it added to the 100-point composite (weight × sub-score).
- Cash flow +30.0/30.0
- ARV discount +15.0/15.0
- 1% rule +10.0/10.0
- DSCR +10.0/10.0
- Livability +3.8/5.0
- Rent growth +3.5/5.0
- Condition / age +2.5/5.0
- Schools +1.0/10.0
- Appreciation +0.0/10.0
$45,000
🖨 Deal sheet 📄 Offer letter ✓ Due diligence
Listing remarks MLS
ONLINE AUCTION: This auction takes place on the Ashland Auction Group website bidding platform. Bidding begins 5/22/2026 @ 10:00 AM. Bidding ends 5/26/2026 @ 12:30 PM. The list price is the suggested opening bid. Deposit: $10,000. 2-story townhouse located in the Cherry Hill neighborhood of Baltimore. JUST MINUTES from MedStar Harbor Hospital and Middle Branch Park. Easy access to major traffic artery Baltimore-Washington Parkway. Property is tenant occupied.
Key facts
- Middle branch park
- 2 story townhouse
- Built 1945
Tags
Neighborhood map
What this means for you Summary
Snapshot
- This is a 2-bed/1.0-bath townhouse listed at $45k.
Deal economics
- At list price, monthly cash flow is $933 ($11k/yr) — positive.
- The deal already cash-flows at list — no discount required.
- Meets the 1% rule at list price ($2k rent vs $45k).
- Recommended offer: $41k (9.0% below list) — sets the bar for market timing.
- Cap rate 31.2% vs local median 6.0% in Baltimore — top-decile yield for the area; either an underpriced asset or a hidden risk that comps aren't pricing in. Stress-test before assuming the spread holds.
Location & tenants
- Location reads 76/100 on livability (#90 in MD, #3,396 nationally) — a middle-class / working-renter tenant base. Strengths: amenities A+, commute A+, housing A+; Watch: schools D, crime F.
- Baltimore City Public Schools (urban): math 7% / reading 16% proficiency, ranked #24 of 24 in MD (top 100%) — low school quality limits family demand, transient renter base, plan for 1-2y turnover; 79% free/reduced lunch — lower-income household profile, screen leases tightly.
- Market conditions: Rents rising fast (+4.1%/yr); 165 active listings in the ZIP; 21 comparable units currently listed for rent nearby; rentals at typical pace (median 18d on market — plan ~3-4 weeks tenant-placement turnaround); 1,273 units permitted in Baltimore city in 2024 (1,104 in 5+ unit buildings).
- This rent runs 37% of the median local income ($54k/yr) — at the standard rent-burdened threshold; future hikes will face affordability resistance.
Forward outlook
- Local home prices are declining (-3.0%/yr); year-one equity from $311 of loan paydown is wiped out by about $1k of value loss. Plan a longer hold.
- Baltimore County population projected to shrink 4% by 2050 — rents likely to lag national; underwrite the cash flow, not the appreciation.
- At projected returns (-3.0% appreciation + 4.1% rent growth), your $13k cash investment doubles in ~2 years — after that, you're playing with house money.
Negotiation context
- It's been on market 93 days — a 9% lower offer ($41k) is reasonable based on typical stale-listing flexibility.
- 7 sale attempts since 13y ago with the ask held roughly flat each time — persistent listings suggest the price (not the market) is what's stuck; bring a comps-based counter.
Risks & watch-outs
- Watch-outs: property tax is 3.1% of price; built in 1945 — expect roof / HVAC / electrical / plumbing capex.
- Climate carrying-cost: major wind risk, 27% chance of damaging wind over 30y; extreme-heat days projected 7→15/yr by 2055 (HVAC capex compounding) — expect insurance premiums to compound above CPI over the hold.
Questions for the listing agent
- It's been on market 93 days. Have you received any prior offers? Is the seller open to a 9% concession, seller financing, or rate buy-down credit?
- Built in 1945 — when were the roof, HVAC, electrical panel, plumbing, and water heater last replaced?
- Property tax is high relative to price — has the assessment been appealed recently, and will the sale trigger a re-assessment?
- Why hasn't it sold? Are there any deal-killer items the seller is aware of (foundation, flood, title, zoning, code violations)?
- Is there a deadline driving the sale (1031 exchange, divorce, estate, relocation)? That informs how much negotiation room exists.
- Schools are D-rated, which usually means shorter tenancies and higher turnover. Who's the typical renter profile here, and what's been the actual vacancy rate?
- Crime grade is F in this area — have there been break-ins, vandalism, or insurance claims at this property in the last 3 years? What carrier currently insures it and at what premium?
- What's the average days-on-market for RENTAL listings here right now (not sales)? A rising rental-DOM trend means longer vacancies and softer asking-rent achievability than the comps imply.
- What's the recent tenant-quality profile in this submarket — average credit score on applications, eviction rate, late-payment / NSF rate, and stable-employment percentage? A property-management company in the area should have these aggregated.
- How much new for-sale + rental construction is in the pipeline within 1–3 miles? Heavy new supply typically softens prices + rents 12–24 months out; constrained supply supports both.
Investment metrics
- 1% rule
- 3.67% ✓
- Cap rate
- 31.17%
- Cash-on-cash
- 88.85%
- DSCR
- 4.95
- GRM
- 2.3
CMA / ARV
- ARV (median comp)
- $84,713
- List price
- $45,000
- Delta
- -46.88%
- Verdict
- UNDERPRICED
- Comps
- 20 within 1.0 mi
Show comp detail 8 sales within ~0.75 mi
| Address | Dist | Beds/Ba | Sqft | Sold | Price | $/sf | Match |
|---|---|---|---|---|---|---|---|
| 2847 Joseph Ave | 0.19mi | 3/1.5 (+1) | 1,116 (+5%) | 1mo | $235,000 | $211 | 75 |
| 628 Roundview Rd | 0.31mi | 3/1.0 (+1) | 1,024 (-4%) | 3mo | $85,100 | $83 | 72 |
| 2825 Round Rd | 0.13mi | 2/1.5 | 1,039 (-2%) | 20mo | $85,000 | $82 | 72 |
| 504 Roundview | 0.34mi | 3/1.5 (+1) | 1,024 (-4%) | 7mo | $98,000 | $96 | 66 |
| 2741 Bookert Dr | 0.06mi | 3/1.0 (+1) | 1,204 (+13%) | 12mo | $44,000 | $37 | 60 |
| 604 Cheraton Rd | 0.30mi | 3/1.5 (+1) | 1,174 (+10%) | 6mo | $95,000 | $81 | 57 |
| 2828 Waterview Ave | 0.54mi | 2/1.0 | 960 (-10%) | 8mo | $50,000 | $52 | 52 |
| 3011 Larue Sq E | 0.58mi | 3/1.0 (+1) | 960 (-10%) | 9mo | $100,000 | $104 | 44 |
Match score weights: distance 35% · size 25% · config 20% · recency 20%. Top-matched comps best support the ARV.
Projected returns pro-forma
-3.0% appreciation · 4.08% rent growth · sell at horizon
- IRR
- 90.8%
- Equity multiple
- 5.29×
- Total profit
- $54,006
- Equity at exit
- $6,710
- IRR
- 94.0%
- Equity multiple
- 11.43×
- Total profit
- $131,409
- Equity at exit
- $3,891
Cash invested: $12,600 (down + closing). Projections, not guarantees.
Landlord ↔ Tenant lean methodology
- Overall (CITY)
- 12 Strongly Tenant-Friendly
- State Maryland
- 27 Tenant-Leaning · D+14
- County
- — inherits STATE
- City Baltimore
- 12 Strongly Tenant-Friendly · D+58
ZIP-level market 21225
- Home prices YoY
- -31.9%
- Rents YoY
- 4.1%
- Active inventory
- 165
- Price-to-rent
- 2.3×
Monthly cashflow live
- Estimated rent
- $1,652 high interval (Pro) →
- Mortgage (P&I)
- −$236
- Tax from tax record
- −$118 /mo · $1,412/yr
- Insurance
- −$19
- HOA
- −$0
- Vacancy / Maint / Mgmt
- −$347
- Net cashflow
- $933
Break-even live
UW: 25.0% down · 7.5% · 30yr · 1.5% tax · 5.0% vac · 8.0% maint · 8.0% mgmt
Financing live
Cash to close
- Down payment
- $11,250
- Closing costs
- $1,350
- Reserves months
- —
- Total cash needed
- —
Loan-product check · same deal, 3 products live
Conventional
25% down · 7.5% · 30yr
- Down + closing
- —
- Monthly P&I
- —
- Monthly cashflow
- —
- DSCR
- —
- Eligible?
- —
Personal DTI + credit; lowest rate.
DSCR
20% down · 8.5% · 30yr
- Down + closing
- —
- Monthly P&I
- —
- Monthly cashflow
- —
- DSCR
- —
- Eligible?
- —
No personal income docs; deal must DSCR.
Hard money
10% down · 12.0% · 12mo
- Down + closing
- —
- Monthly P&I
- —
- Monthly cashflow
- —
- DSCR
- —
- Eligible?
- —
Short-term bridge; refi at stabilization.
Rent comps 21 comps
| Address | Beds | Baths | Sqft | Rent | $/sqft | DOM | Units | Dist |
|---|---|---|---|---|---|---|---|---|
| 2745 Round Rd Brooklyn, MD | 2.0 | 2.0 | 756 | $1,800 | $2.38 | 43d | 1 | 0.11mi |
| 2454 Terra Firma Rd Brooklyn, MD | 3.0 | 1.0 | 1024 | $1,650 | $1.61 | 14d | 1 | 0.20mi |
| 607 Cheraton Rd Brooklyn, MD | 3.0 | 3.0 | 1200 | $1,750 | $1.46 | 14d | 1 | 0.27mi |
| 511 Seagull Ave Brooklyn, MD | 2.0 | 1.0 | 756 | $1,550 | $2.05 | 23d | 1 | 0.50mi |
| 2868 Potee St Baltimore, MD | 1.0–3.0 | 1.0 | 720 | $1,392 | $1.93 | 2d | 22 | 0.56mi |
| 130 Reedbird Ave Brooklyn, MD | 2.0 | 1.0 | 1152 | $1,700 | $1.48 | 23d | 1 | 0.61mi |
| 3010 Alabama Ave Halethorpe, MD | 2.0 | 1.0 | 900 | $2,200 | $2.44 | 17d | 1 | 0.77mi |
| 2200 W Patapsco Ave Baltimore, MD | 3.0 | 1.0 | 890 | $1,569 | $1.76 | 43d | 1 | 1.06mi |
| 217 W Edgevale Rd Brooklyn, MD | 3.0 | 1.5 | 992 | $1,800 | $1.81 | 23d | 1 | 1.10mi |
| 49 Talbott St Brooklyn, MD | 2.0 | 1.0 | 1300 | $1,300 | $1.00 | 23d | 1 | 1.13mi |
| 2500 Insulator Dr Baltimore, MD | 3.0 | 1.0–2.0 | 988 | $3,816 | $3.86 | 2d | 152 | 1.16mi |
| 303 Arden Rd W Brooklyn, MD | 3.0 | 2.0 | 1388 | $2,500 | $1.80 | 17d | 1 | 1.22mi |
| 3513 Horton Ave Brooklyn, MD | 3.0 | 1.0 | 1020 | $1,600 | $1.57 | 17d | 1 | 1.35mi |
| 3004 Elizabeth Ave Unit 1 Baltimore, MD | 3.0 | 1.0 | 1024 | $1,395 | $1.36 | 4d | 1 | 1.37mi |
| 2600 W Patapsco Ave Baltimore, MD | 1.0–2.0 | 1.0 | 856 | $1,309 | $1.53 | 2d | 24 | 1.38mi |
| 3017 Janice Ave Baltimore, MD | 3.0 | 1.0 | 1024 | $1,995 | $1.95 | 23d | 1 | 1.40mi |
| 3569 4th St Brooklyn, MD | 2.0 | 1.5 | 1256 | $1,200 | $0.96 | 17d | 1 | 1.42mi |
| 2450 Rye St Baltimore, MD | 2.0 | 1.0–2.0 | 926 | $3,789 | $4.09 | 1d | 31 | 1.47mi |
| 250 Mission Blvd Baltimore, MD | 2.0 | 1.0–2.0 | 790 | $3,406 | $4.31 | 1d | 21 | 1.47mi |
| 1900 S Hanover St Baltimore, MD | 3.0 | 1.0–2.0 | 875 | $3,119 | $3.56 | 1d | 66 | 1.47mi |
| 902 Catawba Ct Halethorpe, MD | 3.0 | 1.0 | 906 | $1,495 | $1.65 | 21d | 1 | 1.48mi |
Listing history 38 events
-
2026-06-18days on market $45,000 Active 93 DOM
-
2026-06-17days on market $45,000 Active 92 DOM
-
2026-06-16days on market $45,000 Active 91 DOM
-
2026-06-15days on market $45,000 Active 90 DOM
-
2026-06-13days on market $45,000 Active 88 DOM
-
2026-06-09days on market $45,000 Active 84 DOM
-
2026-06-08days on market $45,000 Active 83 DOM
-
2026-06-07days on market $45,000 Active 82 DOM
-
2026-06-04days on market $45,000 Active 79 DOM
-
2026-06-03days on market $45,000 Active 78 DOM
-
2026-06-02days on market $45,000 Active 77 DOM
-
2026-06-01days on market $45,000 Active 76 DOM
-
2026-05-31days on market $45,000 Active 75 DOM
-
2026-03-17$45,000 Active 464-char remark
Show marketing remark (464 chars)
ONLINE AUCTION: This auction takes place on the Ashland Auction Group website bidding platform. Bidding begins 5/22/2026 @ 10:00 AM. Bidding ends 5/26/2026 @ 12:30 PM. The list price is the suggested opening bid. Deposit: $10,000. 2-story townhouse located in the Cherry Hill neighborhood of Baltimore. JUST MINUTES from MedStar Harbor Hospital and Middle Branch Park. Easy access to major traffic artery Baltimore-Washington Parkway. Property is tenant occupied.
-
2025-07-22historical
-
2025-06-19$105,000 Active
-
2025-06-12historical
-
2018-09-10soldstatus $50,000
-
2018-09-04historical
-
2018-09-04soldstatus $50,000 Closed
-
2018-09-04soldstatus $50,000 Sold
-
2018-07-30status Pending
-
2018-07-30status Contract
-
2018-07-21historical Active Under Contract
-
2018-07-21historical Contingent (Kick Out)
-
2018-07-17$55,000 Active
-
2018-07-17$55,000 Active
-
2014-12-02historical
-
2014-12-02soldstatus $20,000 Sold
-
2014-12-02soldstatus $20,000
-
2014-11-15status Contract
-
2014-11-15historical
-
2014-10-21price $25,000
-
2014-07-27price $49,900
-
2014-07-25status Active
-
2014-07-25historical Expired
-
2013-08-02$60,000 Active
-
2013-08-02$25,000
ⓘ Source: listings_history table (triggers on properties + properties_extension) + one-shot
backfill from property_details.listing_events for pre-trigger history.
Tax reassessment forecast MD · Partial reset (capped growth)
- Current annual tax
- $1,412 · $118/mo
- Projected year-2 tax
- $1,412 · $118/mo
- Expected delta
- $0/yr ($0/mo · 0.0%)
ⓘ Screening estimate from a state-policy table — verify with the county assessor before closing.
Climate risk First Street
- Flood 1/10 Low FEMA zone X (unshaded) · 0% chance over 30 yrs
- Wildfire 1/10 Low
- Heat 8/10 Severe 7 d/yr ≥102°F today · 15 d/yr by 30 yrs out
- Wind 6/10 Major 27% chance of damaging wind over 30 yrs
- Air quality 4/10 Moderate 5 unhealthy d/yr today · 7 by 30 yrs out
Nearby sold comps map
Loading sold comps map…
Walkable amenities ~0.75 mi
Loading nearby amenities…
Taxation est. · year 1
- Rental income
- $19,828
- − Mortgage interest
- −$2,521
- − Property taxes
- −$1,412
- − Insurance
- −$225
- − Repairs & maintenance
- −$1,586
- − Management
- −$1,586
- − Depreciation
- −$1,309
- Taxable income
- $11,189
- Est. tax owed @ 24.0%
- −$2,685
- After-tax cash flow
- $8,510/yr
For passive investors: Depreciation is non-cash, so a rental often shows a tax loss while cash-flowing — sheltering income. Rental losses are passive: they offset passive income freely, and up to $25,000/yr can offset ordinary (W-2) income if you actively participate and your MAGI is under $100k (phasing out to $0 by $150k); unused losses carry forward. On sale, claimed depreciation is recaptured at up to 25%, and gains may owe capital-gains tax (a 1031 exchange can defer both). Figures are a year-1 estimate at your 24.0% rate — not tax advice; consult a CPA.
Schools (NCES district)
- District
- Baltimore City Public Schools
- NCES district ID
- 2400090
- Math proficiency
- 7% ▼ -9.00%
- Reading proficiency
- 16% ▼ -5.00%
- Median HH income
- $42,108
- Composite
- 10.08/100
- National rank
- #9805
- State rank
- #24 of 24 in MD
Livability — Baltimore
- Score
- 76/100
- State rank
- #90
- US rank
- #3396
Category grades
Schools grade is shown separately in the Schools card above.
Census & demographics
- Census place
- Baltimore, MD
- County
- Anne Arundel County · 535,653 people
- City population
- 588,727
- Metro
- Baltimore-Columbia-Towson, MD
- Population (ZIP)
- 34,062
- Household income
- $54,020
- Rent vs Own
- Severe rent burden
- 1440.0
Population outlook (Baltimore County) Hauer SSP2
- Today (2025)
- 624,249 people
- By 2030
- 621,541 · -0.4%
- By 2040
- 609,756 · -2.3%
- By 2050
- 597,249 · -4.3%
- By 2075
- 552,236 · -11.5%
- By 2100
- 513,934 · -17.7%
Race, ethnicity, and origin ACS 2023
- Neighborhood character
- Diverse neighborhood (Simpson 0.68)
- Race & ethnicity
- Black 42% White 32% Hispanic / Latino 20% Two or more races 8% Native American 3% Asian 2%
- Hispanic origin (detail)
- Mexican 5% Puerto Rican 1%
- Common ancestry
- Romanian 2% Lithuanian 1% Iranian 1%
- Foreign-born
- 12% · Canada, China
- Languages at home
- 81% English-only · Spanish 16% Other Indo-European 1% French/Haitian/Cajun 1%
Political lean MEDSL · Baltimore
- 2024 margin
- Solid D (+73.0) · D 85.2% · R 12.2% · Other 2.6%
- 2008→2024 swing
- -2.5pp toward R · 2008: 75.5pp · 2024: 73.0pp
- All cycles
- 2024: D+73.0 2020: D+76.6 2016: D+74.6 2012: D+76.4 2008: D+75.5
Not yet ingested
- Civics
- —
Market trends
- HPI YoY
- ▼ -119.44%
- Current HPI
- 254.5089
- Rent YoY
- ▲ 4.08%
- Metro
- Baltimore-Columbia-Towson, MD
- State GDP YoY
- ▲ 2.97%
- F500 in state
- 12
Industry mix (Fortune 500 HQ in MD)
| Industry | F500 HQs | Revenue |
|---|---|---|
| Aerospace / Defense | 1 | $71B |
|
||
| Utilities | 1 | $25B |
|
||
| Hotels | 1 | $24B |
|
||
| Consumer Goods | 1 | $7B |
|
||
| Real Estate | 1 | $6B |
|
||
| Chemicals | 1 | $2B |
|
||
Price history
+80.0% since first listed25 events — show timeline
- 2026-03-17 Listed $45,000 BRIGHT MLS
- 2025-07-22 Listing Removed — BRIGHT MLS
- 2025-06-19 Listed $105,000 BRIGHT MLS
- 2025-06-12 Coming Soon — BRIGHT MLS
- 2018-09-10 Sold (Public Records) $50,000 Public Records
- 2018-09-04 Listing Removed — BRIGHT MLS
- 2018-09-04 Sold (MLS) $50,000 MRIS
- 2018-09-04 Sold (MLS) $50,000 BRIGHT MLS
- 2018-07-30 Pending — BRIGHT MLS
- 2018-07-30 Pending — MRIS
- 2018-07-21 Contingent — BRIGHT MLS
- 2018-07-21 Contingent — MRIS
- 2018-07-17 Listed $55,000 MRIS
- 2018-07-17 Listed $55,000 BRIGHT MLS
- 2014-12-02 Delisted — MRIS
- 2014-12-02 Sold (MLS) $20,000 BRIGHT MLS
- 2014-12-02 Sold (MLS) $20,000 MRIS
- 2014-11-15 Pending — MRIS
- 2014-11-15 Listing Removed — BRIGHT MLS
- 2014-10-21 Price Changed $25,000 MRIS
- 2014-07-27 Price Changed $49,900 MRIS
- 2014-07-25 Relisted — MRIS
- 2014-07-25 Delisted — MRIS
- 2013-08-02 Listed $60,000 MRIS
- 2013-08-02 Listed $25,000 BRIGHT MLS
Property tax history
-1.1%/yrLatest (2025): $1,412 · +9.1% YoY. Source: county tax records.
Cash-flow waterfall
monthlySold comps — $/sqft
last 12 mo · ≤1 miLoading sold comps…