2208 W Baseline Ave #76 · Apache Junction, AZ
Flood risk 1/10 · Minimal
- FEMA flood zone
- X (unshaded)
- Chance of flooding over 30 yrs
- 0.0%
- Est. flood insurance / yr
- $507 – $1,088
Fire risk 5/10 · Moderate
- Est. fire insurance / yr
- $610 – $1,132
Heat risk 9/10 · Severe
- Hot days now (above 111°F)
- 6 days/yr
- Hot days in 30 yrs
- 14 days/yr
Wind risk 1/10 · Minimal
- Chance of severe wind over 30 yrs
- —
Air-quality risk 3/10 · Minor
- Unhealthy air days now
- 2 days/yr
- Unhealthy air days in 30 yrs
- 3 days/yr
Risk factors via First Street. Map © Google.
Why this score? — see what drove the B grade
The composite is a weighted blend of 9 inputs, each scored 0–100. Each bar is that input's sub-score; the figure is the points it added to the 100-point composite (weight × sub-score).
- Cash flow +30.0/30.0
- ARV discount +14.7/15.0
- 1% rule +10.0/10.0
- DSCR +10.0/10.0
- Condition / age +3.8/5.0
- Livability +3.3/5.0
- Rent growth +1.6/5.0
- Schools +1.5/10.0
- Appreciation +0.0/10.0
$99,900
🖨 Deal sheet 📄 Offer letter ✓ Due diligence
Listing remarks
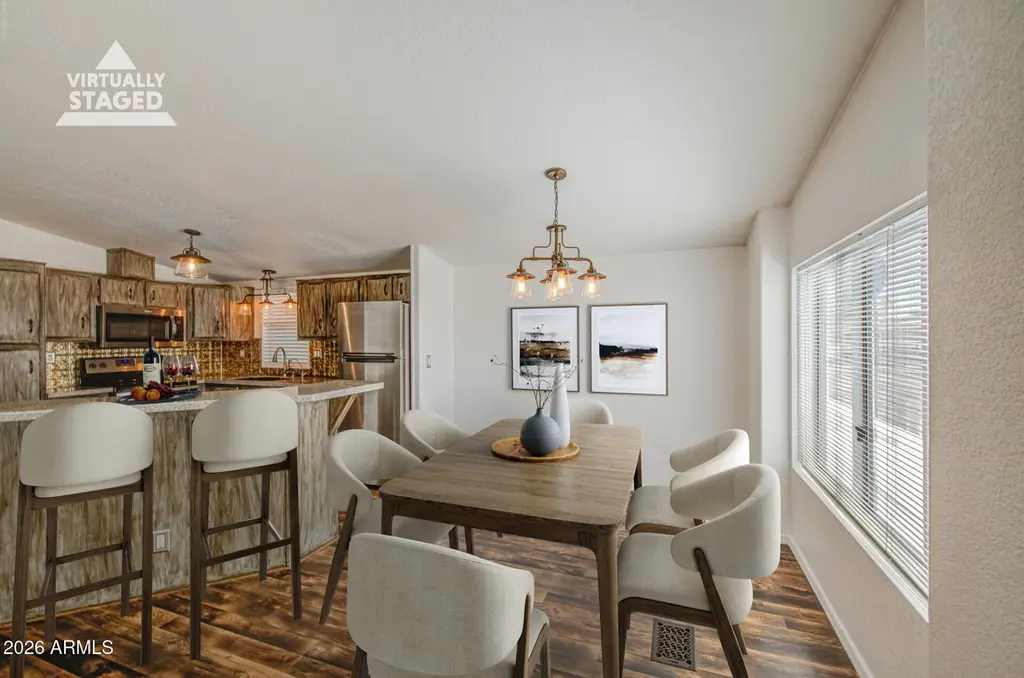
Welcome to this vacant double-wide mobile home nestled in a gated 55+ community! Enter to see vaulted ceilings, carpet flooring in all the right rooms, and a cozy fireplace that adds warmth and charm to the family room. The kitchen has quartz counters, a pantry, essential cooking appliances, and ample space for meal prep and storage. Continue into the comfortable main bedroom, including its own private bathroom for added convenience. Outside, you'll find a covered patio perfect for relaxing, while the storage shed provides extra room for tools and belongings. The property also includes two covered carport spaces for your vehicles! Residents enjoy access to a clubhouse, sparkling pool, sooth
Key facts
- Gated community
- Quartz counters
- Cozy fireplace
Tags
Property features AI
Finance
- Other: Directions: Head west onto Baseline Ave, turn right to access mobile park. Once inside look for unit 76.
- HOA & community: Land lease of $850 per month; Association covers sewer, water, grounds maintenance, and street maintenance; No visible truck/trailer/RV/boat allowed; Community amenities include pool, heated spa, pickleball courts, biking/walking paths, and a fitness center
Exterior
- Parking: 2 covered parking spaces; 2 carport spaces
- Security: Gated community
- Utilities: City water; Public sewer
- Home design: Manufactured/mobile home; Leasehold ownership
- Construction: Vertical siding; Wood frame construction; Painted exterior; Composition roof; Building area reported by owner
- Exterior features: Shed(s); Storage; Gravel/stone front and back; Private maintained road and city maintained road; Asphalt road surface
Interior
- Kitchen: Laminate counters; Pantry; Refrigerator; Dishwasher
- Bedrooms: Up to 3 bedrooms
- Flooring: Carpet; Laminate
- Bathrooms: 2 full bathrooms
- Heating & cooling: Electric heating; Central air; Ceiling fans
- Interior features: High-speed internet; Double vanity; No interior steps; Vaulted ceilings; Pantry; 3/4 bath in master bedroom; Laminate counters; Storage
- Laundry & utility: Laundry inside with washer/dryer hookup only
Neighborhood map
What this means for you Summary
Snapshot
- This is a 2-bed/2.0-bath manufactured listed at $100k. Condition is rated good.
Deal economics
- At list price, monthly cash flow is $911 ($11k/yr) — positive.
- The deal already cash-flows at list — no discount required.
- Meets the 1% rule at list price ($2k rent vs $100k).
- Recommended offer: $97k (3.0% below list) — sets the bar for market timing.
- Cap rate 17.2% vs local median 3.5% in Apache Junction — top-decile yield for the area; either an underpriced asset or a hidden risk that comps aren't pricing in. Stress-test before assuming the spread holds.
Location & tenants
- Location reads 66/100 on livability (#70 in AZ) — a middle-class / working-renter tenant base. Strengths: cost of living A+, housing A+; Watch: crime D+, schools F, amenities F.
- Apache Junction Unified District (4443) (suburban): math 15% / reading 20% proficiency, ranked #195 of 249 in AZ (top 78%) — low school quality limits family demand, transient renter base, plan for 1-2y turnover.
- Market conditions: Rents falling (-3.5%/yr); 455 active listings in the ZIP; 7 comparable units currently listed for rent nearby; rentals at typical pace (median 24d on market — plan ~3-4 weeks tenant-placement turnaround); 9,504 units permitted in Pinal County in 2024 (776 in 5+ unit buildings).
- This rent runs 42% of the median local income ($58k/yr) — at the standard rent-burdened threshold; future hikes will face affordability resistance.
Forward outlook
- Local home prices are declining (-3.0%/yr); year-one equity from $691 of loan paydown is wiped out by about $3k of value loss. Plan a longer hold.
- At projected returns (-3.0% appreciation + 0.0% rent growth), your $28k cash investment doubles in ~4 years — after that, you're playing with house money.
Negotiation context
- It's been on market 35 days — a 3% lower offer ($97k) is reasonable based on typical stale-listing flexibility.
- 2 sale attempts with the ask held roughly flat each time — persistent listings suggest the price (not the market) is what's stuck; bring a comps-based counter.
Risks & watch-outs
- Climate carrying-cost: moderate wildfire risk; extreme-heat days projected 6→14/yr by 2055 (HVAC capex compounding) — expect insurance premiums to compound above CPI over the hold.
Questions for the listing agent
- It's been on market 35 days. Have you received any prior offers? Is the seller open to a 3% concession, seller financing, or rate buy-down credit?
- Is there a deadline driving the sale (1031 exchange, divorce, estate, relocation)? That informs how much negotiation room exists.
- Schools are F-rated, which usually means shorter tenancies and higher turnover. Who's the typical renter profile here, and what's been the actual vacancy rate?
- Crime grade is D in this area — have there been break-ins, vandalism, or insurance claims at this property in the last 3 years? What carrier currently insures it and at what premium?
- What's the average days-on-market for RENTAL listings here right now (not sales)? A rising rental-DOM trend means longer vacancies and softer asking-rent achievability than the comps imply.
- What's the recent tenant-quality profile in this submarket — average credit score on applications, eviction rate, late-payment / NSF rate, and stable-employment percentage? A property-management company in the area should have these aggregated.
- How much new for-sale + rental construction is in the pipeline within 1–3 miles? Heavy new supply typically softens prices + rents 12–24 months out; constrained supply supports both.
Investment metrics
- 1% rule
- 2.03% ✓
- Cap rate
- 17.24%
- Cash-on-cash
- 39.09%
- DSCR
- 2.74
- GRM
- 4.1
CMA / ARV
- ARV (on-the-fly)
- $118,900
- Comps found
- 12
Show comp detail 12 sales within ~0.75 mi
| Address | Dist | Beds/Ba | Sqft | Sold | Price | $/sf | Match |
|---|---|---|---|---|---|---|---|
| 2208 W Baseline Ave #190 | 0.15mi | 2/2.0 | 1,400 (-3%) | 12mo | $105,000 | $75 | 78 |
| 2208 W Baseline Ave #87 | 0.15mi | 2/2.0 | 1,344 (-7%) | 8mo | $105,000 | $78 | 74 |
| 2208 W Baseline Ave #137 | 0.00mi | 2/2.0 | 1,232 (-15%) | 2mo | $50,000 | $41 | 74 |
| 2208 W Baseline Ave | 0.03mi | 2/2.0 | 1,344 (-7%) | 21mo | $110,000 | $82 | 69 |
| 2208 W Baseline Ave #146 | 0.15mi | 2/2.0 | 1,568 (+8%) | 13mo | $125,500 | $80 | 68 |
| 2208 W Baseline Ave #67 | 0.15mi | 2/2.0 | 1,232 (-15%) | 2mo | $110,000 | $89 | 66 |
| 3700 S Ironwood Dr Lot 134 | 0.36mi | 3/2.0 (+1) | 1,484 (+2%) | 10mo | $40,000 | $27 | 66 |
| 2208 W Baseline Ave #56 | 0.15mi | 3/2.0 (+1) | 1,323 (-9%) | 14mo | $130,000 | $98 | 62 |
| 2208 W Baseline Ave #153 | 0.15mi | 3/2.0 (+1) | 1,568 (+8%) | 16mo | $115,000 | $73 | 62 |
| 2208 W Baseline Ave #9 | 0.15mi | 3/2.0 (+1) | 1,248 (-14%) | 18mo | $135,000 | $108 | 50 |
| 3700 S Ironwood Dr #72 | 0.36mi | 2/2.0 | 1,300 (-10%) | 21mo | $140,000 | $108 | 49 |
| 3700 S Ironwood Dr #79 | 0.36mi | 3/2.0 (+1) | 1,248 (-14%) | 11mo | $190,000 | $152 | 46 |
Match score weights: distance 35% · size 25% · config 20% · recency 20%. Top-matched comps best support the ARV.
Projected returns pro-forma
-3.0% appreciation · 0.0% rent growth · sell at horizon
- IRR
- 31.9%
- Equity multiple
- 2.28×
- Total profit
- $35,938
- Equity at exit
- $14,895
- IRR
- 37.3%
- Equity multiple
- 3.97×
- Total profit
- $83,188
- Equity at exit
- $8,638
Cash invested: $27,972 (down + closing). Projections, not guarantees.
Landlord ↔ Tenant lean methodology
- Overall (STATE)
- 87 Strongly Landlord-Friendly
- State Arizona
- 87 Strongly Landlord-Friendly · R+3
- County
- — inherits STATE
- City
- — inherits STATE
ZIP-level market 85120
- Home prices YoY
- -29.0%
- Rents YoY
- -3.5%
- Active inventory
- 455
- Price-to-rent
- 4.1×
Monthly cashflow live
- Estimated rent
- $2,027 high interval (Pro) →
- Mortgage (P&I)
- −$524
- Tax est. 1.5%
- −$125 /mo · $1,498/yr
- Insurance
- −$42
- HOA
- −$0
- Vacancy / Maint / Mgmt
- −$426
- Net cashflow
- $911
Break-even live
UW: 25.0% down · 7.5% · 30yr · 1.5% tax · 5.0% vac · 8.0% maint · 8.0% mgmt
Financing live
Cash to close
- Down payment
- $24,975
- Closing costs
- $2,997
- Reserves months
- —
- Total cash needed
- —
Loan-product check · same deal, 3 products live
Conventional
25% down · 7.5% · 30yr
- Down + closing
- —
- Monthly P&I
- —
- Monthly cashflow
- —
- DSCR
- —
- Eligible?
- —
Personal DTI + credit; lowest rate.
DSCR
20% down · 8.5% · 30yr
- Down + closing
- —
- Monthly P&I
- —
- Monthly cashflow
- —
- DSCR
- —
- Eligible?
- —
No personal income docs; deal must DSCR.
Hard money
10% down · 12.0% · 12mo
- Down + closing
- —
- Monthly P&I
- —
- Monthly cashflow
- —
- DSCR
- —
- Eligible?
- —
Short-term bridge; refi at stabilization.
Rent comps 7 comps
| Address | Beds | Baths | Sqft | Rent | $/sqft | DOM | Units | Dist |
|---|---|---|---|---|---|---|---|---|
| 3454 S Warner Dr Apache Junction, AZ | 3.0 | 2.0 | 1300 | $2,500 | $1.92 | 24d | 1 | 0.38mi |
| 2101 S Yellow Wood #45 Mesa, AZ | 2.0 | 2.0 | 1081 | $1,649 | $1.53 | 43d | 1 | 0.94mi |
| 2101 S Yellow Wood #60 Mesa, AZ | 2.0 | 2.0 | 1371 | $2,600 | $1.90 | 1d | 1 | 0.94mi |
| 3000 W Southern Ave Apache Junction, AZ | 1.0–2.0 | 1.0–2.0 | 836 | $1,719 | $2.05 | 1d | 12 | 1.08mi |
| 2065 W 20th Ave Apache Junction, AZ | 3.0 | 2.0 | 1110 | $1,850 | $1.67 | 12d | 1 | 1.10mi |
| 2043 S Thunderbird Dr Apache Junction, AZ | 3.0 | 2.0 | 1348 | $1,925 | $1.43 | 24d | 1 | 1.22mi |
| 1446 S Palo Verde Dr Unit apache Apache Junction, AZ | 2.0 | 2.0 | 1210 | $1,700 | $1.40 | 24d | 1 | 1.45mi |
Listing history 17 events
-
2026-06-18days on market $99,900 Active 35 DOM
-
2026-06-17days on market $99,900 Active 34 DOM
-
2026-06-16days on market $99,900 Active 33 DOM
-
2026-06-15days on market $99,900 Active 32 DOM
-
2026-06-13days on market $99,900 Active 30 DOM
-
2026-06-09days on market $99,900 Active 26 DOM
-
2026-06-08days on market $99,900 Active 25 DOM
-
2026-06-07days on market $99,900 Active 24 DOM
-
2026-06-04days on market $99,900 Active 21 DOM
-
2026-06-03days on market $99,900 Active 20 DOM
-
2026-06-02days on market $99,900 Active 19 DOM
-
2026-06-01days on market $99,900 Active 18 DOM
-
2026-05-31days on market $99,900 Active 17 DOM
-
2026-05-13$99,900 Active
-
2026-05-08historical
-
2026-03-06price $99,900
-
2026-02-01$110,000 Active
ⓘ Source: listings_history table (triggers on properties + properties_extension) + one-shot
backfill from property_details.listing_events for pre-trigger history.
Climate risk First Street
- Flood 1/10 Low FEMA zone X (unshaded) · 0% chance over 30 yrs
- Wildfire 5/10 Major
- Heat 9/10 Extreme 6 d/yr ≥111°F today · 14 d/yr by 30 yrs out
- Wind 1/10 Low
- Air quality 3/10 Moderate 2 unhealthy d/yr today · 3 by 30 yrs out
Nearby sold comps map
Loading sold comps map…
Walkable amenities ~0.75 mi
Loading nearby amenities…
Taxation est. · year 1
- Rental income
- $24,328
- − Mortgage interest
- −$5,596
- − Property taxes
- −$1,498
- − Insurance
- −$500
- − Repairs & maintenance
- −$1,946
- − Management
- −$1,946
- − Depreciation
- −$2,906
- Taxable income
- $9,936
- Est. tax owed @ 24.0%
- −$2,385
- After-tax cash flow
- $8,550/yr
For passive investors: Depreciation is non-cash, so a rental often shows a tax loss while cash-flowing — sheltering income. Rental losses are passive: they offset passive income freely, and up to $25,000/yr can offset ordinary (W-2) income if you actively participate and your MAGI is under $100k (phasing out to $0 by $150k); unused losses carry forward. On sale, claimed depreciation is recaptured at up to 25%, and gains may owe capital-gains tax (a 1031 exchange can defer both). Figures are a year-1 estimate at your 24.0% rate — not tax advice; consult a CPA.
Condition & rehab AI · 12 photos
This double-wide mobile home is in good condition with cosmetic updates needed for resale and rental value. The property offers a cozy and functional living space with a covered patio and storage shed.
Value-add opportunities
- Resale Paint exterior — Enhances curb appeal
- Rental Replace carpets — Improves comfort and reduces allergens
Renovation cost estimate screening
Value-add ROI direction
- Resale Paint exterior — Enhances curb appeal ↑
- Rental Replace carpets — Improves comfort and reduces allergens ↑
ⓘ Cost ranges are severity-bucket heuristics (US national rule-of-thumb). Get contractor quotes + a written scope before underwriting a rehab budget.
Schools (NCES district)
- District
- Apache Junction Unified District (4443)
- NCES district ID
- 0400790
- Math proficiency
- 15% ▼ -17.00%
- Reading proficiency
- 20% ▼ -13.00%
- Median HH income
- $44,930
- Composite
- 15.34/100
- National rank
- #9325
- State rank
- #195 of 249 in AZ
Livability — Apache Junction
- Score
- 66/100
- State rank
- #70
- US rank
- #11242
Category grades
Schools grade is shown separately in the Schools card above.
Census & demographics
- Census place
- Apache Junction, AZ
- County
- Pinal County · 399,947 people
- City population
- 56,611
- Metro
- Phoenix-Mesa-Chandler, AZ
- Population (ZIP)
- 31,191
- Household income
- $57,786
- Rent vs Own
- Severe rent burden
- 686.0
Population outlook (Pinal County) Hauer SSP2
- Today (2025)
- 437,574 people
- By 2030
- 446,903 · +2.1%
- By 2040
- 452,589 · +3.4%
- By 2050
- 444,126 · +1.5%
- By 2075
- 430,300 · -1.7%
- By 2100
- 393,536 · -10.1%
Race, ethnicity, and origin ACS 2023
- Neighborhood character
- Predominantly White (77%)
- Race & ethnicity
- White 77% Hispanic / Latino 16% Two or more races 10% Asian 1%
- Hispanic origin (detail)
- Mexican 13%
- Common ancestry
- Romanian 3% Lithuanian 3% Portuguese 3%
- Foreign-born
- 7% · Canada
- Languages at home
- 89% English-only · Spanish 8% Tagalog/Filipino 1%
Political lean MEDSL · Pinal
- 2024 margin
- Strong R (+22.1) · D 38.5% · R 60.6%
- 2008→2024 swing
- -7.6pp toward R · 2008: -14.5pp · 2024: -22.1pp
- All cycles
- 2024: R+22.1 2020: R+17.3 2016: R+19.3 2012: R+17.1 2008: R+14.5
Not yet ingested
- Civics
- —
Market trends
- HPI YoY
- ▼ -128.31%
- Current HPI
- 313.4666
- Rent YoY
- ▼ -3.50%
- Metro
- Phoenix-Mesa-Chandler, AZ
- State GDP YoY
- ▲ 4.54%
- F500 in state
- 20
Industry mix (Fortune 500 HQ in AZ)
| Industry | F500 HQs | Revenue |
|---|---|---|
| Technology | 2 | $13B |
|
||
| Mining / Metals | 1 | $23B |
|
||
| Environmental Services | 1 | $16B |
|
||
| Metals / Steel | 1 | $14B |
|
||
| Technology Distribution | 1 | $9B |
|
||
| Homebuilding | 1 | $8B |
|
||
Price history
-9.2% since first listed4 events — show timeline
- 2026-05-13 Listed $99,900 ARMLS
- 2026-05-08 Listing Removed — ARMLS
- 2026-03-06 Price Changed $99,900 ARMLS
- 2026-02-01 Listed $110,000 ARMLS
Cash-flow waterfall
monthlySold comps — $/sqft
last 12 mo · ≤1 miLoading sold comps…