400 E South St Lot 0 · Marcellus, MI
Flood risk 1/10 · Minimal
- FEMA flood zone
- X (unshaded)
- Chance of flooding over 30 yrs
- 0.0%
- Est. flood insurance / yr
- $507 – $1,088
Fire risk 2/10 · Minimal
- Est. fire insurance / yr
- $784 – $1,456
Heat risk 2/10 · Minimal
- Hot days now (above 99°F)
- 7 days/yr
- Hot days in 30 yrs
- 16 days/yr
Wind risk 2/10 · Minimal
- Chance of severe wind over 30 yrs
- —
Air-quality risk 2/10 · Minimal
- Unhealthy air days now
- 1 days/yr
- Unhealthy air days in 30 yrs
- 2 days/yr
Risk factors via First Street. Map © Google.
Why this score? — see what drove the B- grade
The composite is a weighted blend of 9 inputs, each scored 0–100. Each bar is that input's sub-score; the figure is the points it added to the 100-point composite (weight × sub-score).
- Cash flow +30.0/30.0
- 1% rule +10.0/10.0
- DSCR +10.0/10.0
- ARV discount +8.5/15.0
- Livability +3.7/5.0
- Schools +2.7/10.0
- Rent growth +2.5/5.0
- Condition / age +2.5/5.0
- Appreciation +0.0/10.0
$64,900
🖨 Deal sheet 📄 Offer letter ✓ Due diligence
Listing remarks MLS
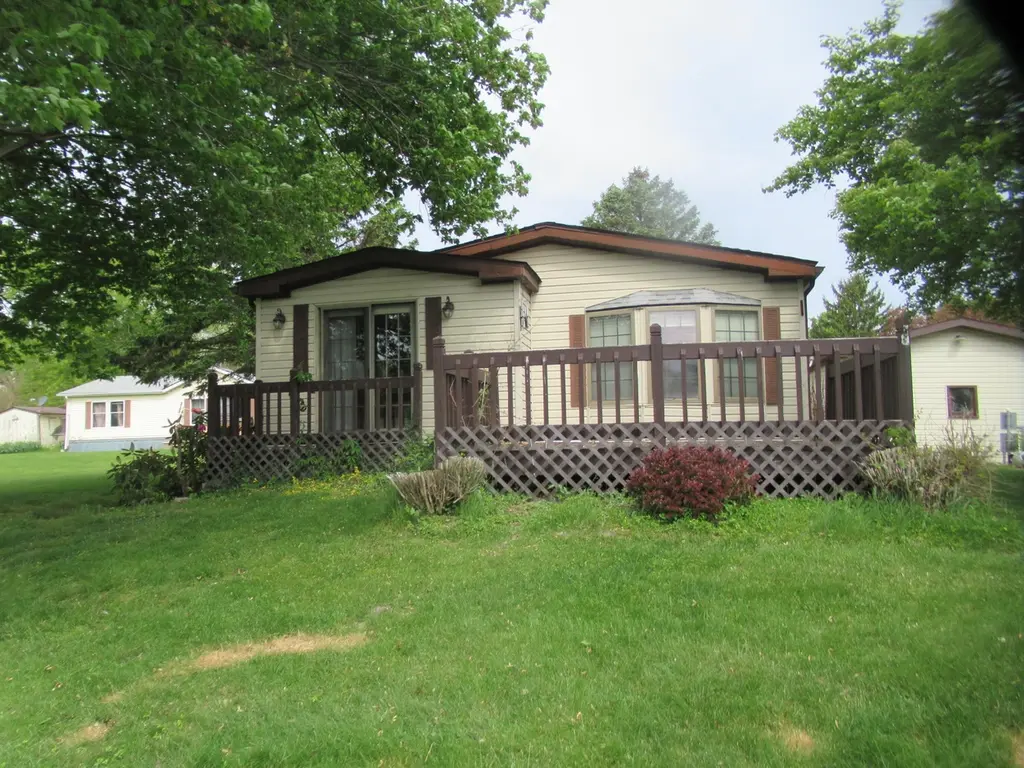
Bluegill Estates - Two Bedroom, Two Bath manufactured home with One Car Detached Garage. New roof Dec. 2025. Lot Rent is $600, Sewer/water/trash is +/-$100. Potential owners must apply to the park and are subject to Bluegill Estates rules & regulations.
Key facts
- Garage
- Built 1988
- Listed 169 days
Neighborhood map
What this means for you Summary
Snapshot
- This is a 2-bed/2.0-bath single-family listed at $65k.
Deal economics
- At list price, monthly cash flow is $474 ($6k/yr) — positive.
- The deal already cash-flows at list — no discount required.
- Meets the 1% rule at list price ($1k rent vs $65k).
- Recommended offer: $57k (12.0% below list) — sets the bar for market timing.
Location & tenants
- Location reads 73/100 on livability (#202 in MI) — a middle-class / working-renter tenant base. Strengths: cost of living A+, housing A+, health & safety A+; Watch: schools C-, amenities F, commute F.
- Marcellus Community Schools (rural): math 25% / reading 38% proficiency, ranked #332 of 540 in MI (top 62%) — families likely to look elsewhere, expect single-tenant / working-renter base with shorter leases.
- Market conditions: 39 active listings in the ZIP; 128 units permitted in Cass County in 2024 (0 in 5+ unit buildings).
Forward outlook
- Local home prices are declining (-3.0%/yr); year-one equity from $449 of loan paydown is wiped out by about $2k of value loss. Plan a longer hold.
- Cass County population projected at -20% by 2050 — secular population decline; favor cash flow + early exit over multi-decade hold.
- At projected returns (-3.0% appreciation + 3.0% rent growth), your $18k cash investment doubles in ~4 years — after that, you're playing with house money.
Negotiation context
- It's been on market 170 days — a 12% lower offer ($57k) is reasonable based on typical stale-listing flexibility.
- 17 sale attempts since 26y ago; this cycle's ask has dropped $5k (7%) from the opening price — seller is motivated, your offer sets the floor, not the list.
Questions for the listing agent
- It's been on market 170 days. Have you received any prior offers? Is the seller open to a 12% concession, seller financing, or rate buy-down credit?
- Why hasn't it sold? Are there any deal-killer items the seller is aware of (foundation, flood, title, zoning, code violations)?
- Is there a deadline driving the sale (1031 exchange, divorce, estate, relocation)? That informs how much negotiation room exists.
- What's the average days-on-market for RENTAL listings here right now (not sales)? A rising rental-DOM trend means longer vacancies and softer asking-rent achievability than the comps imply.
- What's the recent tenant-quality profile in this submarket — average credit score on applications, eviction rate, late-payment / NSF rate, and stable-employment percentage? A property-management company in the area should have these aggregated.
- How much new for-sale + rental construction is in the pipeline within 1–3 miles? Heavy new supply typically softens prices + rents 12–24 months out; constrained supply supports both.
Investment metrics
- 1% rule
- 1.66% ✓
- Cap rate
- 15.05%
- Cash-on-cash
- 31.28%
- DSCR
- 2.39
- GRM
- 5.0
CMA / ARV
- ARV (median comp)
- $66,360
- List price
- $64,900
- Delta
- -2.20%
- Verdict
- FAIR
- Comps
- 7 within 1.0 mi
Show comp detail 12 sales within ~0.75 mi
| Address | Dist | Beds/Ba | Sqft | Sold | Price | $/sf | Match |
|---|---|---|---|---|---|---|---|
| 172 Elm St | 0.28mi | 2/2.0 | 1,176 (-2%) | 10mo | $175,000 | $149 | 75 |
| 180 S Snyder St | 0.30mi | 3/2.0 (+1) | 1,176 (-2%) | 4mo | $218,500 | $186 | 75 |
| 278 W Arbor St W | 0.63mi | 2/2.0 | 1,226 (+2%) | 7mo | $195,000 | $159 | 61 |
| 393 E Arbor St | 0.24mi | 2/1.0 | 1,048 (-13%) | 5mo | $90,000 | $86 | 59 |
| 279 E Arbor St | 0.29mi | 3/1.0 (+1) | 1,300 (+8%) | 13mo | $185,000 | $142 | 53 |
| 290 S Maple St | 0.27mi | 2/1.0 | 1,095 (-9%) | 22mo | $183,000 | $167 | 50 |
| 589 S Centre St | 0.36mi | 3/1.0 (+1) | 1,332 (+11%) | 12mo | $100,000 | $75 | 46 |
| 138 E Read St | 0.52mi | 3/1.0 (+1) | 1,320 (+10%) | 6mo | $122,500 | $93 | 45 |
| 317 E Woodland St | 0.20mi | 3/1.0 (+1) | 1,372 (+14%) | 17mo | $191,000 | $139 | 44 |
| 305 E Dibble St | 0.32mi | 3/1.5 (+1) | 1,346 (+12%) | 18mo | $131,500 | $98 | 43 |
| 290 N Maple St | 0.48mi | 3/1.0 (+1) | 1,322 (+10%) | 11mo | $157,000 | $119 | 42 |
| 257 E Read St | 0.48mi | 3/2.0 (+1) | 1,354 (+13%) | 11mo | $52,000 | $38 | 42 |
Match score weights: distance 35% · size 25% · config 20% · recency 20%. Top-matched comps best support the ARV.
Projected returns pro-forma
-3.0% appreciation · 3.0% rent growth · sell at horizon
- IRR
- 26.1%
- Equity multiple
- 2.08×
- Total profit
- $19,629
- Equity at exit
- $9,677
- IRR
- 33.7%
- Equity multiple
- 4.07×
- Total profit
- $55,835
- Equity at exit
- $5,611
Cash invested: $18,172 (down + closing). Projections, not guarantees.
Landlord ↔ Tenant lean methodology
- Overall (STATE)
- 62 Landlord-Friendly
- State Michigan
- 62 Landlord-Friendly · EVEN
- County
- — inherits STATE
- City
- — inherits STATE
ZIP-level market 49067
- Home prices YoY
- -34.1%
- Active inventory
- 39
- Price-to-rent
- 5.0×
Monthly cashflow live
- Estimated rent
- $1,079 medium interval (Pro) →
- Mortgage (P&I)
- −$340
- Tax from tax record
- −$11 /mo · $131/yr
- Insurance
- −$27
- HOA
- −$0
- Vacancy / Maint / Mgmt
- −$226
- Net cashflow
- $474
Break-even live
UW: 25.0% down · 7.5% · 30yr · 1.5% tax · 5.0% vac · 8.0% maint · 8.0% mgmt
Financing live
Cash to close
- Down payment
- $16,225
- Closing costs
- $1,947
- Reserves months
- —
- Total cash needed
- —
Loan-product check · same deal, 3 products live
Conventional
25% down · 7.5% · 30yr
- Down + closing
- —
- Monthly P&I
- —
- Monthly cashflow
- —
- DSCR
- —
- Eligible?
- —
Personal DTI + credit; lowest rate.
DSCR
20% down · 8.5% · 30yr
- Down + closing
- —
- Monthly P&I
- —
- Monthly cashflow
- —
- DSCR
- —
- Eligible?
- —
No personal income docs; deal must DSCR.
Hard money
10% down · 12.0% · 12mo
- Down + closing
- —
- Monthly P&I
- —
- Monthly cashflow
- —
- DSCR
- —
- Eligible?
- —
Short-term bridge; refi at stabilization.
Listing history 50 events
-
2026-06-18days on market $64,900 Active 170 DOM
-
2026-06-17days on market $64,900 Active 169 DOM
-
2026-06-16days on market $64,900 Active 168 DOM
-
2026-06-15days on market $64,900 Active 167 DOM
-
2026-06-13days on market $64,900 Active 165 DOM
-
2026-06-12days on market $64,900 Active 164 DOM
-
2026-06-09days on market $64,900 Active 161 DOM
-
2026-06-08days on market $64,900 Active 160 DOM
-
2026-06-07days on market $64,900 Active 159 DOM
-
2026-06-04days on market $64,900 Active 155 DOM
-
2026-06-02days on market $64,900 Active 154 DOM
-
2026-06-01days on market $64,900 Active 153 DOM
-
2026-05-31days on market $64,900 Active 152 DOM
-
2026-05-31days on market $64,900 Active 151 DOM
-
2026-05-12price $64,900 259-char remark
Show marketing remark (261 chars)
Bluegill Estates - Two Bedroom, Two Bath manufactured home with One Car Detached Garage. New roof Dec. 2025. Lot Rent is $600, Sewer/water/trash is +/-$100. Potential owners must apply to the park and are subject to Bluegill Estates rules & regulations.
-
2026-05-12price $64,900 261-char remark
Show marketing remark (261 chars)
Bluegill Estates - Two Bedroom, Two Bath manufactured home with One Car Detached Garage. New roof Dec. 2025. Lot Rent is $600, Sewer/water/trash is +/-$100. Potential owners must apply to the park and are subject to Bluegill Estates rules & regulations.
-
2026-05-12price $64,900
Show marketing remark (261 chars)
Bluegill Estates - Two Bedroom, Two Bath manufactured home with One Car Detached Garage. New roof Dec. 2025. Lot Rent is $600, Sewer/water/trash is +/-$100. Potential owners must apply to the park and are subject to Bluegill Estates rules & regulations.
-
2025-12-30$69,900 Active 261-char remark
Show marketing remark (261 chars)
Bluegill Estates - Two Bedroom, Two Bath manufactured home with One Car Detached Garage. New roof Dec. 2025. Lot Rent is $600, Sewer/water/trash is +/-$100. Potential owners must apply to the park and are subject to Bluegill Estates rules & regulations.
-
2025-12-29$69,900 Active 259-char remark
Show marketing remark (259 chars)
Bluegill Estates - Two Bedroom, Two Bath manufactured home with One Car Detached Garage. New roof Dec. 2025. Lot Rent is $600, Sewer/water/trash is +/-$100. Potential owners must apply to the park and are subject to Bluegill Estates rules & regulations.
-
2025-12-29$69,900 Active
Show marketing remark (259 chars)
Bluegill Estates - Two Bedroom, Two Bath manufactured home with One Car Detached Garage. New roof Dec. 2025. Lot Rent is $600, Sewer/water/trash is +/-$100. Potential owners must apply to the park and are subject to Bluegill Estates rules & regulations.
-
2025-03-14soldstatus $70,000 Closed
-
2025-03-14soldstatus $70,000 Sold
-
2025-01-30historical Active - Backup Offers Accepted
-
2025-01-29historical Accepting Backup Offers
-
2024-11-23$79,900 Active
-
2024-11-23$79,900 Active
-
2008-11-24soldstatus $35,900
-
2008-11-06$39,900
-
2008-09-12soldstatus $35,000
-
2007-12-04$39,900
-
2002-08-28historical
-
2002-08-28historical
-
2002-08-19soldstatus $35,000
-
2002-08-19soldstatus $35,000
-
2002-08-13$47,700
-
2002-08-13$47,700
-
2002-07-05$39,000
-
2002-07-05$39,000
-
2000-11-07historical
-
2000-11-07historical
-
2000-11-07historical
-
2000-11-07historical
-
2000-11-07historical
-
2000-11-07historical
-
2000-10-04$49,000
-
2000-07-25$48,900
-
2000-07-25$48,900
-
2000-05-25$33,700
-
2000-05-25$33,700
-
2000-05-08$39,900
ⓘ Source: listings_history table (triggers on properties + properties_extension) + one-shot
backfill from property_details.listing_events for pre-trigger history.
Tax reassessment forecast MI · Partial reset (capped growth)
- Current annual tax
- $131 · $11/mo
- Projected year-2 tax
- $565 · $47/mo
- Expected delta
- +$434/yr (+$36/mo · 331.6%)
ⓘ Screening estimate from a state-policy table — verify with the county assessor before closing.
Climate risk First Street
- Flood 1/10 Low FEMA zone X (unshaded) · 0% chance over 30 yrs
- Wildfire 2/10 Low
- Heat 2/10 Low 7 d/yr ≥99°F today · 16 d/yr by 30 yrs out
- Wind 2/10 Low
- Air quality 2/10 Low 1 unhealthy d/yr today · 2 by 30 yrs out
Nearby sold comps map
Loading sold comps map…
Walkable amenities ~0.75 mi
Loading nearby amenities…
Taxation est. · year 1
- Rental income
- $12,942
- − Mortgage interest
- −$3,635
- − Property taxes
- −$131
- − Insurance
- −$324
- − Repairs & maintenance
- −$1,035
- − Management
- −$1,035
- − Depreciation
- −$1,888
- Taxable income
- $4,893
- Est. tax owed @ 24.0%
- −$1,174
- After-tax cash flow
- $4,511/yr
For passive investors: Depreciation is non-cash, so a rental often shows a tax loss while cash-flowing — sheltering income. Rental losses are passive: they offset passive income freely, and up to $25,000/yr can offset ordinary (W-2) income if you actively participate and your MAGI is under $100k (phasing out to $0 by $150k); unused losses carry forward. On sale, claimed depreciation is recaptured at up to 25%, and gains may owe capital-gains tax (a 1031 exchange can defer both). Figures are a year-1 estimate at your 24.0% rate — not tax advice; consult a CPA.
Schools (NCES district)
- District
- Marcellus Community Schools
- NCES district ID
- 2622740
- Math proficiency
- 25% ▼ -8.00%
- Reading proficiency
- 38% ▼ -6.00%
- Median HH income
- $49,318
- Composite
- 27.33/100
- National rank
- #6988
- State rank
- #332 of 540 in MI
Livability — Marcellus
- Score
- 73/100
- State rank
- #202
- US rank
- #5150
Category grades
Schools grade is shown separately in the Schools card above.
Census & demographics
- Census place
- Marcellus, MI
- Population (ZIP)
- 4,031
Population outlook (Cass County) Hauer SSP2
- Today (2025)
- 49,919 people
- By 2030
- 48,320 · -3.2%
- By 2040
- 44,230 · -11.4%
- By 2050
- 39,852 · -20.2%
- By 2075
- 31,440 · -37.0%
- By 2100
- 23,914 · -52.1%
Race, ethnicity, and origin ACS 2023
- Neighborhood character
- Predominantly White (93%)
- Race & ethnicity
- White 93% Two or more races 3% Hispanic / Latino 1%
- Common ancestry
- Romanian 4% Italian 4% Iranian 3%
- Foreign-born
- 1% · China
Political lean MEDSL · Cass
- 2024 margin
- Solid R (+33.9) · D 32.5% · R 66.4% · Other 1.1%
- 2008→2024 swing
- -38.0pp toward R · 2008: 4.1pp · 2024: -33.9pp
- All cycles
- 2024: R+33.9 2020: R+28.9 2016: R+29.9 2012: R+13.7 2008: D+4.1
Not yet ingested
- Civics
- —
Market trends
- HPI YoY
- ▼ -97.32%
- Current HPI
- 188.0562
- Rent YoY
- —
- Metro
- —
- State GDP YoY
- ▲ 1.37%
- F500 in state
- 28
Industry mix (Fortune 500 HQ in MI)
| Industry | F500 HQs | Revenue |
|---|---|---|
| Automotive Parts | 3 | $48B |
|
||
| Automotive | 2 | $372B |
|
||
| Chemicals | 1 | $45B |
|
||
| Automotive Retail | 1 | $29B |
|
||
| Healthcare / Medical Devices | 1 | $23B |
|
||
| Automotive Technology | 1 | $20B |
|
||
Price history
+62.7% since first listed36 events — show timeline
- 2026-05-12 Price Changed $64,900 MiRealSource-MiMLS
- 2026-05-12 Price Changed $64,900 REALCOMP
- 2026-05-12 Price Changed $64,900 SW Michigan MLS
- 2025-12-30 Listed $69,900 REALCOMP
- 2025-12-29 Listed $69,900 SW Michigan MLS
- 2025-12-29 Listed $69,900 MiRealSource-MiMLS
- 2025-03-14 Sold (MLS) $70,000 SW Michigan MLS
- 2025-03-14 Sold (MLS) $70,000 MiRealSource-MiMLS
- 2025-01-30 Contingent — SW Michigan MLS
- 2025-01-29 Contingent — MiRealSource-MiMLS
- 2024-11-23 Listed $79,900 SW Michigan MLS
- 2024-11-23 Listed $79,900 MiRealSource-MiMLS
- 2008-11-24 Sold (MLS) $35,900 SW Michigan MLS
- 2008-11-06 Listed $39,900 SW Michigan MLS
- 2008-09-12 Sold (MLS) $35,000 SW Michigan MLS
- 2007-12-04 Listed $39,900 SW Michigan MLS
- 2002-08-28 Listing Removed — SW Michigan MLS
- 2002-08-28 Listing Removed — REALCOMP
- 2002-08-19 Sold (MLS) $35,000 REALCOMP
- 2002-08-19 Sold (MLS) $35,000 SW Michigan MLS
- 2002-08-13 Listed $47,700 SW Michigan MLS
- 2002-08-13 Listed $47,700 REALCOMP
- 2002-07-05 Listed $39,000 REALCOMP
- 2002-07-05 Listed $39,000 SW Michigan MLS
- 2000-11-07 Listing Removed — SW Michigan MLS
- 2000-11-07 Listing Removed — REALCOMP
- 2000-11-07 Listing Removed — REALCOMP
- 2000-11-07 Listing Removed — SW Michigan MLS
- 2000-11-07 Listing Removed — REALCOMP
- 2000-11-07 Listing Removed — REALCOMP
- 2000-10-04 Listed $49,000 REALCOMP
- 2000-07-25 Listed $48,900 SW Michigan MLS
- 2000-07-25 Listed $48,900 REALCOMP
- 2000-05-25 Listed $33,700 SW Michigan MLS
- 2000-05-25 Listed $33,700 REALCOMP
- 2000-05-08 Listed $39,900 REALCOMP
Property tax history
-6.3%/yrLatest (2025): $131 · -47.4% YoY. Source: county tax records.
Cash-flow waterfall
monthlySold comps — $/sqft
last 12 mo · ≤1 miLoading sold comps…