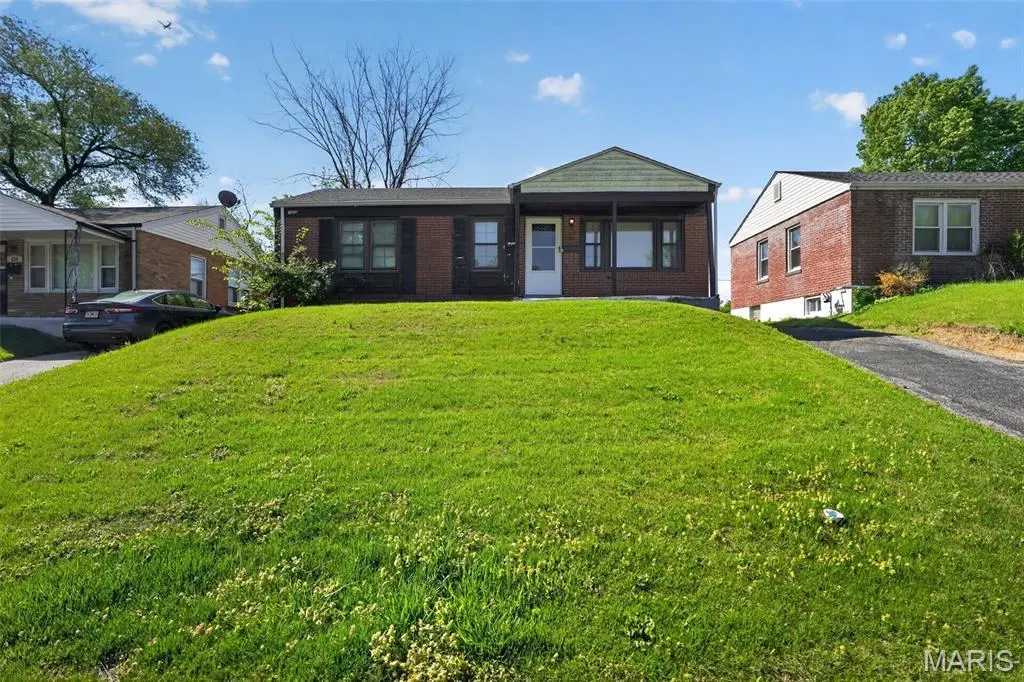
238 Emerling Dr · Cool Valley, MO
Flood risk 1/10 · Minimal
- FEMA flood zone
- X (unshaded)
- Chance of flooding over 30 yrs
- 0.0%
- Est. flood insurance / yr
- $473 – $860
Fire risk 1/10 · Minimal
- Est. fire insurance / yr
- $1,054 – $1,958
Heat risk 5/10 · Moderate
- Hot days now (above 106°F)
- 7 days/yr
- Hot days in 30 yrs
- 21 days/yr
Wind risk 2/10 · Minimal
- Chance of severe wind over 30 yrs
- 1.0%
Air-quality risk 4/10 · Minor
- Unhealthy air days now
- 4 days/yr
- Unhealthy air days in 30 yrs
- 5 days/yr
Risk factors via First Street. Map © Google.
Why this score? — see what drove the B grade
The composite is a weighted blend of 9 inputs, each scored 0–100. Each bar is that input's sub-score; the figure is the points it added to the 100-point composite (weight × sub-score).
- Cash flow +29.1/30.0
- ARV discount +15.0/15.0
- DSCR +10.0/10.0
- 1% rule +7.9/10.0
- Rent growth +3.8/5.0
- Livability +3.6/5.0
- Condition / age +2.5/5.0
- Schools +1.2/10.0
- Appreciation +0.0/10.0
$99,900
🖨 Deal sheet 📄 Offer letter ✓ Due diligence
Listing remarks MLS
Excellent investment opportunity located in Cool Valley. Entering through the front door you will see beautiful hardwoods in the large living room. 2 bedrooms are located on the main floor along with the main bathroom. Nice white kitchen with refrigerator, stove, and dishwasher. Dining room has potential to be converted to bedroom #3. Partially finished basement with two separate rooms for offices/storage and a large common room perfect for entertainment. The full bathroom in the basement is a bonus. Previously rented at $825/month
Key facts
- 6,499 sq ft lot
- Built 1953
- Listed 13 days
Property features AI
Finance
- Financial info: Lease not considered
Exterior
- Parking: Driveway
- Utilities: Public water; Public sewer; Electric service (other)
- Home design: Single-family residence; One story; House structure
- Construction: Brick construction; Composition roof; Slab foundation; Built (year per public records)
- Exterior features: Level lot; Paved road access
Interior
- Kitchen: Dishwasher; Gas range; Refrigerator
- Bedrooms: 3 bedrooms (all on the main level)
- Flooring: Wood flooring
- Bathrooms: 2 full bathrooms
- Heating & cooling: Other heating; Central air conditioning
- Interior features: Full basement
Neighborhood map
What this means for you Summary
Snapshot
- This is a 3-bed/2.0-bath single-family listed at $100k.
Deal economics
- At list price, monthly cash flow is $345 ($4k/yr) — positive.
- The deal already cash-flows at list — no discount required.
- Meets the 1% rule at list price ($1k rent vs $100k).
Location & tenants
- Location reads 71/100 on livability (#116 in MO) — a middle-class / working-renter tenant base. Strengths: commute A+, cost of living A+, housing A+; Watch: amenities F, health & safety F.
- Ferguson-Florissant R-II (suburban): math 7% / reading 20% proficiency, ranked #311 of 324 in MO (top 96%) — low school quality limits family demand, transient renter base, plan for 1-2y turnover; 70% free/reduced lunch — lower-income household profile, screen leases tightly.
- Zoned schools: Mccluer High (math 0% / reading 17%, grade F, #511 of 521 statewide, top 98%, 1,181 students, 100% FRL) — zoned schools average 100% FRL vs 70% district-wide (30 pts higher); higher-poverty schools than district average — tighter screening recommended.
- Market conditions: Rents rising fast (+5.2%/yr); 23 active listings in the ZIP; 35 comparable units currently listed for rent nearby; rentals at typical pace (median 24d on market — plan ~3-4 weeks tenant-placement turnaround); 46% of comp listings sitting > 30 days — soft ceiling on asking rent; lower-income renter base — watch delinquency; 920 units permitted in St. Louis County in 2024 (250 in 5+ unit buildings).
- This rent runs 36% of the median local income ($43k/yr) — at the standard rent-burdened threshold; future hikes will face affordability resistance.
Forward outlook
- Local home prices are declining (-3.0%/yr); year-one equity from $691 of loan paydown is wiped out by about $3k of value loss. Plan a longer hold.
- At projected returns (-3.0% appreciation + 5.2% rent growth), your $28k cash investment doubles in ~7 years — after that, you're playing with house money.
Negotiation context
- Only 13 days on market — expect competitive offers; lowballing is unlikely to land.
- 3 sale attempts since 12y ago with the ask held roughly flat each time — persistent listings suggest the price (not the market) is what's stuck; bring a comps-based counter.
- Current owner paid $48k; list at $100k implies a 107% gain — meaningful room to come down on a strong offer.
Risks & watch-outs
- Watch-outs: built in 1953 — expect roof / HVAC / electrical / plumbing capex.
- Climate carrying-cost: extreme-heat days projected 7→21/yr by 2055 (HVAC capex compounding) — expect insurance premiums to compound above CPI over the hold.
Questions for the listing agent
- Built in 1953 — when were the roof, HVAC, electrical panel, plumbing, and water heater last replaced?
- Is there a deadline driving the sale (1031 exchange, divorce, estate, relocation)? That informs how much negotiation room exists.
- Schools are D-rated, which usually means shorter tenancies and higher turnover. Who's the typical renter profile here, and what's been the actual vacancy rate?
- What's the average days-on-market for RENTAL listings here right now (not sales)? A rising rental-DOM trend means longer vacancies and softer asking-rent achievability than the comps imply.
- What's the recent tenant-quality profile in this submarket — average credit score on applications, eviction rate, late-payment / NSF rate, and stable-employment percentage? A property-management company in the area should have these aggregated.
- How much new for-sale + rental construction is in the pipeline within 1–3 miles? Heavy new supply typically softens prices + rents 12–24 months out; constrained supply supports both.
Investment metrics
- 1% rule
- 1.29% ✓
- Cap rate
- 10.44%
- Cash-on-cash
- 14.80%
- DSCR
- 1.66
- GRM
- 6.5
CMA / ARV
- ARV (median comp)
- $123,594
- List price
- $99,900
- Delta
- -19.17%
- Verdict
- UNDERPRICED
- Comps
- 20 within 1.0 mi
Show comp detail 12 sales within ~0.75 mi
| Address | Dist | Beds/Ba | Sqft | Sold | Price | $/sf | Match |
|---|---|---|---|---|---|---|---|
| 238 Emerling Dr | 0.00mi | 3/2.0 | 1,032 (-0%) | 0mo | $99,900 | $97 | 99 |
| 242 Emerling Dr | 0.01mi | 3/1.0 | 1,037 (0%) | 1mo | $129,900 | $125 | 94 |
| 246 Emerling Dr | 0.02mi | 3/1.0 | 1,037 (0%) | 5mo | $149,999 | $145 | 91 |
| 8408 Hill Ave | 0.31mi | 3/2.0 | 1,040 (+0%) | 3mo | $95,000 | $91 | 83 |
| 4723 N Hills Ln | 0.15mi | 3/2.0 | 965 (-7%) | 0mo | $85,000 | $88 | 81 |
| 4815 Barbara Dr | 0.23mi | 3/1.5 | 988 (-5%) | 5mo | $98,500 | $100 | 75 |
| 120 Bernhardt Ave | 0.52mi | 2/2.0 (-1) | 1,002 (-3%) | 1mo | $74,900 | $75 | 64 |
| 5150 Wallingford Dr | 0.50mi | 3/2.0 | 1,118 (+8%) | 3mo | $154,900 | $139 | 61 |
| 8350 Hill Ave | 0.31mi | 3/1.0 | 912 (-12%) | 1mo | $94,900 | $104 | 60 |
| 5547 Holborn Dr | 0.70mi | 3/1.0 | 1,032 (-0%) | 3mo | $69,900 | $68 | 60 |
| 5520 Holborn Dr | 0.73mi | 2/2.0 (-1) | 1,032 (-0%) | 3mo | $124,000 | $120 | 58 |
| 5616 Parchester Dr | 0.59mi | 3/1.0 | 1,102 (+6%) | 1mo | $84,900 | $77 | 57 |
Match score weights: distance 35% · size 25% · config 20% · recency 20%. Top-matched comps best support the ARV.
Projected returns pro-forma
-3.0% appreciation · 5.21% rent growth · sell at horizon
- IRR
- 7.8%
- Equity multiple
- 1.31×
- Total profit
- $8,723
- Equity at exit
- $14,895
- IRR
- 18.8%
- Equity multiple
- 2.73×
- Total profit
- $48,498
- Equity at exit
- $8,638
Cash invested: $27,972 (down + closing). Projections, not guarantees.
Landlord ↔ Tenant lean methodology
- Overall (STATE)
- 81 Strongly Landlord-Friendly
- State Missouri
- 81 Strongly Landlord-Friendly · R+10
- County
- — inherits STATE
- City
- — inherits STATE
ZIP-level market 63121
- Rents YoY
- 5.2%
- Active inventory
- 23
- Price-to-rent
- 6.5×
Monthly cashflow live
- Estimated rent
- $1,288 high interval (Pro) →
- Mortgage (P&I)
- −$524
- Tax from tax record
- −$107 /mo · $1,288/yr
- Insurance
- −$42
- HOA
- −$0
- Vacancy / Maint / Mgmt
- −$271
- Net cashflow
- $345
Break-even live
UW: 25.0% down · 7.5% · 30yr · 1.5% tax · 5.0% vac · 8.0% maint · 8.0% mgmt
Financing live
Cash to close
- Down payment
- $24,975
- Closing costs
- $2,997
- Reserves months
- —
- Total cash needed
- —
Loan-product check · same deal, 3 products live
Conventional
25% down · 7.5% · 30yr
- Down + closing
- —
- Monthly P&I
- —
- Monthly cashflow
- —
- DSCR
- —
- Eligible?
- —
Personal DTI + credit; lowest rate.
DSCR
20% down · 8.5% · 30yr
- Down + closing
- —
- Monthly P&I
- —
- Monthly cashflow
- —
- DSCR
- —
- Eligible?
- —
No personal income docs; deal must DSCR.
Hard money
10% down · 12.0% · 12mo
- Down + closing
- —
- Monthly P&I
- —
- Monthly cashflow
- —
- DSCR
- —
- Eligible?
- —
Short-term bridge; refi at stabilization.
Rent comps 35 comps
| Address | Beds | Baths | Sqft | Rent | $/sqft | DOM | Units | Dist |
|---|---|---|---|---|---|---|---|---|
| 8408 Hill Ave Saint Louis, MO | 3.0 | 2.0 | 1040 | $1,550 | $1.49 | 23d | 1 | 0.33mi |
| 204 Hawkesbury Dr Saint Louis, MO | 2.0 | 1.0 | 849 | $1,250 | $1.47 | 4d | 1 | 0.52mi |
| 5300 Grove Ave Saint Louis, MO | 3.0 | 1.0 | 840 | $1,295 | $1.54 | 23d | 1 | 0.62mi |
| 7808 Winward Dr Saint Louis, MO | 3.0 | 1.0 | 1434 | $1,425 | $0.99 | 21d | 1 | 0.63mi |
| 806 Marvin Ave Saint Louis, MO | 2.0 | 1.0 | 726 | $1,100 | $1.52 | 43d | 1 | 0.69mi |
| 5925 Brand Ave Saint Louis, MO | 3.0 | 1.0 | 951 | $1,200 | $1.26 | 43d | 1 | 0.71mi |
| 801 Thomas Ave Saint Louis, MO | 3.0 | 1.0 | 864 | $1,350 | $1.56 | 43d | 1 | 0.74mi |
| 7816 Dartmoor Dr Saint Louis, MO | 3.0 | 1.0 | 950 | $1,195 | $1.26 | 43d | 1 | 0.76mi |
| 5900 Sheriton Dr Saint Louis, MO | 3.0 | 1.0 | 864 | $1,050 | $1.22 | 23d | 1 | 0.79mi |
| 846 Elsworth Pl Saint Louis, MO | 4.0 | 1.0 | 1352 | $1,600 | $1.18 | 4d | 1 | 0.81mi |
| 709 Suburban Ave Saint Louis, MO | 2.0 | 1.0 | 975 | $1,400 | $1.44 | 43d | 1 | 0.83mi |
| 450 S Dade Ave Saint Louis, MO | 2.0 | 1.0 | 1040 | $1,200 | $1.15 | 23d | 1 | 0.85mi |
| 5500 Mable Ave Unit 5530 B1 St. Louis, MO | 3.0 | 1.0 | 850 | $915 | $1.08 | 43d | 1 | 0.86mi |
| 5500 Mable Ave Unit 5518 B4 St. Louis, MO | 2.0 | 1.0 | 750 | $835 | $1.11 | 43d | 1 | 0.86mi |
| 223 Wiegel Dr Saint Louis, MO | 3.0 | 1.0 | 864 | $1,560 | $1.81 | 12d | 1 | 0.88mi |
| 422 Plaza Ave Saint Louis, MO | 3.0 | 1.0 | 792 | $1,000 | $1.26 | 7d | 1 | 0.93mi |
| 5830 Bermuda Dr Unit 34C St. Louis, MO | 2.0 | 1.0 | 850 | $895 | $1.05 | 43d | 1 | 0.94mi |
| 5830 Bermuda Dr Unit 30B St. Louis, MO | 2.0 | 1.0 | 900 | $895 | $0.99 | 23d | 1 | 0.94mi |
| 519 Graf Ave Saint Louis, MO | 3.0 | 2.0 | 887 | $1,297 | $1.46 | 20d | 1 | 0.95mi |
| 360 S Harvey Ave Saint Louis, MO | 2.0 | 1.0 | 936 | $925 | $0.99 | 43d | 1 | 0.98mi |
| 617 Tesmore Pl Saint Louis, MO | 2.0 | 1.0 | 877 | $1,200 | $1.37 | 43d | 1 | 0.98mi |
| 26 Arbor Village Ct Ferguson, MO | 1.0–2.0 | 1.0 | 714 | $950 | $1.33 | 23d | 1 | 1.02mi |
| 222 Randolph Ave Saint Louis, MO | 2.0 | 1.0 | 964 | $1,400 | $1.45 | 7d | 1 | 1.07mi |
| 12 Lee Ave Saint Louis, MO | 2.0 | 1.0 | 832 | $1,080 | $1.30 | 7d | 1 | 1.08mi |
| 265 S Harvey Ave Saint Louis, MO | 3.0 | 1.5 | 1240 | $1,350 | $1.09 | 43d | 1 | 1.09mi |
| 246 Louisa Ave Saint Louis, MO | 3.0 | 1.0 | 1036 | $1,600 | $1.54 | 43d | 1 | 1.11mi |
| 419 S Florissant Rd Ferguson, MO | 2.0 | 1.0 | 1100 | $1,200 | $1.09 | 43d | 1 | 1.15mi |
| 6170 Emerald Ave Saint Louis, MO | 3.0 | 1.0 | 1286 | $1,500 | $1.17 | 14d | 1 | 1.18mi |
| 6170 Emerald Ave Saint Louis, MO | 3.0 | 1.0 | 1286 | $1,425 | $1.11 | 2d | 1 | 1.18mi |
| 110 Paul Ave Saint Louis, MO | 3.0 | 1.0 | 875 | $1,050 | $1.20 | 7d | 1 | 1.19mi |
| 6180 Emerald Ave Saint Louis, MO | 2.0 | 1.0 | 729 | $1,300 | $1.78 | 43d | 1 | 1.20mi |
| 6188 Dupree Ave Saint Louis, MO | 3.0 | 1.5 | 972 | $1,300 | $1.34 | 43d | 1 | 1.23mi |
| 338 Saint Louis Ave Saint Louis, MO | 3.0 | 1.0 | 1200 | $1,200 | $1.00 | 43d | 1 | 1.30mi |
| 9316 Koenig Cir Berkeley, MO | 2.0 | 1.0 | 720 | $1,150 | $1.60 | 4d | 5 | 1.33mi |
| 601 Carson Rd Saint Louis, MO | 2.0 | 1.0 | 743 | $950 | $1.28 | 23d | 1 | 1.48mi |
Listing history 17 events
-
2026-05-07status Pending 435-char remark
-
2026-04-24$99,900 Active 435-char remark
-
2019-07-08soldstatus $48,250
-
2019-06-07soldstatus Closed 537-char remark
Show marketing remark (537 chars)
Excellent investment opportunity located in Cool Valley. Entering through the front door you will see beautiful hardwoods in the large living room. 2 bedrooms are located on the main floor along with the main bathroom. Nice white kitchen with refrigerator, stove, and dishwasher. Dining room has potential to be converted to bedroom #3. Partially finished basement with two separate rooms for offices/storage and a large common room perfect for entertainment. The full bathroom in the basement is a bonus. Previously rented at $825/month
-
2019-05-23status Pending 537-char remark
Show marketing remark (537 chars)
Excellent investment opportunity located in Cool Valley. Entering through the front door you will see beautiful hardwoods in the large living room. 2 bedrooms are located on the main floor along with the main bathroom. Nice white kitchen with refrigerator, stove, and dishwasher. Dining room has potential to be converted to bedroom #3. Partially finished basement with two separate rooms for offices/storage and a large common room perfect for entertainment. The full bathroom in the basement is a bonus. Previously rented at $825/month
-
2019-05-20$52,000 Active 537-char remark
Show marketing remark (537 chars)
Excellent investment opportunity located in Cool Valley. Entering through the front door you will see beautiful hardwoods in the large living room. 2 bedrooms are located on the main floor along with the main bathroom. Nice white kitchen with refrigerator, stove, and dishwasher. Dining room has potential to be converted to bedroom #3. Partially finished basement with two separate rooms for offices/storage and a large common room perfect for entertainment. The full bathroom in the basement is a bonus. Previously rented at $825/month
-
2015-04-07soldstatus $34,000
-
2014-12-22soldstatus $16,500
-
2014-11-14soldstatus
Show marketing remark (133 chars)
Home for sale in AS IS condition, please put on special sales contract. Wow! Great home at a great price, priced to sell! Show today!
-
2014-09-15$17,000
Show marketing remark (133 chars)
Home for sale in AS IS condition, please put on special sales contract. Wow! Great home at a great price, priced to sell! Show today!
-
2014-04-17soldstatus $10,000
-
2007-07-24soldstatus $95,000
-
2007-06-20soldstatus $64,000
-
1992-09-30soldstatus
-
1992-05-28soldstatus $32,000
-
1990-04-01soldstatus
-
1990-04-01soldstatus $44,640
ⓘ Source: listings_history table (triggers on properties + properties_extension) + one-shot
backfill from property_details.listing_events for pre-trigger history.
Tax reassessment forecast MO · Resets to sale price
- Current annual tax
- $1,288 · $107/mo
- Projected year-2 tax
- $1,288 · $107/mo
- Expected delta
- $0/yr ($0/mo · 0.0%)
ⓘ Screening estimate from a state-policy table — verify with the county assessor before closing.
Climate risk First Street
- Flood 1/10 Low FEMA zone X (unshaded) · 0% chance over 30 yrs
- Wildfire 1/10 Low
- Heat 5/10 Major 7 d/yr ≥106°F today · 21 d/yr by 30 yrs out
- Wind 2/10 Low 100% chance of damaging wind over 30 yrs
- Air quality 4/10 Moderate 4 unhealthy d/yr today · 5 by 30 yrs out
Nearby sold comps map
Loading sold comps map…
Walkable amenities ~0.75 mi
Loading nearby amenities…
Taxation est. · year 1
- Rental income
- $15,461
- − Mortgage interest
- −$5,596
- − Property taxes
- −$1,288
- − Insurance
- −$500
- − Repairs & maintenance
- −$1,237
- − Management
- −$1,237
- − Depreciation
- −$2,906
- Taxable income
- $2,698
- Est. tax owed @ 24.0%
- −$647
- After-tax cash flow
- $3,493/yr
For passive investors: Depreciation is non-cash, so a rental often shows a tax loss while cash-flowing — sheltering income. Rental losses are passive: they offset passive income freely, and up to $25,000/yr can offset ordinary (W-2) income if you actively participate and your MAGI is under $100k (phasing out to $0 by $150k); unused losses carry forward. On sale, claimed depreciation is recaptured at up to 25%, and gains may owe capital-gains tax (a 1031 exchange can defer both). Figures are a year-1 estimate at your 24.0% rate — not tax advice; consult a CPA.
Schools (NCES district)
- District
- Ferguson-Florissant R-II
- NCES district ID
- 2912010
- Math proficiency
- 7% ▼ -9.00%
- Reading proficiency
- 20% ▼ -6.00%
- Median HH income
- $44,610
- Composite
- 11.96/100
- National rank
- #9666
- State rank
- #311 of 324 in MO
Livability — Cool Valley
- Score
- 71/100
- State rank
- #116
- US rank
- #7242
Category grades
Schools grade is shown separately in the Schools card above.
Census & demographics
- Census place
- Cool Valley, MO
- County
- Saint Louis County · 888,823 people
- City population
- 25,008
- Metro
- St. Louis, MO-IL
- Population (ZIP)
- 25,008
- Household income
- $42,701
- Rent vs Own
- Severe rent burden
- 1611.0
Population outlook (St. Louis County) Hauer SSP2
- Today (2025)
- 1,025,227 people
- By 2030
- 1,028,023 · +0.3%
- By 2040
- 1,020,940 · -0.4%
- By 2050
- 1,007,280 · -1.8%
- By 2075
- 987,277 · -3.7%
- By 2100
- 921,984 · -10.1%
Race, ethnicity, and origin ACS 2023
- Neighborhood character
- Predominantly Black (80%)
- Race & ethnicity
- Black 80% White 14% Two or more races 4% Hispanic / Latino 2% Asian 2%
- Common ancestry
- Lithuanian 1%
- Foreign-born
- 2% · Canada
- Languages at home
- 96% English-only · Spanish 2% Other Indo-European 1%
Political lean MEDSL · St. Louis
- 2024 margin
- Strong D (+23.4) · D 60.8% · R 37.4% · Other 1.7%
- 2008→2024 swing
- +3.5pp toward D · 2008: 19.9pp · 2024: 23.4pp
- All cycles
- 2024: D+23.4 2020: D+24.0 2016: D+16.2 2012: D+13.7 2008: D+19.9
Not yet ingested
- Civics
- —
Market trends
- HPI YoY
- ▼ -177.84%
- Current HPI
- 100.4494
- Rent YoY
- ▲ 5.21%
- Metro
- St. Louis, MO-IL
- State GDP YoY
- ▲ 1.84%
- F500 in state
- 20
Industry mix (Fortune 500 HQ in MO)
| Industry | F500 HQs | Revenue |
|---|---|---|
| Healthcare | 1 | $163B |
|
||
| Insurance | 1 | $21B |
|
||
| Industrial Technology | 1 | $17B |
|
||
| Retail | 1 | $16B |
|
||
| Industrial Distribution | 1 | $10B |
|
||
| Utilities | 1 | $9B |
|
||
Price history
+123.8% since first listed18 events — show timeline
- 2026-06-16 Sold (MLS) — MARIS as Distributed by MLS Grid
- 2026-05-07 Pending — MARIS as Distributed by MLS Grid
- 2026-04-24 Listed $99,900 MARIS as Distributed by MLS Grid
- 2019-07-08 Sold (Public Records) $48,250 Public Records
- 2019-06-07 Sold (MLS) — MARIS as Distributed by MLS Grid
- 2019-05-23 Pending — MARIS as Distributed by MLS Grid
- 2019-05-20 Listed $52,000 MARIS as Distributed by MLS Grid
- 2015-04-07 Sold (Public Records) $34,000 Public Records
- 2014-12-22 Sold (Public Records) $16,500 Public Records
- 2014-11-14 Sold (MLS) — MARIS as Distributed by MLS Grid
- 2014-09-15 Listed $17,000 MARIS as Distributed by MLS Grid
- 2014-04-17 Sold (Public Records) $10,000 Public Records
- 2007-07-24 Sold (Public Records) $95,000 Public Records
- 2007-06-20 Sold (Public Records) $64,000 Public Records
- 1992-09-30 Sold (Public Records) — Public Records
- 1992-05-28 Sold (Public Records) $32,000 Public Records
- 1990-04-01 Sold (Public Records) $44,640 Public Records
- 1990-04-01 Sold (Public Records) — Public Records
Property tax history
+2.2%/yrLatest (2022): $1,288 · +0.3% YoY. Source: county tax records.
Cash-flow waterfall
monthlySold comps — $/sqft
last 12 mo · ≤1 miLoading sold comps…