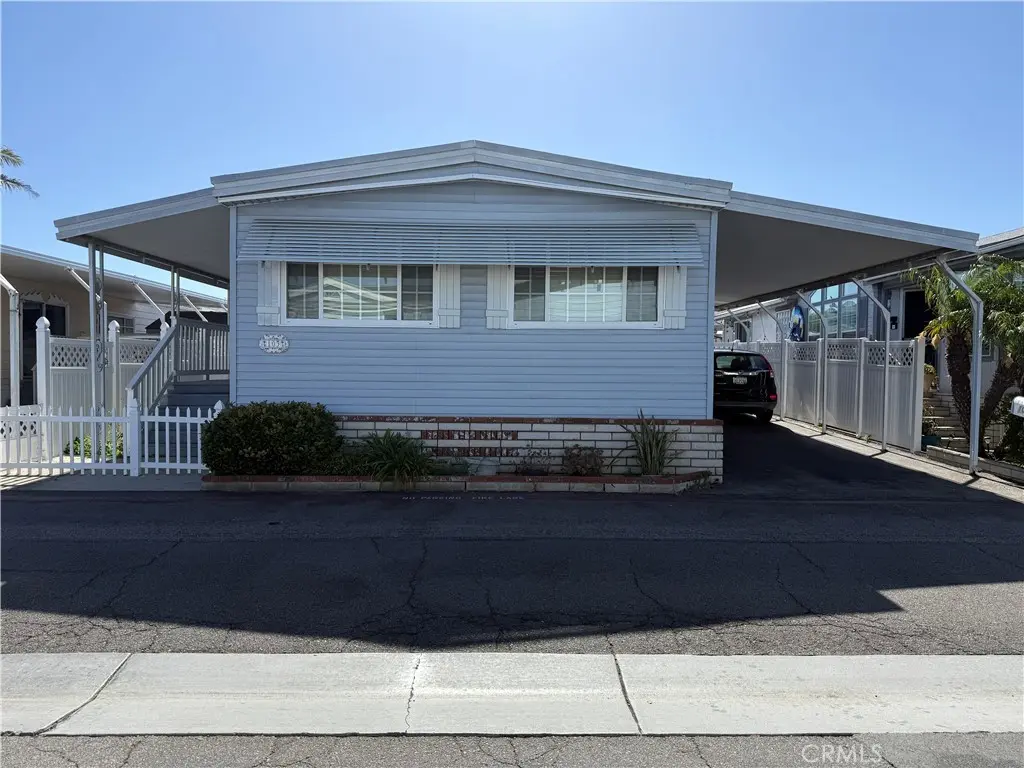
20701 Beach #103 · Huntington Beach, CA
Flood risk No data
- FEMA flood zone
- —
- Chance of flooding over 30 yrs
- —
- Est. flood insurance / yr
- —
Fire risk No data
- Est. fire insurance / yr
- —
Heat risk No data
- Hot days now (above threshold)
- —
- Hot days in 30 yrs
- —
Wind risk No data
- Chance of severe wind over 30 yrs
- —
Air-quality risk No data
- Unhealthy air days now
- —
- Unhealthy air days in 30 yrs
- —
Risk factors via First Street. Map © Google.
Why this score? — see what drove the B- grade
The composite is a weighted blend of 9 inputs, each scored 0–100. Each bar is that input's sub-score; the figure is the points it added to the 100-point composite (weight × sub-score).
- Cash flow +30.0/30.0
- 1% rule +10.0/10.0
- DSCR +10.0/10.0
- Schools +6.5/10.0
- Livability +3.4/5.0
- Rent growth +3.2/5.0
- Condition / age +2.5/5.0
- ARV discount +0.0/15.0
- Appreciation +0.0/10.0
$160,900
🖨 Deal sheet 📄 Offer letter ✓ Due diligence
Listing remarks
This is the beautiful mobile home in Huntington Beach . It has 2 bedrooms and 2 bathrooms with one office in the mobile home . This office can use it like a bedroom . The carpot next to mobile home can park 2- car. A front of the mobile home patio is very large. You should see it now because only a few minutes come to the beach .
Key facts
- Community pool
- Built 1972
- Listed 3 days
Property features AI
Finance
- Other: Urban community setting
- HOA & community: Land lease: $2,777
Exterior
- Parking: Located in Huntington Shorecliffs park
- Utilities: Public sewer; District/public water
- Home design: Single-story property; Mobile home remains on site; Mobile dimensions approximately 10 ft by 56 ft
- Construction: Year built: estimated
- Exterior features: Community pool; Patio-home lot type
Interior
- Bathrooms: 2 full bathrooms
- Interior features: One-level home; Entry on the main level
- Laundry & utility: Laundry area in the kitchen
Neighborhood map
What this means for you Summary
Snapshot
- This is a 3-bed/2.0-bath manufactured listed at $161k.
Deal economics
- At list price, monthly cash flow is $2k ($26k/yr) — positive.
- The deal already cash-flows at list — no discount required.
- Meets the 1% rule at list price ($4k rent vs $161k).
- Cap rate 22.6% vs local median 1.6% in Huntington Beach — top-decile yield for the area; either an underpriced asset or a hidden risk that comps aren't pricing in. Stress-test before assuming the spread holds.
Location & tenants
- Location reads 67/100 on livability (#306 in CA) — a middle-class / working-renter tenant base. Strengths: employment A+, commute A-, schools B+; Watch: amenities C-, cost of living F, health & safety F.
- Huntington Beach Union High (suburban): math 65% / reading 82% proficiency, ranked #39 of 517 in CA (top 8%) — strong family-tenant draw, lease renewals of 3-5y typical.
- Market conditions: Rents rising (+2.8%/yr); 135 active listings in the ZIP; 40 comparable units currently listed for rent nearby; rentals leasing fast (median 2d on market — plan ~1-2 weeks tenant-placement turnaround); high-income renter base; 6,974 units permitted in Orange County in 2024 (3,839 in 5+ unit buildings).
- This rent runs 38% of the median local income ($130k/yr) — at the standard rent-burdened threshold; future hikes will face affordability resistance.
Forward outlook
- Local home prices are declining (-3.0%/yr); year-one equity from $1k of loan paydown is wiped out by about $5k of value loss. Plan a longer hold.
- Orange County population projected at +14% by 2050 — modest demand growth; plan on rents tracking national, not racing it.
- At projected returns (-3.0% appreciation + 2.8% rent growth), your $45k cash investment doubles in ~2 years — after that, you're playing with house money.
Negotiation context
- Only 3 days on market — expect competitive offers; lowballing is unlikely to land.
- 2 sale attempts; this cycle's ask has dropped $9k (5%) from the opening price — seller is motivated, your offer sets the floor, not the list.
Questions for the listing agent
- Built in 1972 — when were the roof, HVAC, electrical panel, plumbing, and water heater last replaced?
- Is there a deadline driving the sale (1031 exchange, divorce, estate, relocation)? That informs how much negotiation room exists.
- Schools are B-rated — typically a magnet for longer-tenancy family renters. What's the average tenant stay here, and is there a school-zone premium baked into asking?
- What's the average days-on-market for RENTAL listings here right now (not sales)? A rising rental-DOM trend means longer vacancies and softer asking-rent achievability than the comps imply.
- What's the recent tenant-quality profile in this submarket — average credit score on applications, eviction rate, late-payment / NSF rate, and stable-employment percentage? A property-management company in the area should have these aggregated.
- How much new for-sale + rental construction is in the pipeline within 1–3 miles? Heavy new supply typically softens prices + rents 12–24 months out; constrained supply supports both.
Investment metrics
- 1% rule
- 2.59% ✓
- Cap rate
- 22.60%
- Cash-on-cash
- 58.23%
- DSCR
- 3.59
- GRM
- 3.2
CMA / ARV
- ARV (on-the-fly)
- $112,000
- Comps found
- 11
Show comp detail 11 sales within ~0.75 mi
| Address | Dist | Beds/Ba | Sqft | Sold | Price | $/sf | Match |
|---|---|---|---|---|---|---|---|
| 20701 Beach Blvd #30 | 0.17mi | 3/2.0 | 1,197 (+7%) | 2mo | $180,000 | $150 | 79 |
| 20701 Beach Blvd #45 | 0.13mi | 2/2.0 (-1) | 1,120 (0%) | 14mo | $199,900 | $178 | 77 |
| 20701 Beach Blvd #214 | 0.13mi | 2/2.0 (-1) | 1,120 (0%) | 15mo | $199,900 | $178 | 76 |
| 80 Huntington St #707 | 0.46mi | 2/2.0 (-1) | 1,040 (-7%) | 1mo | $50,000 | $48 | 60 |
| 80 Huntington St #514 | 0.36mi | 2/2.0 (-1) | 1,040 (-7%) | 8mo | $58,000 | $56 | 60 |
| 80 Huntington St #646 | 0.51mi | 2/2.0 (-1) | 1,152 (+3%) | 10mo | $115,000 | $100 | 58 |
| 80 Huntington #630 | 0.52mi | 3/2.0 | 1,251 (+12%) | 2mo | $295,000 | $236 | 55 |
| 80 Huntington St #418 | 0.40mi | 2/2.0 (-1) | 1,040 (-7%) | 19mo | $100,000 | $96 | 49 |
| 80 Huntington St #362 | 0.48mi | 2/2.0 (-1) | 1,000 (-11%) | 12mo | $100,000 | $100 | 44 |
| 80 Huntington #372 | 0.51mi | 2/2.0 (-1) | 1,272 (+14%) | 7mo | $73,000 | $57 | 43 |
| 80 Huntington St #606 | 0.45mi | 2/2.0 (-1) | 1,251 (+12%) | 24mo | $220,000 | $176 | 35 |
Match score weights: distance 35% · size 25% · config 20% · recency 20%. Top-matched comps best support the ARV.
Projected returns pro-forma
-3.0% appreciation · 2.78% rent growth · sell at horizon
- IRR
- 56.6%
- Equity multiple
- 3.49×
- Total profit
- $112,306
- Equity at exit
- $23,991
- IRR
- 61.4%
- Equity multiple
- 7.07×
- Total profit
- $273,573
- Equity at exit
- $13,912
Cash invested: $45,052 (down + closing). Projections, not guarantees.
Landlord ↔ Tenant lean methodology
- Overall (STATE)
- 18 Strongly Tenant-Friendly
- State California
- 18 Strongly Tenant-Friendly · D+13
- County
- — inherits STATE
- City
- — inherits STATE
ZIP-level market 92648
- Rents YoY
- 2.8%
- Active inventory
- 135
- Price-to-rent
- 3.2×
Monthly cashflow live
- Estimated rent
- $4,175 high interval (Pro) →
- Mortgage (P&I)
- −$844
- Tax est. 1.5%
- −$201 /mo · $2,414/yr
- Insurance
- −$67
- HOA
- −$0
- Vacancy / Maint / Mgmt
- −$877
- Net cashflow
- $2,186
Break-even live
UW: 25.0% down · 7.5% · 30yr · 1.5% tax · 5.0% vac · 8.0% maint · 8.0% mgmt
Financing live
Cash to close
- Down payment
- $40,225
- Closing costs
- $4,827
- Reserves months
- —
- Total cash needed
- —
Loan-product check · same deal, 3 products live
Conventional
25% down · 7.5% · 30yr
- Down + closing
- —
- Monthly P&I
- —
- Monthly cashflow
- —
- DSCR
- —
- Eligible?
- —
Personal DTI + credit; lowest rate.
DSCR
20% down · 8.5% · 30yr
- Down + closing
- —
- Monthly P&I
- —
- Monthly cashflow
- —
- DSCR
- —
- Eligible?
- —
No personal income docs; deal must DSCR.
Hard money
10% down · 12.0% · 12mo
- Down + closing
- —
- Monthly P&I
- —
- Monthly cashflow
- —
- DSCR
- —
- Eligible?
- —
Short-term bridge; refi at stabilization.
Rent comps 40 comps
| Address | Beds | Baths | Sqft | Rent | $/sqft | DOM | Units | Dist |
|---|---|---|---|---|---|---|---|---|
| 820 Geneva Ave Unit B Huntington Beach, CA | 2.0 | 1.0 | 750 | $3,200 | $4.27 | 25d | 1 | 0.24mi |
| 509 Delaware St Unit A Huntington Beach, CA | 3.0 | 2.0 | 1200 | $3,200 | $2.67 | 1d | 1 | 0.24mi |
| 7946 Waterfall Cir Huntington Beach, CA | 2.0 | 2.5 | 1439 | $4,500 | $3.13 | 1d | 1 | 0.28mi |
| 7623 Bay Dr #103 Huntington Beach, CA | 2.0 | 1.0 | 968 | $3,200 | $3.31 | 1d | 1 | 0.32mi |
| 7795 Neptune Dr Huntington Beach, CA | 2.0–4.0 | 1.5–2.5 | 1155 | $4,654 | $4.03 | 1d | 3 | 0.34mi |
| 1008 England St Huntington Beach, CA | 3.0 | 2.0 | 1200 | $4,500 | $3.75 | 1d | 1 | 0.38mi |
| 224 Frankfort Ave Huntington Beach, CA | 2.0 | 1.0 | 925 | $3,750 | $4.05 | 1d | 1 | 0.38mi |
| 8302 Indianapolis Ave Huntington Beach, CA | 3.0 | 2.0 | 1045 | $4,450 | $4.26 | 19d | 1 | 0.44mi |
| 80 HUNTINGTON St Huntington Beach, OS | 2.0 | 2.0 | 1276 | $3,825 | $3.00 | 1d | 1 | 0.45mi |
| 20301 Bluffside Cir Unit D110 Huntington Beach, CA | 2.0 | 2.0 | 1101 | $5,250 | $4.77 | 1d | 1 | 0.48mi |
| 430 Lake St #202 Huntington Beach, CA | 2.0 | 2.0 | 1023 | $3,850 | $3.76 | 18d | 1 | 0.48mi |
| 420 Lake St #101 Huntington Beach, CA | 2.0 | 2.0 | 1023 | $4,000 | $3.91 | 20d | 1 | 0.48mi |
| 21270 Beach Blvd Huntington Beach, CA | 2.0 | 1.0–2.0 | 679 | $3,557 | $5.23 | 1d | 12 | 0.51mi |
| 20321 Tidepool Cir Unit 105 Huntington Beach, CA | 2.0 | 2.0 | 1104 | $3,700 | $3.35 | 1d | 1 | 0.52mi |
| 626 Lake St #54 Huntington Beach, CA | 3.0 | 3.0 | 1400 | $3,895 | $2.78 | 24d | 1 | 0.54mi |
| 8450 Atlanta Ave Huntington Beach, CA | 1.0–2.0 | 1.0 | 791 | $2,845 | $3.59 | 1d | 9 | 0.55mi |
| 21040 Pacific City Cir Huntington Beach, CA | 1.0–3.0 | 1.0–2.5 | 1137 | $8,055 | $7.08 | 1d | 28 | 0.55mi |
| 8152 Mainsail Dr Unit 104 Huntington Beach, CA | 2.0 | 2.0 | 1149 | $3,600 | $3.13 | 24d | 1 | 0.58mi |
| 20191 Cape Coral Ln Unit 3-209 Huntington Beach, CA | 2.0 | 2.0 | 1059 | $3,200 | $3.02 | 4d | 1 | 0.58mi |
| 8121 Foxhall Dr Huntington Beach, CA | 3.0 | 1.5 | 1296 | $4,950 | $3.82 | 1d | 1 | 0.58mi |
| 8211 Mainsail Dr #202 Huntington Beach, CA | 2.0 | 2.0 | 1149 | $3,500 | $3.05 | 24d | 1 | 0.60mi |
| 403 Memphis Ave Unit 2 Huntington Beach, CA | 2.0 | 1.0 | 900 | $2,500 | $2.78 | 19d | 1 | 0.61mi |
| 227 1st St Unit 3 Huntington Beach, CA | 2.0 | 2.0 | 1050 | $7,000 | $6.67 | 18d | 1 | 0.61mi |
| 311 Memphis Ave Huntington Beach, CA | 2.0 | 1.0 | 820 | $2,595 | $3.16 | 1d | 1 | 0.62mi |
| 8565 Trinity Cir Unit 821D Huntington Beach, CA | 2.0 | 2.0 | 1077 | $3,450 | $3.20 | 1d | 1 | 0.63mi |
| 8565 Trinity Cir Unit 821D Huntington Beach, CA | 2.0 | 2.0 | 1077 | $3,450 | $3.20 | 10d | 1 | 0.63mi |
| 8216 Foxhall Dr Huntington Beach, CA | 4.0 | 2.5 | 1482 | $5,195 | $3.51 | 3d | 1 | 0.63mi |
| 308 Nashville Ave Huntington Beach, CA | 2.0 | 1.0 | 1000 | $3,116 | $3.12 | 1d | 1 | 0.66mi |
| 1507 Backbay Cir Huntington Beach, CA | 2.0 | 2.0 | 1275 | $5,200 | $4.08 | 1d | 1 | 0.68mi |
| 200 Pacific Coast Hwy Huntington Beach, CA | 1.0–2.0 | 1.0–2.0 | 1064 | $4,900 | $4.61 | 1d | 2 | 0.72mi |
| 200 Pacific Coast Hwy Huntington Beach, CA | 2.0 | 2.0–2.5 | 1299 | $4,575 | $3.52 | 15d | 2 | 0.72mi |
| 1315 Alabama St Huntington Beach, CA | 3.0 | 2.0 | 1236 | $7,500 | $6.07 | 1d | 1 | 0.72mi |
| 608 Olive Ave Huntington Beach, CA | 3.0 | 2.0 | 1100 | $4,195 | $3.81 | 15d | 1 | 0.75mi |
| 8777 Tulare Dr Unit 413d Huntington Beach, CA | 3.0 | 2.0 | 1287 | $3,900 | $3.03 | 1d | 1 | 0.77mi |
| 8461 Lomond Dr Huntington Beach, CA | 3.0 | 1.0 | 950 | $3,800 | $4.00 | 10d | 1 | 0.78mi |
| 1702 Florida St Huntington Beach, CA | 2.0–3.0 | 1.0–2.0 | 1022 | $3,000 | $2.93 | 1d | 1 | 0.80mi |
| 1601 Alabama St Unit 3 Huntington Beach, CA | 2.0 | 1.0 | 840 | $2,500 | $2.98 | 1d | 1 | 0.84mi |
| 8877 Lauderdale Ct Unit 214C Huntington Beach, CA | 2.0 | 2.0 | 1009 | $3,600 | $3.57 | 1d | 1 | 0.93mi |
| 19891 Beach Blvd Huntington Beach, CA | 2.0 | 1.0–2.0 | 790 | $3,986 | $5.04 | 1d | 11 | 0.93mi |
| 711 Pacific Coast Hwy Huntington Beach, CA | 1.0–3.0 | 1.0–2.0 | 1089 | $9,500 | $8.72 | 1d | 4 | 0.96mi |
Listing history 6 events
-
2026-06-18days on market $160,900 Active 3 DOM
-
2026-06-17days on market $160,900 Active 2 DOM
-
2026-06-15statusdays on market $160,900 Active 1 DOM
-
2026-06-15days on market $160,900 Coming Soon 3 DOM
-
2026-06-13remarks 333-char remark
-
2026-06-13$160,900 Coming Soon 1 DOM
ⓘ Source: listings_history table (triggers on properties + properties_extension) + one-shot
backfill from property_details.listing_events for pre-trigger history.
Nearby sold comps map
Loading sold comps map…
Walkable amenities ~0.75 mi
Loading nearby amenities…
Taxation est. · year 1
- Rental income
- $50,098
- − Mortgage interest
- −$9,013
- − Property taxes
- −$2,414
- − Insurance
- −$804
- − Repairs & maintenance
- −$4,008
- − Management
- −$4,008
- − Depreciation
- −$4,681
- Taxable income
- $25,170
- Est. tax owed @ 24.0%
- −$6,041
- After-tax cash flow
- $20,193/yr
For passive investors: Depreciation is non-cash, so a rental often shows a tax loss while cash-flowing — sheltering income. Rental losses are passive: they offset passive income freely, and up to $25,000/yr can offset ordinary (W-2) income if you actively participate and your MAGI is under $100k (phasing out to $0 by $150k); unused losses carry forward. On sale, claimed depreciation is recaptured at up to 25%, and gains may owe capital-gains tax (a 1031 exchange can defer both). Figures are a year-1 estimate at your 24.0% rate — not tax advice; consult a CPA.
Schools (NCES district)
- District
- Huntington Beach Union High
- NCES district ID
- 0618060
- Math proficiency
- 65% ▲ 17.00%
- Reading proficiency
- 82% ▲ 8.00%
- Median HH income
- $78,159
- Composite
- 64.9/100
- National rank
- #511
- State rank
- #39 of 517 in CA
Livability — Huntington Beach
- Score
- 67/100
- State rank
- #306
- US rank
- #10298
Category grades
Schools grade is shown separately in the Schools card above.
Census & demographics
- Census place
- Huntington Beach, CA
- County
- Orange County · 3,096,323 people
- City population
- 194,835
- Metro
- Los Angeles-Long Beach-Anaheim, CA
- Population (ZIP)
- 45,827
- Household income
- $130,164
- Rent vs Own
- Severe rent burden
- 2957.0
Population outlook (Orange County) Hauer SSP2
- Today (2025)
- 3,477,456 people
- By 2030
- 3,613,117 · +3.9%
- By 2040
- 3,835,945 · +10.3%
- By 2050
- 3,968,736 · +14.1%
- By 2075
- 4,097,053 · +17.8%
- By 2100
- 3,903,633 · +12.3%
Race, ethnicity, and origin ACS 2023
- Neighborhood character
- Diverse neighborhood (Simpson 0.56)
- Race & ethnicity
- White 63% Hispanic / Latino 16% Two or more races 14% Asian 11%
- Hispanic origin (detail)
- Mexican 11%
- Common ancestry
- Slovak 3% Italian 3% Scotch-Irish 3%
- Foreign-born
- 14% · Canada, Vietnam, China
- Languages at home
- 80% English-only · Spanish 7% Vietnamese 3% Other Indo-European 3%
Political lean MEDSL · Orange
- 2024 margin
- Toss-up / Even · D 49.7% · R 47.1% · Other 3.2%
- 2008→2024 swing
- +5.2pp toward D · 2008: -2.6pp · 2024: 2.6pp
- All cycles
- 2024: D+2.6 2020: D+9.0 2016: D+7.7 2012: R+8.3 2008: R+2.6
Not yet ingested
- Civics
- —
Market trends
- HPI YoY
- ▼ -797.90%
- Current HPI
- 381.1587
- Rent YoY
- ▲ 2.78%
- Metro
- Los Angeles-Long Beach-Anaheim, CA
- State GDP YoY
- ▲ 3.21%
- F500 in state
- 116
Industry mix (Fortune 500 HQ in CA)
| Industry | F500 HQs | Revenue |
|---|---|---|
| Technology | 27 | $1,492B |
|
||
| Financial Services | 3 | $174B |
|
||
| Retail | 3 | $44B |
|
||
| Insurance | 3 | $26B |
|
||
| Media / Entertainment | 2 | $115B |
|
||
| Pharmaceuticals / Biotech | 2 | $62B |
|
||
Price history
-10.1% since first listed8 events — show timeline
- 2026-06-12 Coming Soon $160,900 CRMLS
- 2026-03-19 Listing Removed — CRMLS
- 2026-02-23 Price Changed $162,900 CRMLS
- 2026-01-13 Price Changed $164,900 CRMLS
- 2025-09-19 Listed $169,900 CRMLS
- 2025-06-24 Listing Removed — CRMLS
- 2025-04-12 Price Changed $174,000 CRMLS
- 2025-03-24 Listed $179,000 CRMLS
Cash-flow waterfall
monthlySold comps — $/sqft
last 12 mo · ≤1 miLoading sold comps…