 6-Plex
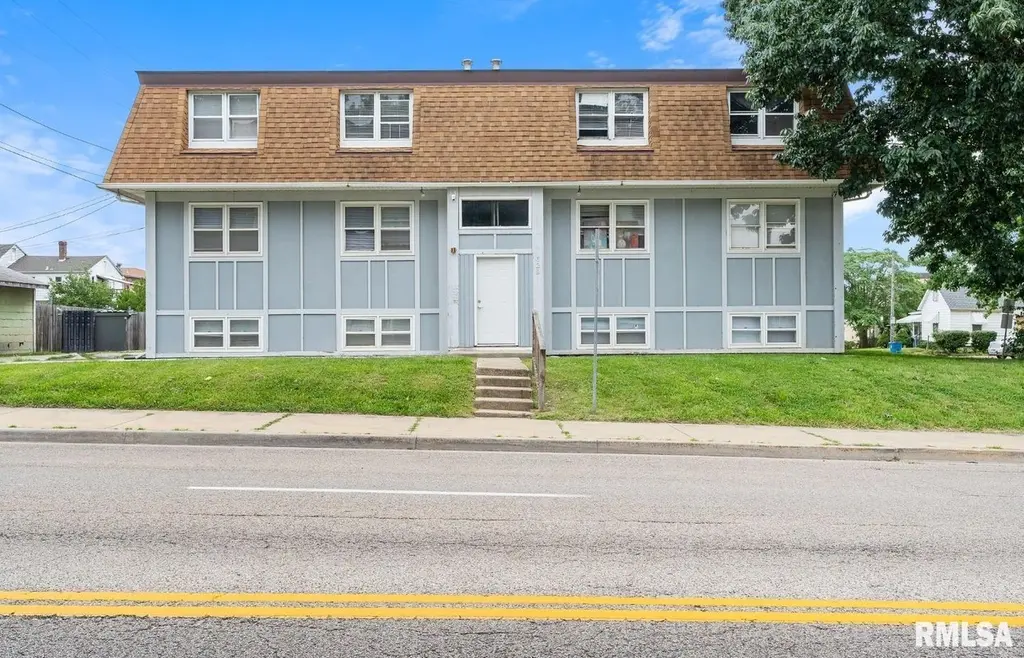
629 W Washington St · Springfield, IL
Flood risk No data
- FEMA flood zone
- —
- Chance of flooding over 30 yrs
- —
- Est. flood insurance / yr
- —
Fire risk No data
- Est. fire insurance / yr
- —
Heat risk No data
- Hot days now (above threshold)
- —
- Hot days in 30 yrs
- —
Wind risk No data
- Chance of severe wind over 30 yrs
- —
Air-quality risk No data
- Unhealthy air days now
- —
- Unhealthy air days in 30 yrs
- —
Risk factors via First Street. Map © Google.
Why this score? — see what drove the B- grade
The composite is a weighted blend of 9 inputs, each scored 0–100. Each bar is that input's sub-score; the figure is the points it added to the 100-point composite (weight × sub-score).
- Cash flow +30.0/30.0
- DSCR +10.0/10.0
- 1% rule +8.9/10.0
- ARV discount +7.5/15.0
- Livability +4.0/5.0
- Condition / age +4.0/5.0
- Rent growth +3.7/5.0
- Schools +1.7/10.0
- Appreciation +0.0/10.0
$385,000
🖨 Deal sheet 📄 Offer letter ✓ Due diligence
Multi-family units
County records classify this as Multi-Family (5+ Unit). Listing-text estimate: 6 units. confirmed
5+ unit building — per-unit beds/baths from public records are typically unavailable; the breakdown below (if shown) is an estimate from the listing text.
Listing remarks MLS
This centrally located 6 unit complex is in a high traffic area, and has a very high occupancy rate. Three units are currently vacant after having performed some tenant clean up, and they are currently undergoing turnover rehab. With Four 2 bedroom/1 bath units, and Two 1 bedroom/1 bath, you will have options to offer incoming tenants. In 2019, the property received substantial updates to flooring, fixtures, kitchens and bathrooms. Tenants pay unit utilities, and owner pays for water and garbage disposal service. Common area coin operated laundry is an added bonus!
Key facts
- Substantial updates
- 6,450 sq ft lot
- 6 parking spots
Tags
Neighborhood map
What this means for you Summary
Snapshot
- This is a 4×2bd/1ba + 2×1bd/1ba units multifamily listed at $385k. Condition is rated good.
Deal economics
- At list price, monthly cash flow is $2k ($19k/yr) — positive. Per door: $259/mo.
- The deal already cash-flows at list — no discount required.
- Meets the 1% rule at list price ($5k rent vs $385k).
- Cap rate 11.1% vs local median 4.9% in Springfield — top-decile yield for the area; either an underpriced asset or a hidden risk that comps aren't pricing in. Stress-test before assuming the spread holds.
Location & tenants
- Location reads 79/100 on livability (#122 in IL, #2,138 nationally) — a middle-class / working-renter tenant base. Strengths: amenities A+, commute A+, cost of living A+; Watch: schools D+, crime F.
- Springfield SD 186 (urban): math 17% / reading 22% proficiency, ranked #438 of 620 in IL (top 71%) — low school quality limits family demand, transient renter base, plan for 1-2y turnover; 64% free/reduced lunch — lower-income household profile, screen leases tightly.
- Market conditions: Rents rising fast (+5.0%/yr); 131 active listings in the ZIP; 225 units permitted in Sangamon County in 2024 (48 in 5+ unit buildings).
- At $5,334/mo this rent would consume 125% of the median local household income ($51k/yr) (locally 1230% of renters already pay >50% of income on rent) — very limited rent-growth headroom before tenants either downsize or default.
Forward outlook
- Local home prices are declining (-3.0%/yr); year-one equity from $3k of loan paydown is wiped out by about $12k of value loss. Plan a longer hold.
- Sangamon County population projected to shrink 9% by 2050 — rents likely to lag national; underwrite the cash flow, not the appreciation.
- At projected returns (-3.0% appreciation + 5.0% rent growth), your $108k cash investment doubles in ~7 years — after that, you're playing with house money.
Negotiation context
- Only 9 days on market — expect competitive offers; lowballing is unlikely to land.
- 6 sale attempts since 7y ago with the ask held roughly flat each time — persistent listings suggest the price (not the market) is what's stuck; bring a comps-based counter.
- Current owner paid $60k; list at $385k implies a 542% gain — meaningful room to come down on a strong offer.
Questions for the listing agent
- Can we see the unit-by-unit rent roll, current vacancy, and any below-market leases? What's the average tenancy length?
- What capital expenditures (roof, boiler, parking lot, exteriors) have been made in the last 5 years, and what's planned in the next 2?
- Built in 1967 — when were the roof, HVAC, electrical panel, plumbing, and water heater last replaced?
- Is there a deadline driving the sale (1031 exchange, divorce, estate, relocation)? That informs how much negotiation room exists.
- Schools are D-rated, which usually means shorter tenancies and higher turnover. Who's the typical renter profile here, and what's been the actual vacancy rate?
- Crime grade is F in this area — have there been break-ins, vandalism, or insurance claims at this property in the last 3 years? What carrier currently insures it and at what premium?
- What's the average days-on-market for RENTAL listings here right now (not sales)? A rising rental-DOM trend means longer vacancies and softer asking-rent achievability than the comps imply.
- What's the recent tenant-quality profile in this submarket — average credit score on applications, eviction rate, late-payment / NSF rate, and stable-employment percentage? A property-management company in the area should have these aggregated.
- How much new apartment / multifamily construction is in the pipeline within 1–3 miles? Heavy new supply (>2% of stock underway) typically softens rents 12–24 months out; light construction supports rent growth.
Investment metrics
- 1% rule
- 1.39% ✓
- Cap rate
- 11.13%
- Cash-on-cash
- 17.29%
- DSCR
- 1.77
- GRM
- 6.0
CMA / ARV
- ARV (median comp)
- $181,996
- List price
- $385,000
- Delta
- 111.54%
- Verdict
- OVERPRICED
- Comps
- 20 within 1.0 mi
Projected returns pro-forma
-3.0% appreciation · 4.95% rent growth · sell at horizon
- IRR
- 10.8%
- Equity multiple
- 1.44×
- Total profit
- $47,287
- Equity at exit
- $57,405
- IRR
- 21.4%
- Equity multiple
- 2.99×
- Total profit
- $214,445
- Equity at exit
- $33,288
Cash invested: $107,800 (down + closing). Projections, not guarantees.
Landlord ↔ Tenant lean methodology
- Overall (STATE)
- 43 Moderately Tenant-Leaning
- State Illinois
- 43 Moderately Tenant-Leaning · D+7
- County
- — inherits STATE
- City
- — inherits STATE
ZIP-level market 62702
- Home prices YoY
- -34.9%
- Rents YoY
- 5.0%
- Active inventory
- 131
- Price-to-rent
- 35.5×
Monthly cashflow live
- Estimated rent
- $5,334 high interval (Pro) →
- Mortgage (P&I)
- −$2,019
- Tax est. 1.5%
- −$481 /mo · $5,775/yr
- Insurance
- −$160
- HOA
- −$0
- Vacancy / Maint / Mgmt
- −$1,120
- Net cashflow
- $1,553
Break-even live
6-unit breakdown (identical units grouped — click to expand)
| Units | Beds | Baths | Est. rent |
|---|---|---|---|
| 4× units | 2 | 1 | $3,620 |
| #1 | 2 | 1 | $905 |
| #2 | 2 | 1 | $905 |
| #3 | 2 | 1 | $905 |
| #4 | 2 | 1 | $905 |
| 2× units | 1 | 1 | $1,714 |
| #5 | 1 | 1 | $857 |
| #6 | 1 | 1 | $857 |
| Total (6 units) | $5,334 | ||
UW: 25.0% down · 7.5% · 30yr · 1.5% tax · 5.0% vac · 8.0% maint · 8.0% mgmt
Financing live
Cash to close
- Down payment
- $96,250
- Closing costs
- $11,550
- Reserves months
- —
- Total cash needed
- —
Loan-product check · same deal, 3 products live
Conventional
25% down · 7.5% · 30yr
- Down + closing
- —
- Monthly P&I
- —
- Monthly cashflow
- —
- DSCR
- —
- Eligible?
- —
Personal DTI + credit; lowest rate.
DSCR
20% down · 8.5% · 30yr
- Down + closing
- —
- Monthly P&I
- —
- Monthly cashflow
- —
- DSCR
- —
- Eligible?
- —
No personal income docs; deal must DSCR.
Hard money
10% down · 12.0% · 12mo
- Down + closing
- —
- Monthly P&I
- —
- Monthly cashflow
- —
- DSCR
- —
- Eligible?
- —
Short-term bridge; refi at stabilization.
Listing history 18 events
-
2026-05-21status Pending 576-char remark
Show marketing remark (576 chars)
This centrally located 6 unit complex is in a high traffic area, and has a very high occupancy rate. Three units are currently vacant after having performed some tenant clean up, and they are currently undergoing turnover rehab. With Four 2 bedroom/1 bath units, and Two 1 bedroom/1 bath, you will have options to offer incoming tenants. In 2019, the property received substantial updates to flooring, fixtures, kitchens and bathrooms. Tenants pay unit utilities, and owner pays for water and garbage disposal service. Common area coin operated laundry is an added bonus!
-
2026-05-11$385,000 Active 576-char remark
Show marketing remark (576 chars)
This centrally located 6 unit complex is in a high traffic area, and has a very high occupancy rate. Three units are currently vacant after having performed some tenant clean up, and they are currently undergoing turnover rehab. With Four 2 bedroom/1 bath units, and Two 1 bedroom/1 bath, you will have options to offer incoming tenants. In 2019, the property received substantial updates to flooring, fixtures, kitchens and bathrooms. Tenants pay unit utilities, and owner pays for water and garbage disposal service. Common area coin operated laundry is an added bonus!
-
2025-09-08price
-
2025-07-15price
-
2025-05-26status Active
-
2025-05-26historical
-
2025-04-30status Pending
-
2025-03-24price
-
2025-03-07Active
-
2024-12-12historical
-
2024-11-13price
-
2024-09-17price
-
2024-08-13Active
-
2024-06-25historical $700
-
2024-06-19$700
-
2023-05-23historical
-
2019-09-25soldstatus $60,000
-
2019-09-12$55,000
ⓘ Source: listings_history table (triggers on properties + properties_extension) + one-shot
backfill from property_details.listing_events for pre-trigger history.
Nearby sold comps map
Loading sold comps map…
Walkable amenities ~0.75 mi
Loading nearby amenities…
Taxation est. · year 1
- Rental income
- $64,008
- − Mortgage interest
- −$21,566
- − Property taxes
- −$5,775
- − Insurance
- −$1,925
- − Repairs & maintenance
- −$5,121
- − Management
- −$5,121
- − Depreciation
- −$11,200
- Taxable income
- $13,301
- Est. tax owed @ 24.0%
- −$3,192
- After-tax cash flow
- $15,446/yr
For passive investors: Depreciation is non-cash, so a rental often shows a tax loss while cash-flowing — sheltering income. Rental losses are passive: they offset passive income freely, and up to $25,000/yr can offset ordinary (W-2) income if you actively participate and your MAGI is under $100k (phasing out to $0 by $150k); unused losses carry forward. On sale, claimed depreciation is recaptured at up to 25%, and gains may owe capital-gains tax (a 1031 exchange can defer both). Figures are a year-1 estimate at your 24.0% rate — not tax advice; consult a CPA.
Condition & rehab AI · 12 photos
This 6-unit complex is in excellent condition with recent updates, making it move-in ready for tenants. Minor improvements to landscaping and interior finishes would further enhance its value.
Value-add opportunities
- Both landscaping — improves curb appeal and adds value
- Both new ceiling fans — modernizes and improves air circulation
- Both new flooring in bathrooms — enhances aesthetics and durability
- Both new countertops in kitchen — modernizes and adds value
Renovation cost estimate screening
Value-add ROI direction
- Both landscaping — improves curb appeal and adds value ↑
- Both new ceiling fans — modernizes and improves air circulation ↑
- Both new flooring in bathrooms — enhances aesthetics and durability ↑
- Both new countertops in kitchen — modernizes and adds value ↑
ⓘ Cost ranges are severity-bucket heuristics (US national rule-of-thumb). Get contractor quotes + a written scope before underwriting a rehab budget.
Schools (NCES district)
- District
- Springfield SD 186
- NCES district ID
- 1737080
- Math proficiency
- 17% ▼ -7.00%
- Reading proficiency
- 22% ▼ -5.00%
- Median HH income
- $43,744
- Composite
- 16.89/100
- National rank
- #9142
- State rank
- #438 of 620 in IL
Livability — Springfield
- Score
- 79/100
- State rank
- #122
- US rank
- #2138
Category grades
Schools grade is shown separately in the Schools card above.
Census & demographics
- Census place
- Springfield, IL
- County
- Sangamon County · 115,414 people
- City population
- 59,955
- Metro
- Springfield, IL
- Population (ZIP)
- 31,033
- Household income
- $51,136
- Rent vs Own
- Severe rent burden
- 1230.0
Population outlook (Sangamon County) Hauer SSP2
- Today (2025)
- 198,317 people
- By 2030
- 196,127 · -1.1%
- By 2040
- 188,664 · -4.9%
- By 2050
- 179,624 · -9.4%
- By 2075
- 155,027 · -21.8%
- By 2100
- 122,588 · -38.2%
Race, ethnicity, and origin ACS 2023
- Neighborhood character
- Predominantly White (72%)
- Race & ethnicity
- White 72% Black 17% Two or more races 8% Hispanic / Latino 3%
- Common ancestry
- Romanian 2% Slovak 2% Serbian 1%
- Foreign-born
- 2% · Canada
- Languages at home
- 96% English-only · Spanish 1% French/Haitian/Cajun 1% Other Indo-European 1%
Political lean MEDSL · Sangamon
- 2024 margin
- Toss-up / Even · D 46.6% · R 51.6% · Other 1.8%
- 2008→2024 swing
- -9.3pp toward R · 2008: 4.4pp · 2024: -5.0pp
- All cycles
- 2024: R+5.0 2020: R+4.4 2016: R+9.4 2012: R+8.7 2008: D+4.4
Not yet ingested
- Civics
- —
Market trends
- HPI YoY
- ▼ -79.98%
- Current HPI
- 149.1926
- Rent YoY
- ▲ 4.95%
- Metro
- Springfield, IL
- State GDP YoY
- ▲ 1.59%
- F500 in state
- 60
Industry mix (Fortune 500 HQ in IL)
| Industry | F500 HQs | Revenue |
|---|---|---|
| Insurance | 4 | $201B |
|
||
| Consumer Goods | 4 | $87B |
|
||
| Industrial Machinery | 3 | $64B |
|
||
| Healthcare | 2 | $55B |
|
||
| Retail / Pharmacy | 1 | $148B |
|
||
| Agriculture / Food | 1 | $86B |
|
||
Price history
+600.0% since first listed18 events — show timeline
- 2026-05-21 Pending — RMLSA as Distributed by MLS Grid
- 2026-05-11 Listed $385,000 RMLSA as Distributed by MLS Grid
- 2025-09-08 Price Changed — RMLSA as Distributed by MLS Grid
- 2025-07-15 Price Changed — RMLSA as Distributed by MLS Grid
- 2025-05-26 Relisted — RMLSA as Distributed by MLS Grid
- 2025-05-26 Listing Removed — RMLSA as Distributed by MLS Grid
- 2025-04-30 Pending — RMLSA as Distributed by MLS Grid
- 2025-03-24 Price Changed — RMLSA as Distributed by MLS Grid
- 2025-03-07 Listed — RMLSA as Distributed by MLS Grid
- 2024-12-12 Listing Removed — RMLSA as Distributed by MLS Grid
- 2024-11-13 Price Changed — RMLSA as Distributed by MLS Grid
- 2024-09-17 Price Changed — RMLSA as Distributed by MLS Grid
- 2024-08-13 Listed — RMLSA as Distributed by MLS Grid
- 2024-06-25 Rental Removed $700 RMLSA
- 2024-06-19 Listed for Rent $700 RMLSA
- 2023-05-23 Rental Removed — RENT.
- 2019-09-25 Sold (MLS) $60,000 RMLSA as Distributed by MLS Grid
- 2019-09-12 Listed $55,000 RMLSA as Distributed by MLS Grid
Cash-flow waterfall
monthlySold comps — $/sqft
last 12 mo · ≤1 miLoading sold comps…