5824 North St · Limestone, NY
Flood risk 1/10 · Minimal
- FEMA flood zone
- X
- Chance of flooding over 30 yrs
- 0.0%
- Est. flood insurance / yr
- $507 – $1,088
Fire risk 3/10 · Minor
- Est. fire insurance / yr
- $691 – $1,283
Heat risk 2/10 · Minimal
- Hot days now (above 89°F)
- 8 days/yr
- Hot days in 30 yrs
- 18 days/yr
Wind risk 1/10 · Minimal
- Chance of severe wind over 30 yrs
- —
Air-quality risk 1/10 · Minimal
- Unhealthy air days now
- 0 days/yr
- Unhealthy air days in 30 yrs
- 0 days/yr
Risk factors via First Street. Map © Google.
Why this score? — see what drove the B+ grade
The composite is a weighted blend of 9 inputs, each scored 0–100. Each bar is that input's sub-score; the figure is the points it added to the 100-point composite (weight × sub-score).
- Cash flow +27.7/30.0
- Appreciation +10.0/10.0
- DSCR +9.8/10.0
- ARV discount +7.5/15.0
- 1% rule +7.0/10.0
- Schools +5.2/10.0
- Livability +2.9/5.0
- Rent growth +2.5/5.0
- Condition / age +2.5/5.0
$80,000
🖨 Deal sheet 📄 Offer letter ✓ Due diligence
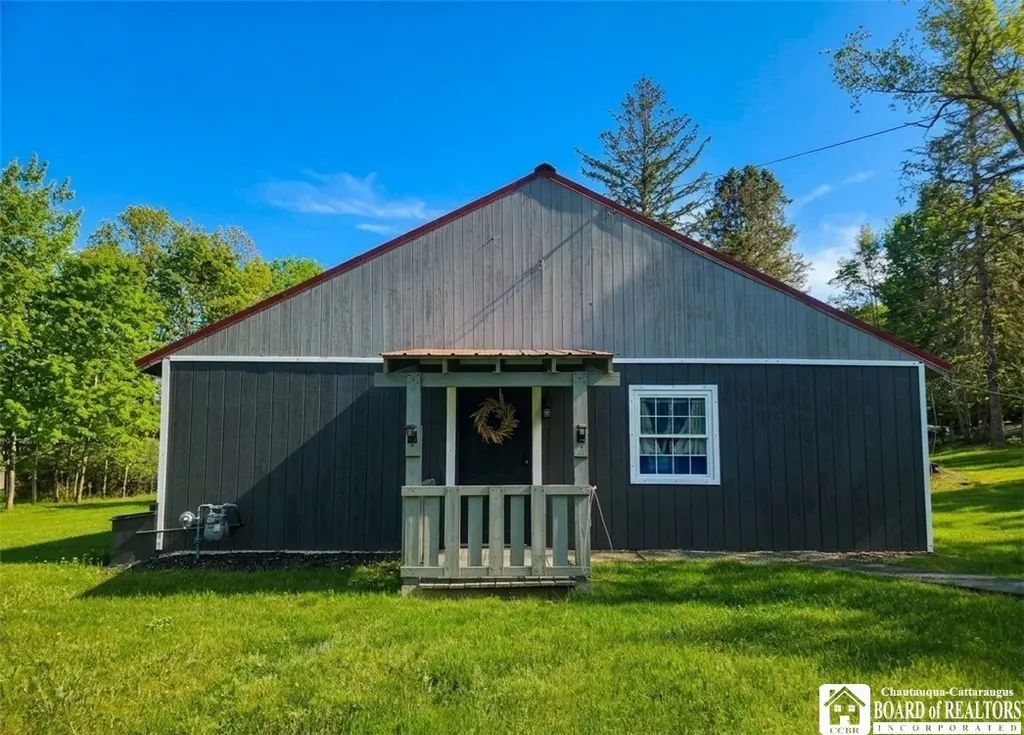
Listing remarks
Welcome to your perfect rustic getaway! Built in 2019, this beautifully crafted 1-bedroom, 1-bathroom cabin-style home offers the perfect blend of modern efficiency and cozy, Country charm. Step inside to be greeted by knotty pine throughout, soaring high ceilings, and durable, contemporary poured concrete floors. The open-concept living space feels both spacious and incredibly inviting. Comfort is guaranteed year-round with efficient natural gas heat and well-insulated vinyl windows. The home features a open concept floor plan, large bedroom and a highly functional, spacious bathroom and laundry room combination. Outdoor living is where this property truly shines. Relax on the covered back
Key facts
- Rustic getaway
- Covered back deck
- Knotty pine
Tags
Property features AI
Exterior
- Parking: Detached garage; One garage space
- Utilities: Public water (connected); Sewer connected
- Home design: Single-story home; Existing property
- Construction: Aluminum and wood siding; Metal roof; Poured slab foundation
- Exterior features: Gravel driveway; Rectangular residential lot; Road frontage on a city street; Lot dimensions approximately 150 x 205
Interior
- Kitchen: Gas oven; Gas range; Refrigerator; Kitchen island
- Bedrooms: One main-level bedroom
- Bathrooms: One full bathroom (main level)
- Heating & cooling: Gas heating; Space heater
- Interior features: Great room; Kitchen island; Kitchen/family room combo; Bedroom on main level
- Laundry & utility: Main-level laundry; Washer; Dryer; Gas water heater
Neighborhood map
What this means for you Summary
Snapshot
- This is a 1-bed/1.0-bath single-family listed at $80k.
Deal economics
- At list price, monthly cash flow is $242 ($3k/yr) — positive.
- The deal already cash-flows at list — no discount required.
- Meets the 1% rule at list price ($960 rent vs $80k).
Location & tenants
- Location reads 58/100 on livability (#1,043 in NY) — a working-class tenant base; expect higher turnover. Strengths: cost of living A+, housing A-; Watch: health & safety C-, schools D-, crime F.
- Allegany-Limestone Central School District (rural): math 55% / reading 67% proficiency, ranked #233 of 590 in NY (top 40%) — acceptable for families but not a draw, mixed tenant base, ~2y average lease.
- Market conditions: 1 active listings in the ZIP; 128 units permitted in Cattaraugus County in 2024 (21 in 5+ unit buildings).
Forward outlook
- In year one you build about $9k of equity ($553 loan paydown + $8k appreciation (10.0% local appreciation)).
- Cattaraugus County population projected at -28% by 2050 — secular population decline; favor cash flow + early exit over multi-decade hold.
- At projected returns (10.0% appreciation + 3.0% rent growth), your $22k cash investment doubles in ~2 years — after that, you're playing with house money.
- By year 4, paydown + projected appreciation supports a ~$30k cash-out refi (75% LTV) — recoverable capital for the next deal without selling this one.
Negotiation context
- Only 2 days on market — expect competitive offers; lowballing is unlikely to land.
Questions for the listing agent
- Is there a deadline driving the sale (1031 exchange, divorce, estate, relocation)? That informs how much negotiation room exists.
- Schools are D-rated, which usually means shorter tenancies and higher turnover. Who's the typical renter profile here, and what's been the actual vacancy rate?
- Crime grade is F in this area — have there been break-ins, vandalism, or insurance claims at this property in the last 3 years? What carrier currently insures it and at what premium?
- What's the average days-on-market for RENTAL listings here right now (not sales)? A rising rental-DOM trend means longer vacancies and softer asking-rent achievability than the comps imply.
- What's the recent tenant-quality profile in this submarket — average credit score on applications, eviction rate, late-payment / NSF rate, and stable-employment percentage? A property-management company in the area should have these aggregated.
- How much new for-sale + rental construction is in the pipeline within 1–3 miles? Heavy new supply typically softens prices + rents 12–24 months out; constrained supply supports both.
Investment metrics
- 1% rule
- 1.20% ✓
- Cap rate
- 9.92%
- Cash-on-cash
- 12.95%
- DSCR
- 1.58
- GRM
- 6.9
CMA / ARV
No comps found within radius.
Projected returns pro-forma
10.0% appreciation · 3.0% rent growth · sell at horizon
- IRR
- 33.8%
- Equity multiple
- 3.63×
- Total profit
- $58,960
- Equity at exit
- $72,070
- IRR
- 29.1%
- Equity multiple
- 8.21×
- Total profit
- $161,503
- Equity at exit
- $155,422
Cash invested: $22,400 (down + closing). Projections, not guarantees.
Landlord ↔ Tenant lean methodology
- Overall (STATE)
- 15 Strongly Tenant-Friendly
- State New York
- 15 Strongly Tenant-Friendly · D+10
- County
- — inherits STATE
- City
- — inherits STATE
ZIP-level market 14753
- Home prices YoY
- 2.9%
- Active inventory
- 1
- Price-to-rent
- 6.9×
Monthly cashflow live
- Estimated rent
- $960 medium interval (Pro) →
- Mortgage (P&I)
- −$420
- Tax from tax record
- −$64 /mo · $764/yr
- Insurance
- −$33
- HOA
- −$0
- Vacancy / Maint / Mgmt
- −$202
- Net cashflow
- $242
Break-even live
UW: 25.0% down · 7.5% · 30yr · 1.5% tax · 5.0% vac · 8.0% maint · 8.0% mgmt
Financing live
Cash to close
- Down payment
- $20,000
- Closing costs
- $2,400
- Reserves months
- —
- Total cash needed
- —
Loan-product check · same deal, 3 products live
Conventional
25% down · 7.5% · 30yr
- Down + closing
- —
- Monthly P&I
- —
- Monthly cashflow
- —
- DSCR
- —
- Eligible?
- —
Personal DTI + credit; lowest rate.
DSCR
20% down · 8.5% · 30yr
- Down + closing
- —
- Monthly P&I
- —
- Monthly cashflow
- —
- DSCR
- —
- Eligible?
- —
No personal income docs; deal must DSCR.
Hard money
10% down · 12.0% · 12mo
- Down + closing
- —
- Monthly P&I
- —
- Monthly cashflow
- —
- DSCR
- —
- Eligible?
- —
Short-term bridge; refi at stabilization.
Listing history 2 events
-
2026-05-22status Pending
-
2026-05-20$80,000 Active
ⓘ Source: listings_history table (triggers on properties + properties_extension) + one-shot
backfill from property_details.listing_events for pre-trigger history.
Tax reassessment forecast NY · Partial reset (capped growth)
- Current annual tax
- $764 · $64/mo
- Projected year-2 tax
- $1,058 · $88/mo
- Expected delta
- +$294/yr (+$24/mo · 38.4%)
ⓘ Screening estimate from a state-policy table — verify with the county assessor before closing.
Climate risk First Street
- Flood 1/10 Low FEMA zone X · 0% chance over 30 yrs
- Wildfire 3/10 Moderate
- Heat 2/10 Low 8 d/yr ≥89°F today · 18 d/yr by 30 yrs out
- Wind 1/10 Low
- Air quality 1/10 Low 0 unhealthy d/yr today · 0 by 30 yrs out
Nearby sold comps map
Loading sold comps map…
Walkable amenities ~0.75 mi
Loading nearby amenities…
Taxation est. · year 1
- Rental income
- $11,519
- − Mortgage interest
- −$4,481
- − Property taxes
- −$764
- − Insurance
- −$400
- − Repairs & maintenance
- −$922
- − Management
- −$922
- − Depreciation
- −$2,327
- Taxable income
- $1,703
- Est. tax owed @ 24.0%
- −$409
- After-tax cash flow
- $2,492/yr
For passive investors: Depreciation is non-cash, so a rental often shows a tax loss while cash-flowing — sheltering income. Rental losses are passive: they offset passive income freely, and up to $25,000/yr can offset ordinary (W-2) income if you actively participate and your MAGI is under $100k (phasing out to $0 by $150k); unused losses carry forward. On sale, claimed depreciation is recaptured at up to 25%, and gains may owe capital-gains tax (a 1031 exchange can defer both). Figures are a year-1 estimate at your 24.0% rate — not tax advice; consult a CPA.
Schools (NCES district)
- District
- Allegany-Limestone Central School District
- NCES district ID
- 3600015
- Math proficiency
- 55% ▼ -5.00%
- Reading proficiency
- 67% ▲ 17.00%
- Median HH income
- $47,850
- Composite
- 51.66/100
- National rank
- #1696
- State rank
- #233 of 590 in NY
Livability — Limestone
- Score
- 58/100
- State rank
- #1043
- US rank
- #20684
Category grades
Schools grade is shown separately in the Schools card above.
Census & demographics
- Census place
- Limestone, NY
- Population (ZIP)
- 929
Population outlook (Cattaraugus County) Hauer SSP2
- Today (2025)
- 71,623 people
- By 2030
- 67,751 · -5.4%
- By 2040
- 59,488 · -16.9%
- By 2050
- 51,601 · -28.0%
- By 2075
- 35,025 · -51.1%
- By 2100
- 21,243 · -70.3%
Race, ethnicity, and origin ACS 2023
- Neighborhood character
- Predominantly White (95%)
- Race & ethnicity
- White 95% Two or more races 2% Native American 1% Hispanic / Latino 1%
- Common ancestry
- Romanian 4% Slovak 2% Lithuanian 1%
- Foreign-born
- 0%
- Languages at home
- 99% English-only · Other Indo-European 1%
Political lean MEDSL · Cattaraugus
- 2024 margin
- Solid R (+32.8) · D 33.6% · R 66.4%
- 2008→2024 swing
- -22.2pp toward R · 2008: -10.6pp · 2024: -32.8pp
- All cycles
- 2024: R+32.8 2020: R+29.5 2016: R+34.4 2012: R+13.4 2008: R+10.6
Not yet ingested
- Civics
- —
Market trends
- HPI YoY
- ▲ 10.15%
- Current HPI
- 360.3827
- Rent YoY
- —
- Metro
- —
- State GDP YoY
- ▲ 2.60%
- F500 in state
- 92
Industry mix (Fortune 500 HQ in NY)
| Industry | F500 HQs | Revenue |
|---|---|---|
| Financial Services | 10 | $950B |
|
||
| Consumer Goods | 9 | $162B |
|
||
| Insurance | 4 | $225B |
|
||
| Telecommunications | 2 | $144B |
|
||
| Pharmaceuticals | 2 | $112B |
|
||
| Media / Entertainment | 2 | $69B |
|
||
Price history
2 events — show timeline
- 2026-05-22 Pending — UNYREIS
- 2026-05-20 Listed $80,000 UNYREIS
Property tax history
+12.0%/yrLatest (2025): $764 · +6.8% YoY. Source: county tax records.
Cash-flow waterfall
monthlySold comps — $/sqft
last 12 mo · ≤1 miLoading sold comps…