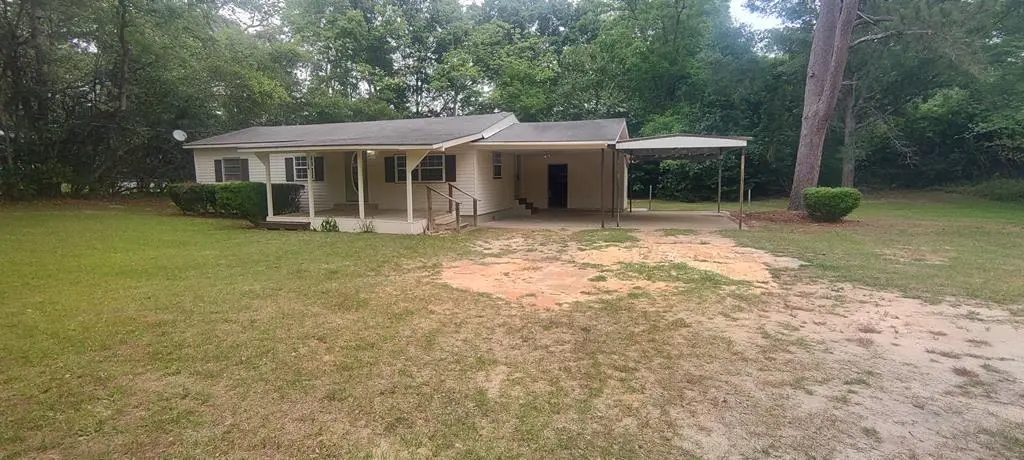
106 Martin · Opp, AL
Flood risk 1/10 · Minimal
- FEMA flood zone
- X (unshaded)
- Chance of flooding over 30 yrs
- 0.0%
- Est. flood insurance / yr
- $507 – $1,088
Fire risk 3/10 · Minor
- Est. fire insurance / yr
- $916 – $1,700
Heat risk 8/10 · Major
- Hot days now (above 107°F)
- 7 days/yr
- Hot days in 30 yrs
- 18 days/yr
Wind risk 8/10 · Major
- Chance of severe wind over 30 yrs
- 99.0%
Air-quality risk 1/10 · Minimal
- Unhealthy air days now
- 0 days/yr
- Unhealthy air days in 30 yrs
- 0 days/yr
Risk factors via First Street. Map © Google.
Why this score? — see what drove the C grade
The composite is a weighted blend of 9 inputs, each scored 0–100. Each bar is that input's sub-score; the figure is the points it added to the 100-point composite (weight × sub-score).
- Cash flow +29.8/30.0
- DSCR +10.0/10.0
- 1% rule +7.6/10.0
- Livability +3.3/5.0
- Schools +3.1/10.0
- Rent growth +2.5/5.0
- Condition / age +2.5/5.0
- ARV discount +0.0/15.0
- Appreciation +0.0/10.0
$71,500
🖨 Deal sheet (PDF) 📄 Offer letter ✓ Due diligence
Listing remarks
Charming 3-bedroom, 1-bath home featuring updated flooring throughout and situated on a spacious nearly half-acre lot. This property offers great potential for investors seeking a rental opportunity or first-time home buyers looking for an affordable place to call home. Enjoy the large yard with plenty of room for outdoor activities, expansion, or future improvements. Conveniently located with easy access to local amenities, this home combines value, space, and opportunity. Don't miss your chance to make it yours! Buyer and Buyer's Agent are responsible for independently verifying all measurements, school information, and any other details deemed important to the Buyer
Key facts
- Large yard
- Updated flooring
- 0.39 acre lot
Tags
Property features AI
Exterior
- Parking: Attached carport; Has attached garage
- Utilities: Public water; Public sewer
- Home design: Single-family residence; One story
- Construction: Vinyl siding
- Exterior features: Deck; On waterfront
Interior
- Flooring: Carpet; Vinyl
- Bathrooms: 1 full bathroom
- Interior features: Range hood
Neighborhood map
What this means for you Summary
Snapshot
- This is a 3-bed/1.0-bath single-family listed at $72k.
Deal economics
- At list price, monthly cash flow is $263 ($3k/yr) — positive.
- The deal already cash-flows at list — no discount required.
- Meets the 1% rule at list price ($902 rent vs $72k).
- Recommended offer: $70k (1.5% below list) — sets the bar for market timing.
- Cap rate 10.7% vs local median 3.9% in Opp — top-decile yield for the area; either an underpriced asset or a hidden risk that comps aren't pricing in. Stress-test before assuming the spread holds.
Location & tenants
- Location reads 66/100 on livability (#107 in AL) — a middle-class / working-renter tenant base. Strengths: cost of living A+, health & safety A+, housing A; Watch: schools D-, amenities F, commute F.
- Opp City (town): math 26% / reading 50% proficiency, ranked #37 of 129 in AL (top 29%) — families likely to look elsewhere, expect single-tenant / working-renter base with shorter leases.
- Market conditions: 64 active listings in the ZIP; 13 units permitted in Covington County in 2024 (0 in 5+ unit buildings).
Forward outlook
- Local home prices are declining (-3.0%/yr); year-one equity from $494 of loan paydown is wiped out by about $2k of value loss. Plan a longer hold.
- Covington County population projected to shrink 10% by 2050 — rents likely to lag national; underwrite the cash flow, not the appreciation.
- At projected returns (-3.0% appreciation + 3.0% rent growth), your $20k cash investment doubles in ~8 years — after that, you're playing with house money.
Negotiation context
- It's been on market 15 days — a 2% lower offer ($70k) is reasonable based on typical stale-listing flexibility.
Risks & watch-outs
- Climate carrying-cost: severe wind risk, 99% chance of damaging wind over 30y; extreme-heat days projected 7→18/yr by 2055 (HVAC capex compounding) — expect insurance premiums to compound above CPI over the hold.
Questions for the listing agent
- Built in 1960 — when were the roof, HVAC, electrical panel, plumbing, and water heater last replaced?
- Is there a deadline driving the sale (1031 exchange, divorce, estate, relocation)? That informs how much negotiation room exists.
- Schools are D-rated, which usually means shorter tenancies and higher turnover. Who's the typical renter profile here, and what's been the actual vacancy rate?
- What's the average days-on-market for RENTAL listings here right now (not sales)? A rising rental-DOM trend means longer vacancies and softer asking-rent achievability than the comps imply.
- What's the recent tenant-quality profile in this submarket — average credit score on applications, eviction rate, late-payment / NSF rate, and stable-employment percentage? A property-management company in the area should have these aggregated.
- How much new for-sale + rental construction is in the pipeline within 1–3 miles? Heavy new supply typically softens prices + rents 12–24 months out; constrained supply supports both.
Investment metrics
- 1% rule
- 1.26% ✓
- Cap rate
- 10.71%
- Cash-on-cash
- 15.77%
- DSCR
- 1.70
- GRM
- 6.6
CMA / ARV
- ARV (median comp)
- $60,497
- List price
- $71,500
- Delta
- 18.19%
- Verdict
- OVERPRICED
- Comps
- 20 within 1.0 mi
Show comp detail 7 sales within ~0.75 mi
| Address | Dist | Beds/Ba | Sqft | Sold | Price | $/sf | Match |
|---|---|---|---|---|---|---|---|
| 310 2nd St | 0.36mi | 2/1.0 (-1) | 872 (-1%) | 16mo | $25,000 | $29 | 63 |
| 607 Douglas Ave | 0.40mi | 3/1.0 | 840 (-4%) | 15mo | $35,000 | $42 | 62 |
| 309 S College St | 0.61mi | 2/1.0 (-1) | 936 (+6%) | 1mo | $20,000 | $21 | 55 |
| 109 Lillian Ct | 0.52mi | 2/1.0 (-1) | 984 (+12%) | 1mo | $155,000 | $158 | 50 |
| 109 Lillian Ct | 0.52mi | 2/1.0 (-1) | 775 (-12%) | 1mo | $155,000 | $200 | 50 |
| 101 N Hughes St | 0.63mi | 2/1.0 (-1) | 990 (+12%) | 2mo | $76,000 | $77 | 43 |
| 608 Woodham Cir | 0.69mi | 3/1.0 | 995 (+13%) | 5mo | $90,000 | $90 | 42 |
Match score weights: distance 35% · size 25% · config 20% · recency 20%. Top-matched comps best support the ARV.
Projected returns pro-forma
-3.0% appreciation · 3.0% rent growth · sell at horizon
- IRR
- 6.6%
- Equity multiple
- 1.26×
- Total profit
- $5,155
- Equity at exit
- $10,661
- IRR
- 15.9%
- Equity multiple
- 2.30×
- Total profit
- $26,008
- Equity at exit
- $6,182
Cash invested: $20,020 (down + closing). Projections, not guarantees.
Landlord ↔ Tenant lean methodology
- Overall (STATE)
- 90 Strongly Landlord-Friendly
- State Alabama
- 90 Strongly Landlord-Friendly · R+15
- County
- — inherits STATE
- City
- — inherits STATE
ZIP-level market 36467
- Home prices YoY
- -20.9%
- Active inventory
- 64
- Price-to-rent
- 6.6×
Monthly cashflow live
- Estimated rent
- $902 medium interval (Pro) →
- Mortgage (P&I)
- −$375
- Tax from tax record
- −$45 /mo · $541/yr
- Insurance
- −$30
- HOA
- −$0
- Vacancy / Maint / Mgmt
- −$189
- Net cashflow
- $263
Break-even live
Sensitivity live
| Price | -10% $304 | -5% $283 | +0% $263 | +5% $243 | +10% $223 |
|---|---|---|---|---|---|
| Rent | -10% $192 | -5% $227 | +0% $263 | +5% $299 | +10% $334 |
| Rate | -1.0pp $299 | -0.5pp $281 | base $263 | +0.5pp $245 | +1.0pp $226 |
UW: 25.0% down · 7.5% · 30yr · 1.5% tax · 5.0% vac · 8.0% maint · 8.0% mgmt
Financing live
Cash to close
- Down payment
- $17,875
- Closing costs
- $2,145
- Reserves months
- —
- Total cash needed
- —
Loan-product check · same deal, 3 products live
Conventional
25% down · 7.5% · 30yr
- Down + closing
- —
- Monthly P&I
- —
- Monthly cashflow
- —
- DSCR
- —
- Eligible?
- —
Personal DTI + credit; lowest rate.
DSCR
20% down · 8.5% · 30yr
- Down + closing
- —
- Monthly P&I
- —
- Monthly cashflow
- —
- DSCR
- —
- Eligible?
- —
No personal income docs; deal must DSCR.
Hard money
10% down · 12.0% · 12mo
- Down + closing
- —
- Monthly P&I
- —
- Monthly cashflow
- —
- DSCR
- —
- Eligible?
- —
Short-term bridge; refi at stabilization.
Listing history 2 events
-
2026-05-14status Pending 677-char remark
-
2026-04-29$71,500 Active 677-char remark
ⓘ Source: listings_history table (triggers on properties + properties_extension) + one-shot
backfill from property_details.listing_events for pre-trigger history.
Tax reassessment forecast AL · Resets to sale price
- Current annual tax
- $541 · $45/mo
- Projected year-2 tax
- $541 · $45/mo
- Expected delta
- $0/yr ($0/mo · 0.0%)
ⓘ Screening estimate from a state-policy table — verify with the county assessor before closing.
Climate risk First Street
- Flood 1/10 Low FEMA zone X (unshaded) · 0% chance over 30 yrs
- Wildfire 3/10 Moderate
- Heat 8/10 Severe 7 d/yr ≥107°F today · 18 d/yr by 30 yrs out
- Wind 8/10 Severe 99% chance of damaging wind over 30 yrs
- Air quality 1/10 Low 0 unhealthy d/yr today · 0 by 30 yrs out
Nearby sold comps map
Loading sold comps map…
Walkable amenities ~0.75 mi
Loading nearby amenities…
Taxation est. · year 1
- Rental income
- $10,828
- − Mortgage interest
- −$4,005
- − Property taxes
- −$541
- − Insurance
- −$358
- − Repairs & maintenance
- −$866
- − Management
- −$866
- − Depreciation
- −$2,080
- Taxable income
- $2,113
- Est. tax owed @ 24.0%
- −$507
- After-tax cash flow
- $2,650/yr
For passive investors: Depreciation is non-cash, so a rental often shows a tax loss while cash-flowing — sheltering income. Rental losses are passive: they offset passive income freely, and up to $25,000/yr can offset ordinary (W-2) income if you actively participate and your MAGI is under $100k (phasing out to $0 by $150k); unused losses carry forward. On sale, claimed depreciation is recaptured at up to 25%, and gains may owe capital-gains tax (a 1031 exchange can defer both). Figures are a year-1 estimate at your 24.0% rate — not tax advice; consult a CPA.
Schools (NCES district)
- District
- Opp City
- NCES district ID
- 0102610
- Math proficiency
- 26% ▼ -19.00%
- Reading proficiency
- 50% ▲ 5.00%
- Median HH income
- $32,756
- Composite
- 31.09/100
- National rank
- #6073
- State rank
- #37 of 129 in AL
Livability — Opp
- Score
- 66/100
- State rank
- #107
- US rank
- #11901
Category grades
Schools grade is shown separately in the Schools card above.
Census & demographics
- Census place
- Opp, AL
- City population
- 9,847
- Population (ZIP)
- 9,847
Population outlook (Covington County) Hauer SSP2
- Today (2025)
- 37,007 people
- By 2030
- 36,401 · -1.6%
- By 2040
- 34,983 · -5.5%
- By 2050
- 33,437 · -9.6%
- By 2075
- 29,753 · -19.6%
- By 2100
- 25,109 · -32.2%
Race, ethnicity, and origin ACS 2023
- Neighborhood character
- Predominantly White (84%)
- Race & ethnicity
- White 84% Black 12% Two or more races 4%
- Common ancestry
- Serbian 1% Italian 1% Slovak 1%
- Foreign-born
- 1% · South Korea
- Languages at home
- 99% English-only · Spanish 1%
Political lean MEDSL · Covington
- 2024 margin
- Solid R (+72.4) · D 13.6% · R 86.0%
- 2008→2024 swing
- -14.1pp toward R · 2008: -58.3pp · 2024: -72.4pp
- All cycles
- 2024: R+72.4 2020: R+68.1 2016: R+68.5 2012: R+58.3 2008: R+58.3
Not yet ingested
- Civics
- —
Market trends
- HPI YoY
- ▼ -39.82%
- Current HPI
- 151.1871
- Rent YoY
- —
- Metro
- —
- State GDP YoY
- ▲ 2.94%
- F500 in state
- 4
Industry mix (Fortune 500 HQ in AL)
| Industry | F500 HQs | Revenue |
|---|---|---|
| Financial Services | 1 | $8B |
|
||
| Healthcare | 1 | $5B |
|
||
Price history
+0.0% since first listed3 events — show timeline
- 2026-06-12 Sold (MLS) $71,500 SAMLS
- 2026-05-14 Pending — SAMLS
- 2026-04-29 Listed $71,500 SAMLS
Property tax history
+5.8%/yrLatest (2025): $541 · +6.9% YoY. Source: county tax records.
Cash-flow waterfall
monthlySold comps — $/sqft
last 12 mo · ≤1 miLoading sold comps…