270 Gravel Ridge Rd · Eva, AL
Flood risk 1/10 · Minimal
- FEMA flood zone
- X (unshaded)
- Chance of flooding over 30 yrs
- 0.0%
- Est. flood insurance / yr
- $507 – $1,088
Fire risk 4/10 · Minor
- Est. fire insurance / yr
- $916 – $1,700
Heat risk 4/10 · Minor
- Hot days now (above 104°F)
- 7 days/yr
- Hot days in 30 yrs
- 20 days/yr
Wind risk 4/10 · Minor
- Chance of severe wind over 30 yrs
- 21.0%
Air-quality risk 2/10 · Minimal
- Unhealthy air days now
- 0 days/yr
- Unhealthy air days in 30 yrs
- 1 days/yr
Risk factors via First Street. Map © Google.
Why this score? — see what drove the C grade
The composite is a weighted blend of 9 inputs, each scored 0–100. Each bar is that input's sub-score; the figure is the points it added to the 100-point composite (weight × sub-score).
- Cash flow +16.0/30.0
- ARV discount +15.0/15.0
- Appreciation +7.1/10.0
- DSCR +4.9/10.0
- Livability +3.3/5.0
- 1% rule +3.1/10.0
- Schools +2.7/10.0
- Rent growth +2.5/5.0
- Condition / age +2.5/5.0
$198,000
🖨 Deal sheet (PDF) 📄 Offer letter ✓ Due diligence
Listing remarks MLS
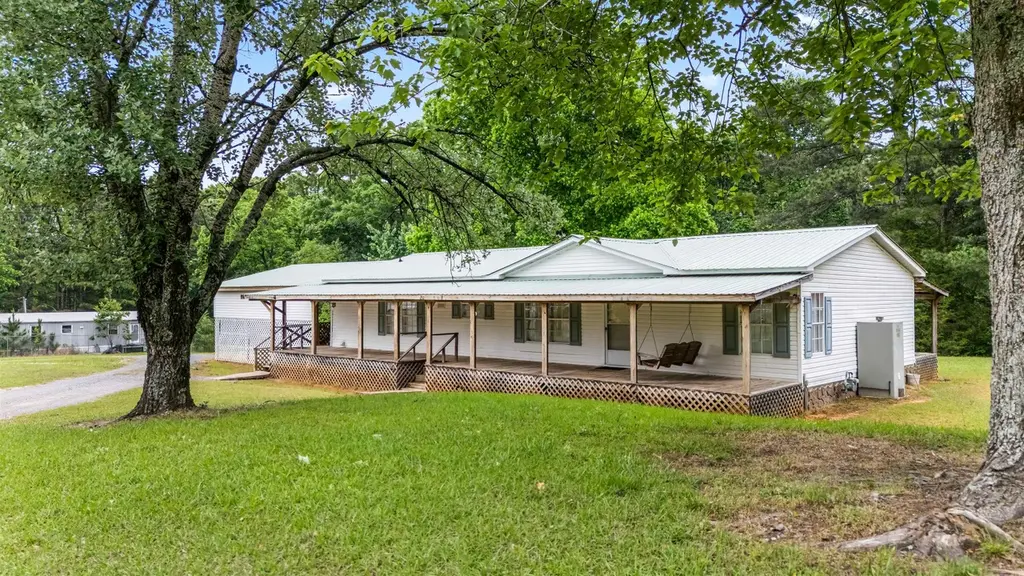
A 3BR 2BA double wide located on 1.3 acre sized lot. This home offers a large living room with a fireplace, a master suite with large bathroom and closets. Front and back porches expand down the entire length of home. The home also has natural gas supplemental heaters throughout. With 4 total outbuildings and storm shelter. Property also has a 2nd septic tank, power pole and water meter for an additional home or mobile home if desired.
Key facts
- Master suite
- Large bathroom
- Large living room
Tags
Neighborhood map
What this means for you Summary
Snapshot
- This is a 3-bed/2.0-bath single-family listed at $198k.
Deal economics
- At list price, monthly cash flow is $98 ($1k/yr) — positive.
- The deal already cash-flows at list — no discount required.
- To meet the 1% rule (rent ≥ 1% of price), the offer needs to be $159k (19.5% below list).
- Recommended offer: $159k (19.5% below list) — sets the bar for 1% rule.
Location & tenants
- Location reads 66/100 on livability (#104 in AL) — a middle-class / working-renter tenant base. Strengths: crime A+, cost of living A+, housing A+; Watch: amenities F, commute F, health & safety F.
- Morgan County (rural): math 19% / reading 43% proficiency, ranked #61 of 129 in AL (top 47%) — families likely to look elsewhere, expect single-tenant / working-renter base with shorter leases.
- Zoned schools: Eva School (math 23% / reading 47%, grade F, #291 of 627 statewide, top 47%, 371 students, 64% FRL); Albert P Brewer High School (math 22% / reading 27%, grade F, #118 of 305 statewide, top 45%, 717 students, 59% FRL) — zoned schools average 62% FRL vs 44% district-wide (18 pts higher); higher-poverty schools than district average — tighter screening recommended.
- Market conditions: 21 active listings in the ZIP; 231 units permitted in Morgan County in 2024 (0 in 5+ unit buildings).
Forward outlook
- In year one you build about $10k of equity ($1k loan paydown + $8k appreciation (4.2% local appreciation)).
- Morgan County population projected at -11% by 2050 — secular population decline; favor cash flow + early exit over multi-decade hold.
- At projected returns (4.2% appreciation + 3.0% rent growth), your $55k cash investment doubles in ~5 years — after that, you're playing with house money.
- By year 4, paydown + projected appreciation supports a ~$33k cash-out refi (75% LTV) — recoverable capital for the next deal without selling this one.
Negotiation context
- It's been on market 226 days — a 12% lower offer ($174k) is reasonable based on typical stale-listing flexibility.
- 2 sale attempts with the ask held roughly flat each time — persistent listings suggest the price (not the market) is what's stuck; bring a comps-based counter.
- Current owner paid $97k; list at $198k implies a 104% gain — meaningful room to come down on a strong offer.
Questions for the listing agent
- It's been on market 226 days. Have you received any prior offers? Is the seller open to a 19% concession, seller financing, or rate buy-down credit?
- Why hasn't it sold? Are there any deal-killer items the seller is aware of (foundation, flood, title, zoning, code violations)?
- Is there a deadline driving the sale (1031 exchange, divorce, estate, relocation)? That informs how much negotiation room exists.
- Schools are D-rated, which usually means shorter tenancies and higher turnover. Who's the typical renter profile here, and what's been the actual vacancy rate?
- What's the average days-on-market for RENTAL listings here right now (not sales)? A rising rental-DOM trend means longer vacancies and softer asking-rent achievability than the comps imply.
- What's the recent tenant-quality profile in this submarket — average credit score on applications, eviction rate, late-payment / NSF rate, and stable-employment percentage? A property-management company in the area should have these aggregated.
- How much new for-sale + rental construction is in the pipeline within 1–3 miles? Heavy new supply typically softens prices + rents 12–24 months out; constrained supply supports both.
Investment metrics
- 1% rule
- 0.81% ✗
- Cap rate
- 6.89%
- Cash-on-cash
- 2.13%
- DSCR
- 1.09
- GRM
- 10.3
CMA / ARV
- ARV (median comp)
- $290,525
- List price
- $198,000
- Delta
- -31.85%
- Verdict
- UNDERPRICED
- Comps
- 9 within 1.0 mi
Show comp detail 2 sales within ~0.75 mi
| Address | Dist | Beds/Ba | Sqft | Sold | Price | $/sf | Match |
|---|---|---|---|---|---|---|---|
| 83 Courtney Dr | 0.16mi | 4/2.0 (+1) | 1,643 (+9%) | 13mo | $275,000 | $167 | 62 |
| 28 Courtney Dr | 0.13mi | 3/2.0 | 1,700 (+12%) | 13mo | $315,000 | $185 | 62 |
Match score weights: distance 35% · size 25% · config 20% · recency 20%. Top-matched comps best support the ARV.
Projected returns pro-forma
4.18% appreciation · 3.0% rent growth · sell at horizon
- IRR
- 12.6%
- Equity multiple
- 1.77×
- Total profit
- $42,616
- Equity at exit
- $102,445
- IRR
- 13.9%
- Equity multiple
- 3.31×
- Total profit
- $128,031
- Equity at exit
- $169,219
Cash invested: $55,440 (down + closing). Projections, not guarantees.
Landlord ↔ Tenant lean methodology
- Overall (STATE)
- 90 Strongly Landlord-Friendly
- State Alabama
- 90 Strongly Landlord-Friendly · R+15
- County
- — inherits STATE
- City
- — inherits STATE
ZIP-level market 35621
- Home prices YoY
- 1.4%
- Active inventory
- 21
- Price-to-rent
- 10.3×
Monthly cashflow live
- Estimated rent
- $1,595 medium interval (Pro) →
- Mortgage (P&I)
- −$1,038
- Tax from tax record
- −$41 /mo · $488/yr
- Insurance
- −$82
- HOA
- −$0
- Vacancy / Maint / Mgmt
- −$335
- Net cashflow
- $98
Break-even live
Sensitivity live
| Price | -10% $210 | -5% $154 | +0% $98 | +5% $42 | +10% $-14 |
|---|---|---|---|---|---|
| Rent | -10% $-28 | -5% $35 | +0% $98 | +5% $161 | +10% $224 |
| Rate | -1.0pp $198 | -0.5pp $149 | base $98 | +0.5pp $47 | +1.0pp $-5 |
UW: 25.0% down · 7.5% · 30yr · 1.5% tax · 5.0% vac · 8.0% maint · 8.0% mgmt
Financing live
Cash to close
- Down payment
- $49,500
- Closing costs
- $5,940
- Reserves months
- —
- Total cash needed
- —
Loan-product check · same deal, 3 products live
Conventional
25% down · 7.5% · 30yr
- Down + closing
- —
- Monthly P&I
- —
- Monthly cashflow
- —
- DSCR
- —
- Eligible?
- —
Personal DTI + credit; lowest rate.
DSCR
20% down · 8.5% · 30yr
- Down + closing
- —
- Monthly P&I
- —
- Monthly cashflow
- —
- DSCR
- —
- Eligible?
- —
No personal income docs; deal must DSCR.
Hard money
10% down · 12.0% · 12mo
- Down + closing
- —
- Monthly P&I
- —
- Monthly cashflow
- —
- DSCR
- —
- Eligible?
- —
Short-term bridge; refi at stabilization.
Listing history 18 events
-
2026-06-21days on market $198,000 Active 226 DOM
-
2026-06-18days on market $198,000 Active 223 DOM
-
2026-06-17days on market $198,000 Active 222 DOM
-
2026-06-16days on market $198,000 Active 221 DOM
-
2026-06-15days on market $198,000 Active 220 DOM
-
2026-06-14days on market $198,000 Active 218 DOM
-
2026-06-13days on market $198,000 Active 217 DOM
-
2026-06-10days on market $198,000 Active 215 DOM
-
2026-06-09days on market $198,000 Active 214 DOM
-
2026-06-08days on market $198,000 Active 213 DOM
-
2026-06-07days on market $198,000 Active 212 DOM
-
2026-06-02days on market $198,000 Active 207 DOM
-
2026-06-01days on market $198,000 Active 206 DOM
-
2026-05-31days on market $198,000 Active 205 DOM
-
2026-05-30days on market $198,000 Active 204 DOM
-
2026-05-06status Active 439-char remark
Show marketing remark (439 chars)
A 3BR 2BA double wide located on 1.3 acre sized lot. This home offers a large living room with a fireplace, a master suite with large bathroom and closets. Front and back porches expand down the entire length of home. The home also has natural gas supplemental heaters throughout. With 4 total outbuildings and storm shelter. Property also has a 2nd septic tank, power pole and water meter for an additional home or mobile home if desired.
-
2025-11-04$198,000 Active 439-char remark
Show marketing remark (439 chars)
A 3BR 2BA double wide located on 1.3 acre sized lot. This home offers a large living room with a fireplace, a master suite with large bathroom and closets. Front and back porches expand down the entire length of home. The home also has natural gas supplemental heaters throughout. With 4 total outbuildings and storm shelter. Property also has a 2nd septic tank, power pole and water meter for an additional home or mobile home if desired.
-
2014-12-30soldstatus $97,000
ⓘ Source: listings_history table (triggers on properties + properties_extension) + one-shot
backfill from property_details.listing_events for pre-trigger history.
Tax reassessment forecast AL · Resets to sale price
- Current annual tax
- $488 · $41/mo
- Projected year-2 tax
- $812 · $68/mo
- Expected delta
- +$323/yr (+$27/mo · 66.2%)
ⓘ Screening estimate from a state-policy table — verify with the county assessor before closing.
Climate risk First Street
- Flood 1/10 Low FEMA zone X (unshaded) · 0% chance over 30 yrs
- Wildfire 4/10 Moderate
- Heat 4/10 Moderate 7 d/yr ≥104°F today · 20 d/yr by 30 yrs out
- Wind 4/10 Moderate 21% chance of damaging wind over 30 yrs
- Air quality 2/10 Low 0 unhealthy d/yr today · 1 by 30 yrs out
Nearby sold comps map
Loading sold comps map…
Walkable amenities ~0.75 mi
Loading nearby amenities…
Taxation est. · year 1
- Rental income
- $19,136
- − Mortgage interest
- −$11,091
- − Property taxes
- −$488
- − Insurance
- −$990
- − Repairs & maintenance
- −$1,531
- − Management
- −$1,531
- − Depreciation
- −$5,760
- Taxable loss
- −$2,255
- Est. tax savings @ 24.0%
- +$541
- After-tax cash flow
- $1,720/yr
For passive investors: Depreciation is non-cash, so a rental often shows a tax loss while cash-flowing — sheltering income. Rental losses are passive: they offset passive income freely, and up to $25,000/yr can offset ordinary (W-2) income if you actively participate and your MAGI is under $100k (phasing out to $0 by $150k); unused losses carry forward. On sale, claimed depreciation is recaptured at up to 25%, and gains may owe capital-gains tax (a 1031 exchange can defer both). Figures are a year-1 estimate at your 24.0% rate — not tax advice; consult a CPA.
Schools (NCES district)
- District
- Morgan County
- NCES district ID
- 0102480
- Math proficiency
- 19% ▼ -28.00%
- Reading proficiency
- 43% ▼ -3.00%
- Median HH income
- $47,362
- Composite
- 26.68/100
- National rank
- #7157
- State rank
- #61 of 129 in AL
Livability — Eva
- Score
- 66/100
- State rank
- #104
- US rank
- #11687
Category grades
Schools grade is shown separately in the Schools card above.
Census & demographics
- Census place
- Eva, AL
- Population (ZIP)
- 3,292
Population outlook (Morgan County) Hauer SSP2
- Today (2025)
- 118,775 people
- By 2030
- 116,979 · -1.5%
- By 2040
- 111,800 · -5.9%
- By 2050
- 105,181 · -11.4%
- By 2075
- 87,736 · -26.1%
- By 2100
- 67,624 · -43.1%
Race, ethnicity, and origin ACS 2023
- Neighborhood character
- Predominantly White (93%)
- Race & ethnicity
- White 93% Asian 4% Two or more races 2%
- Common ancestry
- Slovak 3% Serbian 2% Iranian 1%
- Foreign-born
- 3% · Canada
- Languages at home
- 98% English-only · Other Asian/Pacific 1% Spanish 1%
Political lean MEDSL · Morgan
- 2024 margin
- Solid R (+52.6) · D 23.2% · R 75.8%
- 2008→2024 swing
- -8.8pp toward R · 2008: -43.8pp · 2024: -52.6pp
- All cycles
- 2024: R+52.6 2020: R+49.2 2016: R+52.4 2012: R+44.5 2008: R+43.8
Not yet ingested
- Civics
- —
Market trends
- HPI YoY
- ▲ 4.18%
- Current HPI
- 299.7823
- Rent YoY
- —
- Metro
- —
- State GDP YoY
- ▲ 2.94%
- F500 in state
- 4
Industry mix (Fortune 500 HQ in AL)
| Industry | F500 HQs | Revenue |
|---|---|---|
| Financial Services | 1 | $8B |
|
||
| Healthcare | 1 | $5B |
|
||
Price history
+104.1% since first listed3 events — show timeline
- 2026-05-06 Relisted — SAARMLS
- 2025-11-04 Listed $198,000 SAARMLS
- 2014-12-30 Sold (Public Records) $97,000 Public Records
Property tax history
+6.0%/yrLatest (2025): $488 · +69.6% YoY. Source: county tax records.
Cash-flow waterfall
monthlySold comps — $/sqft
last 12 mo · ≤1 miLoading sold comps…