12203 Blue Wing Dr · Carrollton, VA
Flood risk No data
- FEMA flood zone
- —
- Chance of flooding over 30 yrs
- —
- Est. flood insurance / yr
- —
Fire risk No data
- Est. fire insurance / yr
- —
Heat risk No data
- Hot days now (above threshold)
- —
- Hot days in 30 yrs
- —
Wind risk No data
- Chance of severe wind over 30 yrs
- —
Air-quality risk No data
- Unhealthy air days now
- —
- Unhealthy air days in 30 yrs
- —
Risk factors via First Street. Map © Google.
Why this score? — see what drove the D+ grade
The composite is a weighted blend of 9 inputs, each scored 0–100. Each bar is that input's sub-score; the figure is the points it added to the 100-point composite (weight × sub-score).
- Cash flow +15.0/30.0
- ARV discount +7.5/15.0
- Schools +5.9/10.0
- 1% rule +5.0/10.0
- DSCR +5.0/10.0
- Condition / age +4.0/5.0
- Livability +3.6/5.0
- Rent growth +2.5/5.0
- Appreciation +0.0/10.0
$38,000
🖨 Deal sheet 📄 Offer letter ✓ Due diligence
Listing remarks
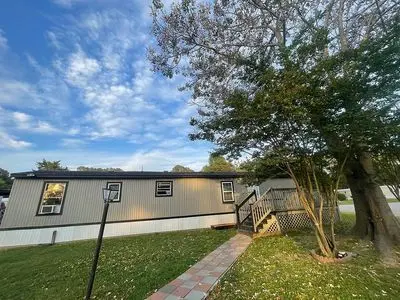
Mobile home for sale!???? Jones Creek Landing Mobile home park 2bedrooms 1 bath - Huge yard - new roof - new windows -new siding - plumbing done 6 months ago -new cabinets -Has 2 car driveway with 1-2 car parking spaces on street. -good size shed with 2 lawnmowers included -All appliances will be included - laundry unit set still new 8 months old -built in 1989, 980sqft Lot rent each month will Be 675$ Asking 48,000$ or best offer FOR SALE ONLY???? No investors, No agents, No renting, No financing.
Key facts
- Huge yard
- Plumbing done
- New siding
Tags
Neighborhood map
What this means for you Summary
Snapshot
- This is a 2-bed/1.0-bath other listed at $38k. Condition is rated good.
Deal economics
- At list price, monthly cash flow is $1k ($14k/yr) — positive.
- The deal already cash-flows at list — no discount required.
- Meets the 1% rule at list price ($2k rent vs $38k).
- Recommended offer: $37k (3.0% below list) — sets the bar for market timing.
- Cap rate 44.0% vs local median 3.4% in Carrollton — top-decile yield for the area; either an underpriced asset or a hidden risk that comps aren't pricing in. Stress-test before assuming the spread holds.
Location & tenants
- Location reads 72/100 on livability (#201 in VA) — a middle-class / working-renter tenant base. Strengths: schools A+, crime A+, employment A+; Watch: amenities F, commute F, cost of living D-.
- Isle Of Wight County Public School District (rural): math 62% / reading 73% proficiency, ranked #28 of 131 in VA (top 21%) — acceptable for families but not a draw, mixed tenant base, ~2y average lease.
- Market conditions: 148 active listings in the ZIP; solid renter incomes; 257 units permitted in Isle of Wight County in 2024 (0 in 5+ unit buildings).
Forward outlook
- Local home prices are declining (-3.0%/yr); year-one equity from $263 of loan paydown is wiped out by about $1k of value loss. Plan a longer hold.
- Isle of Wight County population projected at +10% by 2050 — modest demand growth; plan on rents tracking national, not racing it.
- At projected returns (-3.0% appreciation + 3.0% rent growth), your $11k cash investment doubles in ~1 year — after that, you're playing with house money.
Negotiation context
- It's been on market 37 days — a 3% lower offer ($37k) is reasonable based on typical stale-listing flexibility.
Questions for the listing agent
- It's been on market 37 days. Have you received any prior offers? Is the seller open to a 3% concession, seller financing, or rate buy-down credit?
- Is there a deadline driving the sale (1031 exchange, divorce, estate, relocation)? That informs how much negotiation room exists.
- Schools are A-rated — typically a magnet for longer-tenancy family renters. What's the average tenant stay here, and is there a school-zone premium baked into asking?
- The area grade is low — what's the realistic commute time and amenity access for the typical tenant pool here? Any planned neighborhood developments (good or bad) we should know about?
- What's the average days-on-market for RENTAL listings here right now (not sales)? A rising rental-DOM trend means longer vacancies and softer asking-rent achievability than the comps imply.
- What's the recent tenant-quality profile in this submarket — average credit score on applications, eviction rate, late-payment / NSF rate, and stable-employment percentage? A property-management company in the area should have these aggregated.
- How much new for-sale + rental construction is in the pipeline within 1–3 miles? Heavy new supply typically softens prices + rents 12–24 months out; constrained supply supports both.
Investment metrics
- 1% rule
- 4.85% ✓
- Cap rate
- 43.98%
- Cash-on-cash
- 134.58%
- DSCR
- 6.99
- GRM
- 1.7
CMA / ARV
No comps found within radius.
Projected returns pro-forma
-3.0% appreciation · 3.0% rent growth · sell at horizon
- IRR
- —
- Equity multiple
- 7.57×
- Total profit
- $69,870
- Equity at exit
- $5,666
- IRR
- —
- Equity multiple
- 15.93×
- Total profit
- $158,816
- Equity at exit
- $3,286
Cash invested: $10,640 (down + closing). Projections, not guarantees.
Landlord ↔ Tenant lean methodology
- Overall (STATE)
- 55 Moderately Landlord-Leaning
- State Virginia
- 55 Moderately Landlord-Leaning · D+2
- County
- — inherits STATE
- City
- — inherits STATE
ZIP-level market 23314
- Home prices YoY
- -12.2%
- Active inventory
- 148
- Price-to-rent
- 1.7×
Monthly cashflow live
- Estimated rent
- $1,843 medium interval (Pro) →
- Mortgage (P&I)
- −$199
- Tax est. 1.5%
- −$48 /mo · $570/yr
- Insurance
- −$16
- HOA
- −$0
- Vacancy / Maint / Mgmt
- −$387
- Net cashflow
- $1,193
Break-even live
UW: 25.0% down · 7.5% · 30yr · 1.5% tax · 5.0% vac · 8.0% maint · 8.0% mgmt
Financing live
Cash to close
- Down payment
- $9,500
- Closing costs
- $1,140
- Reserves months
- —
- Total cash needed
- —
Loan-product check · same deal, 3 products live
Conventional
25% down · 7.5% · 30yr
- Down + closing
- —
- Monthly P&I
- —
- Monthly cashflow
- —
- DSCR
- —
- Eligible?
- —
Personal DTI + credit; lowest rate.
DSCR
20% down · 8.5% · 30yr
- Down + closing
- —
- Monthly P&I
- —
- Monthly cashflow
- —
- DSCR
- —
- Eligible?
- —
No personal income docs; deal must DSCR.
Hard money
10% down · 12.0% · 12mo
- Down + closing
- —
- Monthly P&I
- —
- Monthly cashflow
- —
- DSCR
- —
- Eligible?
- —
Short-term bridge; refi at stabilization.
Listing history 13 events
-
2026-06-18days on market $38,000 Active 37 DOM
-
2026-06-17days on market $38,000 Active 36 DOM
-
2026-06-16days on market $38,000 Active 35 DOM
-
2026-06-15days on market $38,000 Active 34 DOM
-
2026-06-09days on market $38,000 Active 28 DOM
-
2026-06-08days on market $38,000 Active 27 DOM
-
2026-06-07days on market $38,000 Active 26 DOM
-
2026-06-03days on market $38,000 Active 22 DOM
-
2026-06-02days on market $38,000 Active 21 DOM
-
2026-06-01days on market $38,000 Active 20 DOM
-
2026-05-31days on market $38,000 Active 19 DOM
-
2026-05-13price $38,000 522-char remark
-
2026-05-12$48,000 Active 522-char remark
ⓘ Source: listings_history table (triggers on properties + properties_extension) + one-shot
backfill from property_details.listing_events for pre-trigger history.
Nearby sold comps map
Loading sold comps map…
Walkable amenities ~0.75 mi
Loading nearby amenities…
Taxation est. · year 1
- Rental income
- $22,115
- − Mortgage interest
- −$2,129
- − Property taxes
- −$570
- − Insurance
- −$190
- − Repairs & maintenance
- −$1,769
- − Management
- −$1,769
- − Depreciation
- −$1,105
- Taxable income
- $14,582
- Est. tax owed @ 24.0%
- −$3,500
- After-tax cash flow
- $10,819/yr
For passive investors: Depreciation is non-cash, so a rental often shows a tax loss while cash-flowing — sheltering income. Rental losses are passive: they offset passive income freely, and up to $25,000/yr can offset ordinary (W-2) income if you actively participate and your MAGI is under $100k (phasing out to $0 by $150k); unused losses carry forward. On sale, claimed depreciation is recaptured at up to 25%, and gains may owe capital-gains tax (a 1031 exchange can defer both). Figures are a year-1 estimate at your 24.0% rate — not tax advice; consult a CPA.
Condition & rehab AI · 1 photo
This mobile home is in good condition with recent renovations, including a new roof, siding, and cabinets. It's move-in ready with a good yard and shed, making it a solid investment.
Value-add opportunities
- Both Paint exterior — Fresh paint enhances curb appeal and value
- Both Replace landscaping — Fresh landscaping improves curb appeal and rental value
- Both Install smart home devices — Enhances home's appeal and could increase rental price
Renovation cost estimate screening
Value-add ROI direction
- Both Paint exterior — Fresh paint enhances curb appeal and value ↑
- Both Replace landscaping — Fresh landscaping improves curb appeal and rental value ↑
- Both Install smart home devices — Enhances home's appeal and could increase rental price ↑
ⓘ Cost ranges are severity-bucket heuristics (US national rule-of-thumb). Get contractor quotes + a written scope before underwriting a rehab budget.
Schools (NCES district)
- District
- Isle Of Wight County Public School District
- NCES district ID
- 5102010
- Math proficiency
- 62% ▼ -21.00%
- Reading proficiency
- 73% ▼ -7.00%
- Median HH income
- $64,756
- Composite
- 58.67/100
- National rank
- #982
- State rank
- #28 of 131 in VA
Livability — Carrollton
- Score
- 72/100
- State rank
- #201
- US rank
- #6196
Category grades
Schools grade is shown separately in the Schools card above.
Census & demographics
- County
- Isle of Wight County · 10,099 people
- City population
- 10,099
- Metro
- Virginia Beach-Norfolk-Newport News, VA-NC
- Population (ZIP)
- 10,099
- Household income
- $104,029
- Rent vs Own
- Severe rent burden
- 323.0
Population outlook (Isle of Wight County) Hauer SSP2
- Today (2025)
- 39,005 people
- By 2030
- 40,089 · +2.8%
- By 2040
- 41,703 · +6.9%
- By 2050
- 42,745 · +9.6%
- By 2075
- 47,222 · +21.1%
- By 2100
- 47,810 · +22.6%
Race, ethnicity, and origin ACS 2023
- Neighborhood character
- Predominantly White (66%)
- Race & ethnicity
- White 66% Black 21% Two or more races 9% Hispanic / Latino 8% Asian 3%
- Hispanic origin (detail)
- Mexican 4%
- Common ancestry
- Italian 4% Romanian 4% Slovak 3%
- Foreign-born
- 4% · Canada, Vietnam
- Languages at home
- 95% English-only · Spanish 4% Vietnamese 1%
Political lean MEDSL · Isle of Wight
- 2024 margin
- R (+19.8) · D 39.6% · R 59.4%
- 2008→2024 swing
- -6.4pp toward R · 2008: -13.4pp · 2024: -19.8pp
- All cycles
- 2024: R+19.8 2020: R+18.4 2016: R+21.0 2012: R+14.7 2008: R+13.4
Not yet ingested
- Civics
- —
Market trends
- HPI YoY
- ▼ -37.21%
- Current HPI
- 267.9382
- Rent YoY
- —
- Metro
- Virginia Beach-Norfolk-Newport News, VA-NC
- State GDP YoY
- ▲ 2.40%
- F500 in state
- 50
Industry mix (Fortune 500 HQ in VA)
| Industry | F500 HQs | Revenue |
|---|---|---|
| Aerospace / Defense | 4 | $236B |
|
||
| Technology / Defense | 3 | $32B |
|
||
| Financial Services | 2 | $176B |
|
||
| Utilities | 2 | $27B |
|
||
| Insurance | 2 | $25B |
|
||
| Technology | 2 | $15B |
|
||
Price history
-20.8% since first listed2 events — show timeline
- 2026-05-13 Price Changed $38,000 FSBO.com
- 2026-05-12 Listed $48,000 FSBO.com
Cash-flow waterfall
monthlySold comps — $/sqft
last 12 mo · ≤1 miLoading sold comps…