 Duplex
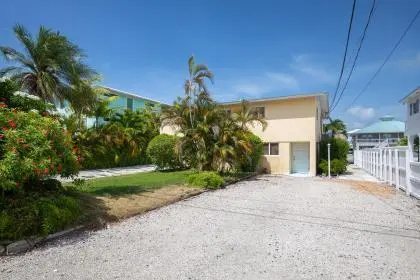
596 W Shore Dr · Cudjoe Key, FL
Flood risk 9/10 · Severe
- FEMA flood zone
- AE
- Chance of flooding over 30 yrs
- 0.99%
- Est. flood insurance / yr
- $1,737 – $8,500
Fire risk 2/10 · Minimal
- Est. fire insurance / yr
- $947 – $1,759
Heat risk No data
- Hot days now (above threshold)
- —
- Hot days in 30 yrs
- —
Wind risk 10/10 · Severe
- Chance of severe wind over 30 yrs
- 99.0%
Air-quality risk 1/10 · Minimal
- Unhealthy air days now
- 0 days/yr
- Unhealthy air days in 30 yrs
- 0 days/yr
Risk factors via First Street. Map © Google.
Why this score? — see what drove the D+ grade
The composite is a weighted blend of 9 inputs, each scored 0–100. Each bar is that input's sub-score; the figure is the points it added to the 100-point composite (weight × sub-score).
- Cash flow +11.0/30.0
- Appreciation +10.0/10.0
- ARV discount +7.5/15.0
- Schools +4.6/10.0
- DSCR +3.2/10.0
- Livability +3.0/5.0
- 1% rule +2.5/10.0
- Rent growth +2.5/5.0
- Condition / age +2.5/5.0
$998,000
🖨 Deal sheet (PDF) 📄 Offer letter ✓ Due diligence
Multi-family units
County records classify this as Multi-Family (2-4 Unit). Listing-text estimate: 2 units. confirmed
Listing remarks
Waterfront duplex located on a wide, deep boating canal with excellent boating access and 60 ft. of dockage, split between both units, offering approximately 30 ft. per side. Situated at 594-596 W. Shore Drive, this two-story multifamily property features approximately 1,392 sq. ft. downstairs and approximately 1,180 sq. ft. upstairs, plus separate tiki huts for each unit to enjoy outdoor entertaining and relaxed Florida Keys living. The upstairs unit offers 2 bedrooms and 1 bathroom, while the downstairs unit features 3 bedrooms and 2 bathrooms. Conveniently located near Summerland Airport, this property is ideal for waterfront investors, employee housing, multi-generational living, or tho
Key facts
- Boating canal
- Waterfront duplex
- Separate tiki huts
Tags
Property features AI
Finance
- Other: Lot size less than 1/4 acre (approximately 0.13 acres); Zoning: Improved Subdivision District (IS); Flood zone AE; Dock with 60' dock length; Pets allowed; Rentals allowed with restrictions; No deed restrictions
- Financial info: Financing terms available: Assumable, FHA, VA, Conventional, Cash
- HOA & community: No association fee; No first right of refusal; Fee includes: None
Exterior
- Parking: Off-street parking
- Utilities: FKAA water; Municipal sewer (public sewer hook-up) - buyer to verify
- Home design: 2-story property; Located on the ocean side
- Construction: Built in 1963; CBS construction; Metal roof
- Exterior features: Screened patio; Canal front waterfront; Canal view; On waterfront
Interior
- Kitchen: Refrigerator; Range
- Flooring: Tile
- Bathrooms: 3 full bathrooms
- Heating & cooling: Central A/C; Ceiling fans
- Interior features: Tile flooring; Central A/C; Ceiling fans
Neighborhood map
What this means for you Summary
Snapshot
- This is a 2 × 2-bed/1.5-bath units multifamily listed at $998k.
Deal economics
- At list price, monthly cash flow is $-848 ($-10k/yr) — negative. Per door: $-424/mo.
- To cash-flow at today's rent, offer at most $848k (15.0% below list).
- To meet the 1% rule (rent ≥ 1% of price), the offer needs to be $748k (25.0% below list).
- Recommended offer: $748k (25.0% below list) — sets the bar for 1% rule.
- Cap rate 5.8% vs local median 1.5% in Cudjoe Key — top-decile yield for the area; either an underpriced asset or a hidden risk that comps aren't pricing in. Stress-test before assuming the spread holds.
Location & tenants
- Location reads 59/100 on livability (#811 in FL) — a working-class tenant base; expect higher turnover. Strengths: crime A+, employment A+, housing B; Watch: schools D, health & safety D, amenities F.
- Monroe (town): math 50% / reading 55% proficiency, ranked #23 of 73 in FL (top 32%) — acceptable for families but not a draw, mixed tenant base, ~2y average lease.
- Market conditions: 244 active listings in the ZIP; solid renter incomes; 332 units permitted in Monroe County in 2024 (42 in 5+ unit buildings).
- At $7,483/mo this rent would consume 87% of the median local household income ($103k/yr) (locally 146% of renters already pay >50% of income on rent) — very limited rent-growth headroom before tenants either downsize or default.
Forward outlook
- In year one you build about $107k of equity ($7k loan paydown + $100k appreciation (10.0% local appreciation)).
- Monroe County population projected at +28% by 2050 — long-run rental-demand tailwind backs the buy-and-hold thesis.
- By year 2, paydown + projected appreciation supports a ~$172k cash-out refi (75% LTV) — recoverable capital for the next deal without selling this one.
Negotiation context
- It's been on market 23 days — a 2% lower offer ($983k) is reasonable based on typical stale-listing flexibility.
- Current owner paid $209k; list at $998k implies a 378% gain — meaningful room to come down on a strong offer.
Risks & watch-outs
- Watch-outs: flood insurance adds $427/mo.
- Climate carrying-cost: in FEMA flood zone AE (mandatory federal flood insurance); severe wind risk, 99% chance of damaging wind over 30y — expect insurance premiums to compound above CPI over the hold.
Questions for the listing agent
- What do current leases actually rent for vs. the listed asking? Can we see a recent rent roll and the last 12 months of T-12 income?
- Can we see the unit-by-unit rent roll, current vacancy, and any below-market leases? What's the average tenancy length?
- What capital expenditures (roof, boiler, parking lot, exteriors) have been made in the last 5 years, and what's planned in the next 2?
- Built in 1963 — when were the roof, HVAC, electrical panel, plumbing, and water heater last replaced?
- What's the actual annual flood-insurance premium (NFIP or private), and is the property in a SFHA with mandatory coverage?
- Is there a deadline driving the sale (1031 exchange, divorce, estate, relocation)? That informs how much negotiation room exists.
- Schools are D-rated, which usually means shorter tenancies and higher turnover. Who's the typical renter profile here, and what's been the actual vacancy rate?
- The area grade is low — what's the realistic commute time and amenity access for the typical tenant pool here? Any planned neighborhood developments (good or bad) we should know about?
- What's the average days-on-market for RENTAL listings here right now (not sales)? A rising rental-DOM trend means longer vacancies and softer asking-rent achievability than the comps imply.
- What's the recent tenant-quality profile in this submarket — average credit score on applications, eviction rate, late-payment / NSF rate, and stable-employment percentage? A property-management company in the area should have these aggregated.
- How much new apartment / multifamily construction is in the pipeline within 1–3 miles? Heavy new supply (>2% of stock underway) typically softens rents 12–24 months out; light construction supports rent growth.
Investment metrics
- 1% rule
- 0.75% ✗
- Cap rate
- 5.79%
- Cash-on-cash
- -1.81%
- DSCR
- 0.92
- GRM
- 11.1
CMA / ARV
No comps found within radius.
Projected returns pro-forma
10.0% appreciation · 3.0% rent growth · sell at horizon
- IRR
- 21.7%
- Equity multiple
- 2.75×
- Total profit
- $489,567
- Equity at exit
- $899,077
- IRR
- 19.5%
- Equity multiple
- 6.31×
- Total profit
- $1,484,214
- Equity at exit
- $1,938,894
Cash invested: $279,440 (down + closing). Projections, not guarantees.
Landlord ↔ Tenant lean methodology
- Overall (STATE)
- 87 Strongly Landlord-Friendly
- State Florida
- 87 Strongly Landlord-Friendly · R+3
- County
- — inherits STATE
- City
- — inherits STATE
ZIP-level market 33042
- Home prices YoY
- 2.5%
- Active inventory
- 244
- Price-to-rent
- 22.2×
Monthly cashflow live
- Estimated rent
- $7,483 medium interval (Pro) →
- Mortgage (P&I)
- −$5,234
- Tax from tax record
- −$683 /mo · $8,201/yr
- Insurance
- −$416
- Flood insurance flood zone
- −$427 /mo · $5,118/yr
- HOA
- −$0
- Vacancy / Maint / Mgmt
- −$1,571
- Net cashflow
- $-848
Break-even live
Sensitivity live
| Price | -10% $-283 | -5% $-565 | +0% $-848 | +5% $-1,130 | +10% $-1,413 |
|---|---|---|---|---|---|
| Rent | -10% $-1,439 | -5% $-1,143 | +0% $-848 | +5% $-552 | +10% $-257 |
| Rate | -1.0pp $-345 | -0.5pp $-594 | base $-848 | +0.5pp $-1,106 | +1.0pp $-1,370 |
2-unit breakdown (identical units grouped — click to expand)
| Units | Beds | Baths | Est. rent |
|---|---|---|---|
| 2× units | 2 | 1.5 | $7,484 |
| #1 | 2 | 1.5 | $3,742 |
| #2 | 2 | 1.5 | $3,742 |
| Total (2 units) | $7,483 | ||
UW: 25.0% down · 7.5% · 30yr · 1.5% tax · 5.0% vac · 8.0% maint · 8.0% mgmt
Financing live
Cash to close
- Down payment
- $249,500
- Closing costs
- $29,940
- Reserves months
- —
- Total cash needed
- —
Loan-product check · same deal, 3 products live
Conventional
25% down · 7.5% · 30yr
- Down + closing
- —
- Monthly P&I
- —
- Monthly cashflow
- —
- DSCR
- —
- Eligible?
- —
Personal DTI + credit; lowest rate.
DSCR
20% down · 8.5% · 30yr
- Down + closing
- —
- Monthly P&I
- —
- Monthly cashflow
- —
- DSCR
- —
- Eligible?
- —
No personal income docs; deal must DSCR.
Hard money
10% down · 12.0% · 12mo
- Down + closing
- —
- Monthly P&I
- —
- Monthly cashflow
- —
- DSCR
- —
- Eligible?
- —
Short-term bridge; refi at stabilization.
Listing history 18 events
-
2026-06-22statusdays on market $998,000 Contingent (Show) 23 DOM
-
2026-06-19days on market $998,000 Active 20 DOM
-
2026-06-18days on market $998,000 Active 19 DOM
-
2026-06-17days on market $998,000 Active 18 DOM
-
2026-06-16days on market $998,000 Active 17 DOM
-
2026-06-15days on market $998,000 Active 16 DOM
-
2026-06-14days on market $998,000 Active 14 DOM
-
2026-06-13days on market $998,000 Active 13 DOM
-
2026-06-10days on market $998,000 Active 11 DOM
-
2026-06-09days on market $998,000 Active 10 DOM
-
2026-06-08days on market $998,000 Active 9 DOM
-
2026-06-07days on market $998,000 Active 8 DOM
-
2026-06-05days on market $998,000 Active 5 DOM
-
2026-06-03days on market $998,000 Active 4 DOM
-
2026-06-02days on market $998,000 Active 3 DOM
-
2026-06-01days on market $998,000 Active 2 DOM
-
2026-05-30remarks 699-char remark
-
2026-05-30$998,000 Active 1 DOM
ⓘ Source: listings_history table (triggers on properties + properties_extension) + one-shot
backfill from property_details.listing_events for pre-trigger history.
Tax reassessment forecast FL · Resets to sale price
- Current annual tax
- $8,201 · $683/mo
- Projected year-2 tax
- $8,283 · $690/mo
- Expected delta
- +$82/yr (+$7/mo · 1.0%)
ⓘ Screening estimate from a state-policy table — verify with the county assessor before closing.
Climate risk First Street
- Flood 9/10 Extreme FEMA zone AE · 99% chance over 30 yrs
- Wildfire 2/10 Low
- Wind 10/10 Extreme 99% chance of damaging wind over 30 yrs
- Air quality 1/10 Low 0 unhealthy d/yr today · 0 by 30 yrs out
Nearby sold comps map
Loading sold comps map…
Walkable amenities ~0.75 mi
Loading nearby amenities…
Taxation est. · year 1
- Rental income
- $89,796
- − Mortgage interest
- −$55,904
- − Property taxes
- −$8,201
- − Insurance
- −$10,108
- − Repairs & maintenance
- −$7,184
- − Management
- −$7,184
- − Depreciation
- −$29,033
- Taxable loss
- −$27,817
- Est. tax savings @ 24.0%
- +$6,676
- After-tax cash flow
- $-3,498/yr
For passive investors: Depreciation is non-cash, so a rental often shows a tax loss while cash-flowing — sheltering income. Rental losses are passive: they offset passive income freely, and up to $25,000/yr can offset ordinary (W-2) income if you actively participate and your MAGI is under $100k (phasing out to $0 by $150k); unused losses carry forward. On sale, claimed depreciation is recaptured at up to 25%, and gains may owe capital-gains tax (a 1031 exchange can defer both). Figures are a year-1 estimate at your 24.0% rate — not tax advice; consult a CPA.
Schools (NCES district)
- District
- Monroe
- NCES district ID
- 1201320
- Math proficiency
- 50% ▼ -14.00%
- Reading proficiency
- 55% ▼ -6.00%
- Median HH income
- $56,955
- Composite
- 45.51/100
- National rank
- #2608
- State rank
- #23 of 73 in FL
Livability — Cudjoe Key
- Score
- 59/100
- State rank
- #811
- US rank
- #19681
Category grades
Schools grade is shown separately in the Schools card above.
Census & demographics
- County
- Monroe County · 66,185 people
- City population
- 6,781
- Metro
- Key West, FL
- Population (ZIP)
- 6,441
- Household income
- $103,041
- Rent vs Own
- Severe rent burden
- 146.0
Population outlook (Monroe County) Hauer SSP2
- Today (2025)
- 90,706 people
- By 2030
- 96,308 · +6.2%
- By 2040
- 106,565 · +17.5%
- By 2050
- 116,500 · +28.4%
- By 2075
- 141,423 · +55.9%
- By 2100
- 151,947 · +67.5%
Race, ethnicity, and origin ACS 2023
- Neighborhood character
- Predominantly White (81%)
- Race & ethnicity
- White 81% Two or more races 12% Hispanic / Latino 12% Black 3%
- Hispanic origin (detail)
- Mexican 3% Puerto Rican 2% Cuban 5%
- Common ancestry
- Romanian 3% Slovak 3% Iranian 3%
- Foreign-born
- 8% · Canada, Jamaica
- Languages at home
- 91% English-only · Spanish 5% Russian/Polish/Slavic 1% German/W. Germanic 1%
Political lean MEDSL · Monroe
- 2024 margin
- R (+18.3) · D 40.5% · R 58.8%
- 2008→2024 swing
- -23.2pp toward R · 2008: 4.9pp · 2024: -18.3pp
- All cycles
- 2024: R+18.3 2020: R+7.9 2016: R+6.9 2012: D+0.4 2008: D+4.9
Not yet ingested
- Civics
- —
Market trends
- HPI YoY
- ▲ 12.11%
- Current HPI
- 491.52
- Rent YoY
- —
- Metro
- Key West, FL
- State GDP YoY
- ▲ 3.28%
- F500 in state
- 36
Industry mix (Fortune 500 HQ in FL)
| Industry | F500 HQs | Revenue |
|---|---|---|
| Industrial Technology | 2 | $29B |
|
||
| Insurance | 2 | $17B |
|
||
| Retail | 1 | $60B |
|
||
| Technology Distribution | 1 | $58B |
|
||
| Homebuilding | 1 | $35B |
|
||
| Technology Manufacturing | 1 | $35B |
|
||
Price history
+612.9% since first listed3 events — show timeline
- 2026-05-29 Listed $998,000 FLKMLS
- 1996-12-03 Sold (Public Records) $208,700 Public Records
- 1987-06-30 Sold (Public Records) $140,000 Public Records
Property tax history
+3.5%/yrLatest (2025): $8,201 · +7.9% YoY. Source: county tax records.
Cash-flow waterfall
monthlySold comps — $/sqft
last 12 mo · ≤1 miLoading sold comps…