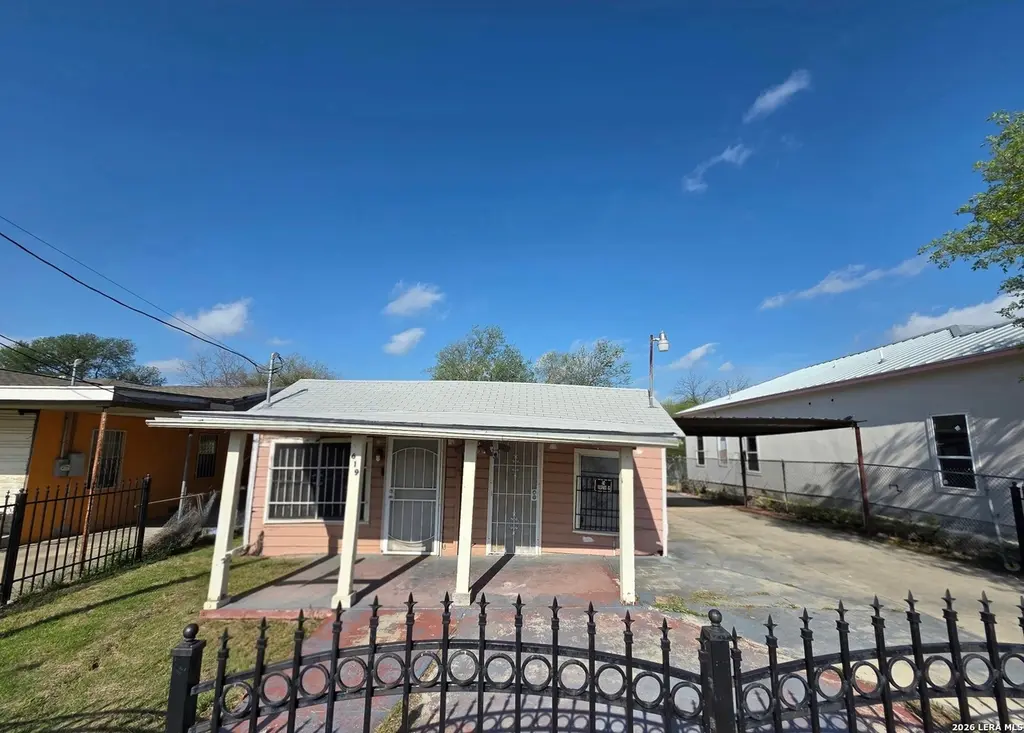
619 San Bernardo · San Antonio, TX
Flood risk 1/10 · Minimal
- FEMA flood zone
- X (unshaded)
- Chance of flooding over 30 yrs
- 0.0%
- Est. flood insurance / yr
- $507 – $1,088
Fire risk 1/10 · Minimal
- Est. fire insurance / yr
- $1,222 – $2,270
Heat risk 8/10 · Major
- Hot days now (above 108°F)
- 7 days/yr
- Hot days in 30 yrs
- 22 days/yr
Wind risk 6/10 · Moderate
- Chance of severe wind over 30 yrs
- 77.0%
Air-quality risk 2/10 · Minimal
- Unhealthy air days now
- 1 days/yr
- Unhealthy air days in 30 yrs
- 1 days/yr
Risk factors via First Street. Map © Google.
Why this score? — see what drove the B- grade
The composite is a weighted blend of 9 inputs, each scored 0–100. Each bar is that input's sub-score; the figure is the points it added to the 100-point composite (weight × sub-score).
- Cash flow +30.0/30.0
- 1% rule +10.0/10.0
- DSCR +10.0/10.0
- ARV discount +7.5/15.0
- Livability +4.0/5.0
- Rent growth +3.7/5.0
- Condition / age +2.5/5.0
- Schools +1.3/10.0
- Appreciation +0.0/10.0
$79,000
🖨 Deal sheet 📄 Offer letter ✓ Due diligence
Listing remarks
Investor Special need a little TLC. Cash Only. Discover this charming one-story 2 bed 1 bath home with a mother-in-law suite in the back. 2bd 1 bath full kitchen in front house, 2 bd 1 bath efficiency kitchen in Guest house (potential rental). won't last long set up your showing today. There is furniture in the home now, Pictures are before seller moved in.
Key facts
- 5,706 sq ft lot
- Built 1946
- Listed 71 days
Property features AI
Finance
- Financial info: Down payment assistance resources available
- HOA & community: Subdivision: LOMA VISTA (LOMA AREA 2 ED)
Exterior
- Parking: Converted garage (provides additional living/usable space)
- Utilities: City water; SAWS water and sewer service; CPS gas and electric service; City garbage service
- Home design: Pre-owned single-family dwelling; Converted garage entry; Approximate age: 80 years
- Construction: Wood exterior; Slab foundation; Composition roof
- Exterior features: Street paved
Interior
- Kitchen: Eat-in kitchen — 11 x 11
- Bedrooms: Master bedroom on lower level — 11 x 11; Bedroom 1 (main level) — 11 x 13; Bedroom 2 (main level) — 11 x 11; Bedroom 3 (main level) — 10 x 11; Bedroom 4 (main level) — 10 x 11
- Flooring: Linoleum flooring
- Bathrooms: 2 full bathrooms; Master bath with tub/shower combination — 5 x 10
- Heating & cooling: Electric heat; Natural gas heat; Two window A/C units
- Interior features: Eat-in kitchen; Converted garage; Ground level / no steps; 1 living area; Secondary bedroom on lower level
- Laundry & utility: Washer connection; Dryer connection
Neighborhood map
What this means for you Summary
Snapshot
- This is a 3-bed/1.0-bath single-family listed at $79k.
Deal economics
- At list price, monthly cash flow is $432 ($5k/yr) — positive.
- The deal already cash-flows at list — no discount required.
- Meets the 1% rule at list price ($1k rent vs $79k).
- Recommended offer: $74k (6.0% below list) — sets the bar for market timing.
- Cap rate 12.9% vs local median 3.8% in San Antonio — top-decile yield for the area; either an underpriced asset or a hidden risk that comps aren't pricing in. Stress-test before assuming the spread holds.
Location & tenants
- Location reads 80/100 on livability (#31 in TX, #1,616 nationally) — a professional / high-income tenant draw. Strengths: amenities A+, commute A+, cost of living A+; Watch: crime F.
- Edgewood ISD (urban): math 12% / reading 21% proficiency, ranked #812 of 826 in TX (top 98%) — low school quality limits family demand, transient renter base, plan for 1-2y turnover.
- Zoned schools: Roosevelt El (math 8% / reading 17%, grade F, #4,180 of 4,322 statewide, top 97%, 305 students, 95% FRL); Memorial H S (math 22% / reading 29%, grade F, #1,246 of 1,632 statewide, top 77%, 872 students, 92% FRL) — zoned schools average 93% FRL vs 24% district-wide (69 pts higher); higher-poverty schools than district average — tighter screening recommended.
- Market conditions: Rents rising fast (+4.9%/yr); 91 active listings in the ZIP; 20 comparable units currently listed for rent nearby; rentals at typical pace (median 22d on market — plan ~3-4 weeks tenant-placement turnaround); 8,308 units permitted in Bexar County in 2024 (2,506 in 5+ unit buildings).
- This rent runs 30% of the median local income ($53k/yr) — at the standard rent-burdened threshold; future hikes will face affordability resistance.
Forward outlook
- Local home prices are declining (-3.0%/yr); year-one equity from $546 of loan paydown is wiped out by about $2k of value loss. Plan a longer hold.
- Bexar County population projected at +50% by 2050 — long-run rental-demand tailwind backs the buy-and-hold thesis.
- At projected returns (-3.0% appreciation + 4.9% rent growth), your $22k cash investment doubles in ~5 years — after that, you're playing with house money.
Negotiation context
- It's been on market 71 days — a 6% lower offer ($74k) is reasonable based on typical stale-listing flexibility.
Risks & watch-outs
- Watch-outs: property tax is 2.8% of price; built in 1946 — expect roof / HVAC / electrical / plumbing capex.
- Climate carrying-cost: major wind risk, 77% chance of damaging wind over 30y; extreme-heat days projected 7→22/yr by 2055 (HVAC capex compounding) — expect insurance premiums to compound above CPI over the hold.
Questions for the listing agent
- It's been on market 71 days. Have you received any prior offers? Is the seller open to a 6% concession, seller financing, or rate buy-down credit?
- Built in 1946 — when were the roof, HVAC, electrical panel, plumbing, and water heater last replaced?
- Property tax is high relative to price — has the assessment been appealed recently, and will the sale trigger a re-assessment?
- Why hasn't it sold? Are there any deal-killer items the seller is aware of (foundation, flood, title, zoning, code violations)?
- Is there a deadline driving the sale (1031 exchange, divorce, estate, relocation)? That informs how much negotiation room exists.
- Crime grade is F in this area — have there been break-ins, vandalism, or insurance claims at this property in the last 3 years? What carrier currently insures it and at what premium?
- What's the average days-on-market for RENTAL listings here right now (not sales)? A rising rental-DOM trend means longer vacancies and softer asking-rent achievability than the comps imply.
- What's the recent tenant-quality profile in this submarket — average credit score on applications, eviction rate, late-payment / NSF rate, and stable-employment percentage? A property-management company in the area should have these aggregated.
- How much new for-sale + rental construction is in the pipeline within 1–3 miles? Heavy new supply typically softens prices + rents 12–24 months out; constrained supply supports both.
Investment metrics
- 1% rule
- 1.70% ✓
- Cap rate
- 12.85%
- Cash-on-cash
- 23.43%
- DSCR
- 2.04
- GRM
- 4.9
CMA / ARV
- ARV (on-the-fly)
- $164,736
- Comps found
- 4
Show comp detail 4 sales within ~0.75 mi
| Address | Dist | Beds/Ba | Sqft | Sold | Price | $/sf | Match |
|---|---|---|---|---|---|---|---|
| 115 Rollins | 0.58mi | 3/1.0 | 854 (-9%) | 3mo | $150,000 | $176 | 56 |
| 2359 Waverly | 0.31mi | 2/1.0 (-1) | 800 (-14%) | 6mo | $89,900 | $112 | 51 |
| 3230 & 3232 W French Pl | 0.61mi | 2/1.0 (-1) | 891 (-5%) | 18mo | $165,000 | $185 | 43 |
| 1938 Texas | 0.68mi | 2/1.0 (-1) | 1,058 (+13%) | 9mo | $105,000 | $99 | 35 |
Match score weights: distance 35% · size 25% · config 20% · recency 20%. Top-matched comps best support the ARV.
Projected returns pro-forma
-3.0% appreciation · 4.92% rent growth · sell at horizon
- IRR
- 18.9%
- Equity multiple
- 1.79×
- Total profit
- $17,416
- Equity at exit
- $11,779
- IRR
- 28.7%
- Equity multiple
- 3.81×
- Total profit
- $62,146
- Equity at exit
- $6,830
Cash invested: $22,120 (down + closing). Projections, not guarantees.
Landlord ↔ Tenant lean methodology
- Overall (STATE)
- 87 Strongly Landlord-Friendly
- State Texas
- 87 Strongly Landlord-Friendly · R+5
- County
- — inherits STATE
- City
- — inherits STATE
ZIP-level market 78228
- Home prices YoY
- -22.1%
- Rents YoY
- 4.9%
- Active inventory
- 91
- Price-to-rent
- 4.9×
Monthly cashflow live
- Estimated rent
- $1,342 high interval (Pro) →
- Mortgage (P&I)
- −$414
- Tax from tax record
- −$181 /mo · $2,175/yr
- Insurance
- −$33
- HOA
- −$0
- Vacancy / Maint / Mgmt
- −$282
- Net cashflow
- $432
Break-even live
UW: 25.0% down · 7.5% · 30yr · 1.5% tax · 5.0% vac · 8.0% maint · 8.0% mgmt
Financing live
Cash to close
- Down payment
- $19,750
- Closing costs
- $2,370
- Reserves months
- —
- Total cash needed
- —
Loan-product check · same deal, 3 products live
Conventional
25% down · 7.5% · 30yr
- Down + closing
- —
- Monthly P&I
- —
- Monthly cashflow
- —
- DSCR
- —
- Eligible?
- —
Personal DTI + credit; lowest rate.
DSCR
20% down · 8.5% · 30yr
- Down + closing
- —
- Monthly P&I
- —
- Monthly cashflow
- —
- DSCR
- —
- Eligible?
- —
No personal income docs; deal must DSCR.
Hard money
10% down · 12.0% · 12mo
- Down + closing
- —
- Monthly P&I
- —
- Monthly cashflow
- —
- DSCR
- —
- Eligible?
- —
Short-term bridge; refi at stabilization.
Rent comps 20 comps
| Address | Beds | Baths | Sqft | Rent | $/sqft | DOM | Units | Dist |
|---|---|---|---|---|---|---|---|---|
| 2426 Cincinnati Ave San Antonio, TX | 2.0 | 1.0 | 700 | $975 | $1.39 | 24d | 1 | 0.42mi |
| 2331 Cincinnati Ave Unit 2345 03 San Antonio, TX | 3.0 | 1.0 | 950 | $1,300 | $1.37 | 3d | 1 | 0.50mi |
| 2331 Cincinnati Ave San Antonio, TX | 1.0–3.0 | 1.0 | 850 | $1,300 | $1.53 | 12d | 3 | 0.51mi |
| 3156 W French Pl San Antonio, TX | 2.0 | 2.0 | 1100 | $1,150 | $1.05 | 43d | 1 | 0.64mi |
| 224 Marquette Dr San Antonio, TX | 2.0 | 1.0 | 984 | $1,350 | $1.37 | 24d | 1 | 0.65mi |
| 2825 W Woodlawn Ave Unit 2825-WW San Antonio, TX | 2.0 | 1.0 | 700 | $1,195 | $1.71 | 3d | 1 | 0.78mi |
| 306 Overhill Dr San Antonio, TX | 2.0 | 1.0 | 1009 | $1,200 | $1.19 | 4d | 1 | 0.80mi |
| 122 Collins Ct San Antonio, TX | 2.0 | 1.0 | 927 | $1,150 | $1.24 | 22d | 1 | 0.81mi |
| 2503 Arbor Pl San Antonio, TX | 2.0 | 1.0 | 750 | $800 | $1.07 | 43d | 1 | 0.81mi |
| 3301 W Woodlawn Ave San Antonio, TX | 1.0–2.0 | 1.0 | 825 | $881 | $1.07 | 24d | 3 | 0.88mi |
| 2718 W Craig Pl San Antonio, TX | 2.0 | 1.0 | 1004 | $1,350 | $1.34 | 12d | 1 | 0.90mi |
| 2718 W Craig Pl San Antonio, TX | 2.0 | 1.0 | 1004 | $1,350 | $1.34 | 11d | 1 | 0.90mi |
| 127 Riverdale Dr San Antonio, TX | 3.0 | 1.0 | 1032 | $1,100 | $1.07 | 12d | 1 | 1.14mi |
| 1171 Bandera Rd San Antonio, TX | 1.0–2.0 | 1.0 | 750 | $1,375 | $1.83 | 24d | 5 | 1.16mi |
| 1405 Donaldson Ave Unit 202 San Antonio, TX | 2.0 | 1.0 | 560 | $995 | $1.78 | 43d | 1 | 1.33mi |
| 330 W Cheryl Dr San Antonio, TX | 1.0–3.0 | 1.0–2.0 | 975 | $1,300 | $1.33 | 43d | 1 | 1.33mi |
| 206 Bexar Dr San Antonio, TX | 2.0 | 1.0 | 832 | $895 | $1.08 | 24d | 1 | 1.35mi |
| 208 Bexar Dr San Antonio, TX | 2.0 | 1.0 | 832 | $895 | $1.08 | 4d | 1 | 1.35mi |
| 606 Bexar Dr San Antonio, TX | 3.0 | 2.0 | 909 | $1,210 | $1.33 | 4d | 1 | 1.40mi |
| 314 Globe Ave San Antonio, TX | 3.0 | 2.0 | 936 | $1,600 | $1.71 | 2d | 1 | 1.48mi |
Listing history 11 events
-
2026-06-12statusdays on market $79,000 Pending 71 DOM
-
2026-06-09days on market $79,000 Price Change 69 DOM
-
2026-06-08days on market $79,000 Price Change 68 DOM
-
2026-06-08days on market $79,000 Price Change 67 DOM
-
2026-06-07days on market $79,000 Price Change 66 DOM
-
2026-06-03days on market $79,000 Price Change 63 DOM
-
2026-06-02days on market $79,000 Price Change 62 DOM
-
2026-06-02pricestatus $79,000 Price Change 61 DOM
-
2026-06-01days on market $82,000 Active 61 DOM
-
2026-05-31remarks 359-char remark
-
2026-05-31$82,000 Active 60 DOM
ⓘ Source: listings_history table (triggers on properties + properties_extension) + one-shot
backfill from property_details.listing_events for pre-trigger history.
Tax reassessment forecast TX · Resets to sale price
- Current annual tax
- $2,175 · $181/mo
- Projected year-2 tax
- $2,175 · $181/mo
- Expected delta
- $0/yr ($0/mo · 0.0%)
ⓘ Screening estimate from a state-policy table — verify with the county assessor before closing.
Climate risk First Street
- Flood 1/10 Low FEMA zone X (unshaded) · 0% chance over 30 yrs
- Wildfire 1/10 Low
- Heat 8/10 Severe 7 d/yr ≥108°F today · 22 d/yr by 30 yrs out
- Wind 6/10 Major 77% chance of damaging wind over 30 yrs
- Air quality 2/10 Low 1 unhealthy d/yr today · 1 by 30 yrs out
Nearby sold comps map
Loading sold comps map…
Walkable amenities ~0.75 mi
Loading nearby amenities…
Taxation est. · year 1
- Rental income
- $16,105
- − Mortgage interest
- −$4,425
- − Property taxes
- −$2,175
- − Insurance
- −$395
- − Repairs & maintenance
- −$1,288
- − Management
- −$1,288
- − Depreciation
- −$2,298
- Taxable income
- $4,235
- Est. tax owed @ 24.0%
- −$1,016
- After-tax cash flow
- $4,166/yr
For passive investors: Depreciation is non-cash, so a rental often shows a tax loss while cash-flowing — sheltering income. Rental losses are passive: they offset passive income freely, and up to $25,000/yr can offset ordinary (W-2) income if you actively participate and your MAGI is under $100k (phasing out to $0 by $150k); unused losses carry forward. On sale, claimed depreciation is recaptured at up to 25%, and gains may owe capital-gains tax (a 1031 exchange can defer both). Figures are a year-1 estimate at your 24.0% rate — not tax advice; consult a CPA.
Schools (NCES district)
- District
- Edgewood ISD
- NCES district ID
- 4818150
- Math proficiency
- 12% ▼ -18.00%
- Reading proficiency
- 21% ▼ -5.00%
- Median HH income
- $27,419
- Composite
- 12.82/100
- National rank
- #9597
- State rank
- #812 of 826 in TX
Livability — San Antonio
- Score
- 80/100
- State rank
- #31
- US rank
- #1616
Category grades
Schools grade is shown separately in the Schools card above.
Census & demographics
- Census place
- San Antonio, TX
- County
- Bexar County · 1,990,555 people
- City population
- 1,806,925
- Metro
- San Antonio-New Braunfels, TX
- Population (ZIP)
- 56,165
- Household income
- $52,976
- Rent vs Own
- Severe rent burden
- 2709.0
Population outlook (Bexar County) Hauer SSP2
- Today (2025)
- 2,336,851 people
- By 2030
- 2,560,728 · +9.6%
- By 2040
- 3,020,569 · +29.3%
- By 2050
- 3,493,522 · +49.5%
- By 2075
- 4,668,459 · +99.8%
- By 2100
- 5,533,242 · +136.8%
Race, ethnicity, and origin ACS 2023
- Neighborhood character
- Predominantly Hispanic (88%)
- Race & ethnicity
- Hispanic / Latino 88% Two or more races 43% White 8% Black 2%
- Hispanic origin (detail)
- Mexican 80%
- Common ancestry
- Italian 1% Lithuanian 1%
- Foreign-born
- 15% · Canada
- Languages at home
- 46% English-only · Spanish 53% Other Indo-European 1%
Political lean MEDSL · Bexar
- 2024 margin
- Lean D (+9.8) · D 54.3% · R 44.6% · Other 1.1%
- 2008→2024 swing
- +4.2pp toward D · 2008: 5.6pp · 2024: 9.8pp
- All cycles
- 2024: D+9.8 2020: D+18.2 2016: D+13.5 2012: D+4.6 2008: D+5.6
Not yet ingested
- Civics
- —
Market trends
- HPI YoY
- ▼ -74.04%
- Current HPI
- 261.1558
- Rent YoY
- ▲ 4.92%
- Metro
- San Antonio-New Braunfels, TX
- State GDP YoY
- ▲ 3.95%
- F500 in state
- 110
Industry mix (Fortune 500 HQ in TX)
| Industry | F500 HQs | Revenue |
|---|---|---|
| Energy | 16 | $1,198B |
|
||
| Technology | 5 | $198B |
|
||
| Engineering / Construction | 4 | $72B |
|
||
| Energy Services | 3 | $60B |
|
||
| Utilities | 3 | $41B |
|
||
| Healthcare | 2 | $330B |
|
||
Price history
-25.5% since first listed6 events — show timeline
- 2026-05-15 Price Changed $82,000 LERA
- 2026-05-15 Price Changed $75,000 LERA
- 2026-04-20 Price Changed $90,000 LERA
- 2026-04-13 Price Changed $99,900 LERA
- 2026-04-01 Listed $110,000 LERA
- 2015-05-06 Sold (Public Records) — Public Records
Property tax history
+6.4%/yrLatest (2025): $2,175 · +10.0% YoY. Source: county tax records.
Cash-flow waterfall
monthlySold comps — $/sqft
last 12 mo · ≤1 miLoading sold comps…