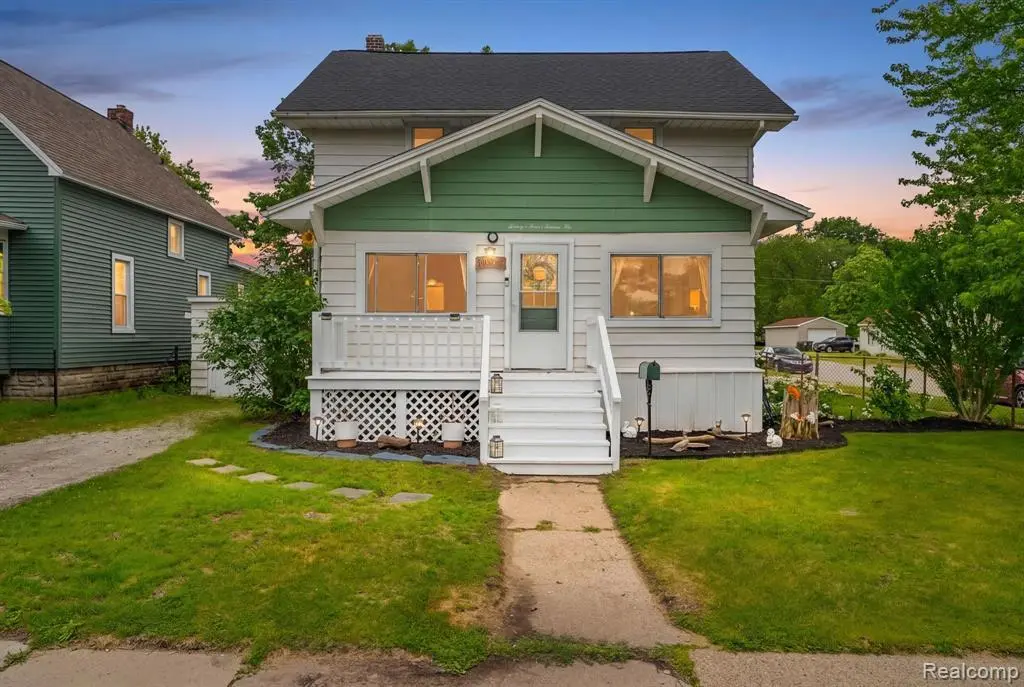
2926 South Blvd · Port Huron, MI
Flood risk 1/10 · Minimal
- FEMA flood zone
- X (unshaded)
- Chance of flooding over 30 yrs
- 0.0%
- Est. flood insurance / yr
- $473 – $860
Fire risk 3/10 · Minor
- Est. fire insurance / yr
- $784 – $1,456
Heat risk 2/10 · Minimal
- Hot days now (above 99°F)
- 7 days/yr
- Hot days in 30 yrs
- 14 days/yr
Wind risk 1/10 · Minimal
- Chance of severe wind over 30 yrs
- —
Air-quality risk 3/10 · Minor
- Unhealthy air days now
- 2 days/yr
- Unhealthy air days in 30 yrs
- 3 days/yr
Risk factors via First Street. Map © Google.
Why this score? — see what drove the D grade
The composite is a weighted blend of 9 inputs, each scored 0–100. Each bar is that input's sub-score; the figure is the points it added to the 100-point composite (weight × sub-score).
- Cash flow +15.2/30.0
- ARV discount +6.2/15.0
- DSCR +4.6/10.0
- 1% rule +4.5/10.0
- Rent growth +3.4/5.0
- Livability +3.2/5.0
- Schools +2.5/10.0
- Condition / age +2.5/5.0
- Appreciation +0.0/10.0
$179,900
🖨 Deal sheet (PDF) 📄 Offer letter ✓ Due diligence
Listing remarks MLS
Located on a desirable corner lot in a peaceful neighborhood, this well maintained 3 bedroom, 1.5 bath home offers comfort, convenience, and several valuable updates. Situated directly across the street from a park, you'll enjoy scenic views and easy access to outdoor recreation just steps from your front door. Inside, you'll find a functional layout with plenty of space to make your own, while the attached 1 car garage with electrical provides added versatility for storage, or hobbies. The fully fenced backyard is perfect for pets, play, gardening, or entertaining. Recent improvements include a new roof (2019), new furnace and central air conditioning (2021), and a new electrical panel (2021), giving buyers added peace of mind and reducing the need for major updates. Whether you're looking for your first home or your next chapter, this move in ready property combines a fantastic location with important modern upgrades. Schedule your showing today and see all it has to offer!
Key facts
- Scenic views
- Corner lot
- New roof
Tags
Property features AI
Exterior
- Parking: Attached garage (1 car)
- Utilities: Public water; Public sewer
- Home design: Single-family residence; Two levels; Lower-level entry with steps
- Construction: Aluminum siding; Block foundation; Asphalt roof; Built as a residential single-family home
- Exterior features: Paved road access
Interior
- Kitchen: Free-standing electric range; Free-standing refrigerator
- Bathrooms: 1 full bathroom; 1 half bathroom
- Heating & cooling: Forced air heating (natural gas); No cooling
- Interior features: Free-standing electric range; Free-standing refrigerator; Unfinished basement; 6 total rooms
Neighborhood map
What this means for you Summary
Snapshot
- This is a 3-bed/1.5-bath single-family listed at $180k.
Deal economics
- At list price, monthly cash flow is $61 ($732/yr) — positive.
- The deal already cash-flows at list — no discount required.
- To meet the 1% rule (rent ≥ 1% of price), the offer needs to be $171k (5.2% below list).
- Recommended offer: $171k (5.2% below list) — sets the bar for 1% rule.
- Cap rate 6.7% vs local median 4.3% in Port Huron — top-decile yield for the area; either an underpriced asset or a hidden risk that comps aren't pricing in. Stress-test before assuming the spread holds.
Location & tenants
- Location reads 65/100 on livability (#445 in MI) — a middle-class / working-renter tenant base. Strengths: cost of living A+, housing A+; Watch: amenities C-, health & safety D, crime F.
- Port Huron Area School District (suburban): math 23% / reading 37% proficiency, ranked #368 of 540 in MI (top 68%) — families likely to look elsewhere, expect single-tenant / working-renter base with shorter leases.
- Zoned schools: Literacy Academy At Cleveland Elementary (278 students, 93% FRL); Central Middle School (math 14% / reading 30%, grade F, #408 of 493 statewide, top 84%, 629 students, 72% FRL); Port Huron High School (math 27% / reading 57%, grade F, #264 of 713 statewide, top 41%, 1,100 students, 69% FRL) — zoned schools average 78% FRL vs 47% district-wide (30 pts higher); higher-poverty schools than district average — tighter screening recommended.
- Market conditions: Rents rising (+3.6%/yr); 224 active listings in the ZIP; 2 comparable units currently listed for rent nearby; 232 units permitted in St. Clair County in 2024 (0 in 5+ unit buildings).
- This rent runs 39% of the median local income ($53k/yr) — at the standard rent-burdened threshold; future hikes will face affordability resistance.
Forward outlook
- Local home prices are declining (-3.0%/yr); year-one equity from $1k of loan paydown is wiped out by about $5k of value loss. Plan a longer hold.
- St. Clair County population projected at -20% by 2050 — secular population decline; favor cash flow + early exit over multi-decade hold.
Negotiation context
- Only 2 days on market — expect competitive offers; lowballing is unlikely to land.
- 10 sale attempts since 6y ago with the ask held roughly flat each time — persistent listings suggest the price (not the market) is what's stuck; bring a comps-based counter.
- Current owner paid $155k; 16% above their basis — modest negotiation headroom, anchor on the comps not their cost.
Risks & watch-outs
- Watch-outs: built in 1913 — expect roof / HVAC / electrical / plumbing capex.
Questions for the listing agent
- Built in 1913 — when were the roof, HVAC, electrical panel, plumbing, and water heater last replaced?
- Is there a deadline driving the sale (1031 exchange, divorce, estate, relocation)? That informs how much negotiation room exists.
- Schools are F-rated, which usually means shorter tenancies and higher turnover. Who's the typical renter profile here, and what's been the actual vacancy rate?
- Crime grade is F in this area — have there been break-ins, vandalism, or insurance claims at this property in the last 3 years? What carrier currently insures it and at what premium?
- The area grade is low — what's the realistic commute time and amenity access for the typical tenant pool here? Any planned neighborhood developments (good or bad) we should know about?
- What's the average days-on-market for RENTAL listings here right now (not sales)? A rising rental-DOM trend means longer vacancies and softer asking-rent achievability than the comps imply.
- What's the recent tenant-quality profile in this submarket — average credit score on applications, eviction rate, late-payment / NSF rate, and stable-employment percentage? A property-management company in the area should have these aggregated.
- How much new for-sale + rental construction is in the pipeline within 1–3 miles? Heavy new supply typically softens prices + rents 12–24 months out; constrained supply supports both.
Investment metrics
- 1% rule
- 0.95% ✗
- Cap rate
- 6.70%
- Cash-on-cash
- 1.45%
- DSCR
- 1.06
- GRM
- 8.8
CMA / ARV
- ARV (on-the-fly)
- $174,720
- Comps found
- 12
Show comp detail 12 sales within ~0.75 mi
| Address | Dist | Beds/Ba | Sqft | Sold | Price | $/sf | Match |
|---|---|---|---|---|---|---|---|
| 2819 North Blvd | 0.10mi | 3/1.0 | 1,300 (-3%) | 7mo | $159,900 | $123 | 82 |
| 2824 Peavey St | 0.09mi | 2/1.0 (-1) | 1,248 (-7%) | 1mo | $175,000 | $140 | 76 |
| 3280 Ravenswood Rd | 0.32mi | 3/2.0 | 1,380 (+3%) | 14mo | $294,500 | $213 | 67 |
| 45 Gratiot Rd | 0.36mi | 2/1.5 (-1) | 1,324 (-2%) | 11mo | $392,000 | $296 | 66 |
| 2615 Peavey St | 0.21mi | 3/2.0 | 1,420 (+6%) | 16mo | $55,000 | $39 | 66 |
| 28 Gratiot Blvd | 0.33mi | 3/2.0 | 1,411 (+5%) | 11mo | $229,900 | $163 | 65 |
| 3333 Ravenswood Rd | 0.58mi | 3/1.5 | 1,400 (+4%) | 1mo | $38,000 | $27 | 65 |
| 3032 24th St | 0.61mi | 4/1.5 (+1) | 1,376 (+2%) | 8mo | $115,000 | $84 | 55 |
| 3257 Moak St | 0.34mi | 3/2.0 | 1,172 (-13%) | 8mo | $160,000 | $137 | 54 |
| 3017 Conner St | 0.14mi | 3/3.0 | 1,152 (-14%) | 13mo | $149,900 | $130 | 53 |
| 3022 24th St | 0.62mi | 4/1.0 (+1) | 1,532 (+14%) | 9mo | $75,000 | $49 | 33 |
| 3012 24th St | 0.64mi | 4/1.5 (+1) | 1,532 (+14%) | 12mo | $154,000 | $101 | 32 |
Match score weights: distance 35% · size 25% · config 20% · recency 20%. Top-matched comps best support the ARV.
Projected returns pro-forma
-3.0% appreciation · 3.61% rent growth · sell at horizon
- IRR
- -13.2%
- Equity multiple
- 0.52×
- Total profit
- $-24,159
- Equity at exit
- $26,824
- IRR
- -3.3%
- Equity multiple
- 0.77×
- Total profit
- $-11,445
- Equity at exit
- $15,554
Cash invested: $50,372 (down + closing). Projections, not guarantees.
Landlord ↔ Tenant lean methodology
- Overall (STATE)
- 62 Landlord-Friendly
- State Michigan
- 62 Landlord-Friendly · EVEN
- County
- — inherits STATE
- City
- — inherits STATE
ZIP-level market 48060
- Rents YoY
- 3.6%
- Active inventory
- 224
- Price-to-rent
- 8.8×
Monthly cashflow live
- Estimated rent
- $1,705 medium interval (Pro) →
- Mortgage (P&I)
- −$943
- Tax from tax record
- −$268 /mo · $3,213/yr
- Insurance
- −$75
- HOA
- −$0
- Vacancy / Maint / Mgmt
- −$358
- Net cashflow
- $61
Break-even live
Sensitivity live
| Price | -10% $163 | -5% $112 | +0% $61 | +5% $10 | +10% $-41 |
|---|---|---|---|---|---|
| Rent | -10% $-74 | -5% $-6 | +0% $61 | +5% $128 | +10% $196 |
| Rate | -1.0pp $152 | -0.5pp $107 | base $61 | +0.5pp $14 | +1.0pp $-33 |
UW: 25.0% down · 7.5% · 30yr · 1.5% tax · 5.0% vac · 8.0% maint · 8.0% mgmt
Financing live
Cash to close
- Down payment
- $44,975
- Closing costs
- $5,397
- Reserves months
- —
- Total cash needed
- —
Loan-product check · same deal, 3 products live
Conventional
25% down · 7.5% · 30yr
- Down + closing
- —
- Monthly P&I
- —
- Monthly cashflow
- —
- DSCR
- —
- Eligible?
- —
Personal DTI + credit; lowest rate.
DSCR
20% down · 8.5% · 30yr
- Down + closing
- —
- Monthly P&I
- —
- Monthly cashflow
- —
- DSCR
- —
- Eligible?
- —
No personal income docs; deal must DSCR.
Hard money
10% down · 12.0% · 12mo
- Down + closing
- —
- Monthly P&I
- —
- Monthly cashflow
- —
- DSCR
- —
- Eligible?
- —
Short-term bridge; refi at stabilization.
Rent comps 2 comps
| Address | Beds | Baths | Sqft | Rent | $/sqft | DOM | Units | Dist |
|---|---|---|---|---|---|---|---|---|
| 45 Gratiot Blvd Unit 1550273P Marysville, MI | 2.0 | 1.5 | 1323 | $5,151 | $3.89 | 1d | 1 | 0.34mi |
| 3991 Brookstone Pl Port Huron, MI | 1.0–3.0 | 1.0–2.0 | 980 | $1,560 | $1.59 | 0d | 10 | 1.12mi |
Listing history 2 events
-
2026-06-21remarks 699-char remark
-
2026-06-21$179,900 Active 2 DOM
ⓘ Source: listings_history table (triggers on properties + properties_extension) + one-shot
backfill from property_details.listing_events for pre-trigger history.
Tax reassessment forecast MI · Partial reset (capped growth)
- Current annual tax
- $3,213 · $268/mo
- Projected year-2 tax
- $3,213 · $268/mo
- Expected delta
- $0/yr ($0/mo · 0.0%)
ⓘ Screening estimate from a state-policy table — verify with the county assessor before closing.
Climate risk First Street
- Flood 1/10 Low FEMA zone X (unshaded) · 0% chance over 30 yrs
- Wildfire 3/10 Moderate
- Heat 2/10 Low 7 d/yr ≥99°F today · 14 d/yr by 30 yrs out
- Wind 1/10 Low
- Air quality 3/10 Moderate 2 unhealthy d/yr today · 3 by 30 yrs out
Nearby sold comps map
Loading sold comps map…
Walkable amenities ~0.75 mi
Loading nearby amenities…
Taxation est. · year 1
- Rental income
- $20,463
- − Mortgage interest
- −$10,077
- − Property taxes
- −$3,213
- − Insurance
- −$900
- − Repairs & maintenance
- −$1,637
- − Management
- −$1,637
- − Depreciation
- −$5,233
- Taxable loss
- −$2,234
- Est. tax savings @ 24.0%
- +$536
- After-tax cash flow
- $1,269/yr
For passive investors: Depreciation is non-cash, so a rental often shows a tax loss while cash-flowing — sheltering income. Rental losses are passive: they offset passive income freely, and up to $25,000/yr can offset ordinary (W-2) income if you actively participate and your MAGI is under $100k (phasing out to $0 by $150k); unused losses carry forward. On sale, claimed depreciation is recaptured at up to 25%, and gains may owe capital-gains tax (a 1031 exchange can defer both). Figures are a year-1 estimate at your 24.0% rate — not tax advice; consult a CPA.
Schools (NCES district)
- District
- Port Huron Area School District
- NCES district ID
- 2628830
- Math proficiency
- 23% ▼ -5.00%
- Reading proficiency
- 37% ▼ -2.00%
- Median HH income
- $42,093
- Composite
- 25.4/100
- National rank
- #7462
- State rank
- #368 of 540 in MI
Livability — Port Huron
- Score
- 65/100
- State rank
- #445
- US rank
- #12478
Category grades
Schools grade is shown separately in the Schools card above.
Census & demographics
- Census place
- Port Huron, MI
- County
- Saint Clair County · 44,760 people
- City population
- 39,342
- Metro
- Detroit-Warren-Dearborn, MI
- Population (ZIP)
- 39,342
- Household income
- $53,018
- Rent vs Own
- Severe rent burden
- 1808.0
Population outlook (St. Clair County) Hauer SSP2
- Today (2025)
- 154,587 people
- By 2030
- 150,031 · -2.9%
- By 2040
- 138,177 · -10.6%
- By 2050
- 124,390 · -19.5%
- By 2075
- 95,825 · -38.0%
- By 2100
- 68,672 · -55.6%
Race, ethnicity, and origin ACS 2023
- Neighborhood character
- Predominantly White (80%)
- Race & ethnicity
- White 80% Black 7% Two or more races 7% Hispanic / Latino 6%
- Hispanic origin (detail)
- Mexican 4%
- Common ancestry
- Romanian 6% Lithuanian 4% Slovak 3%
- Foreign-born
- 2% · Canada
- Languages at home
- 97% English-only · Spanish 2%
Political lean MEDSL · St. Clair
- 2024 margin
- Solid R (+34.6) · D 32.0% · R 66.6% · Other 1.4%
- 2008→2024 swing
- -37.3pp toward R · 2008: 2.6pp · 2024: -34.6pp
- All cycles
- 2024: R+34.6 2020: R+30.2 2016: R+31.4 2012: R+7.1 2008: D+2.6
Not yet ingested
- Civics
- —
Market trends
- HPI YoY
- ▼ -134.75%
- Current HPI
- 177.2401
- Rent YoY
- ▲ 3.61%
- Metro
- Detroit-Warren-Dearborn, MI
- State GDP YoY
- ▲ 1.37%
- F500 in state
- 28
Industry mix (Fortune 500 HQ in MI)
| Industry | F500 HQs | Revenue |
|---|---|---|
| Automotive Parts | 3 | $48B |
|
||
| Automotive | 2 | $372B |
|
||
| Chemicals | 1 | $45B |
|
||
| Automotive Retail | 1 | $29B |
|
||
| Healthcare / Medical Devices | 1 | $23B |
|
||
| Automotive Technology | 1 | $20B |
|
||
Price history
+56.4% since first listed31 events — show timeline
- 2026-06-19 Listed $179,900 REALCOMP
- 2026-06-19 Listed $179,900 MiRealSource-MiMLS
- 2024-07-16 Sold (MLS) $155,000 MiRealSource-MiMLS
- 2024-07-16 Sold (MLS) $155,000 REALCOMP
- 2024-06-14 Pending — MiRealSource-MiMLS
- 2024-06-14 Pending — REALCOMP
- 2024-05-21 Price Changed $159,900 MiRealSource-MiMLS
- 2024-05-20 Price Changed $159,900 REALCOMP
- 2024-03-08 Listed $164,900 MiRealSource-MiMLS
- 2024-03-08 Listed $164,900 REALCOMP
- 2024-03-06 Coming Soon $164,900 MiRealSource-MiMLS
- 2024-03-06 Coming Soon $164,900 REALCOMP
- 2021-01-13 Sold (Public Records) $97,500 Public Records
- 2020-12-14 Sold (MLS) $97,500 MiRealSource-MiMLS
- 2020-12-14 Sold (MLS) $97,500 REALCOMP
- 2020-10-29 Pending — MiRealSource-MiMLS
- 2020-10-29 Pending — REALCOMP
- 2020-10-21 Price Changed $106,500 MiRealSource-MiMLS
- 2020-10-21 Price Changed $106,500 REALCOMP
- 2020-10-08 Relisted — MiRealSource-MiMLS
- 2020-10-08 Relisted — REALCOMP
- 2020-09-29 Pending — MiRealSource-MiMLS
- 2020-09-29 Pending — REALCOMP
- 2020-09-15 Price Changed $109,900 MiRealSource-MiMLS
- 2020-09-15 Price Changed $109,900 REALCOMP
- 2020-08-11 Relisted — MiRealSource-MiMLS
- 2020-08-11 Relisted — REALCOMP
- 2020-08-09 Contingent — MiRealSource-MiMLS
- 2020-08-08 Contingent — REALCOMP
- 2020-08-07 Listed $115,000 MiRealSource-MiMLS
- 2020-08-07 Listed $115,000 REALCOMP
Property tax history
+7.6%/yrLatest (2025): $3,213 · +50.1% YoY. Source: county tax records.
Cash-flow waterfall
monthlySold comps — $/sqft
last 12 mo · ≤1 miLoading sold comps…