 Triplex
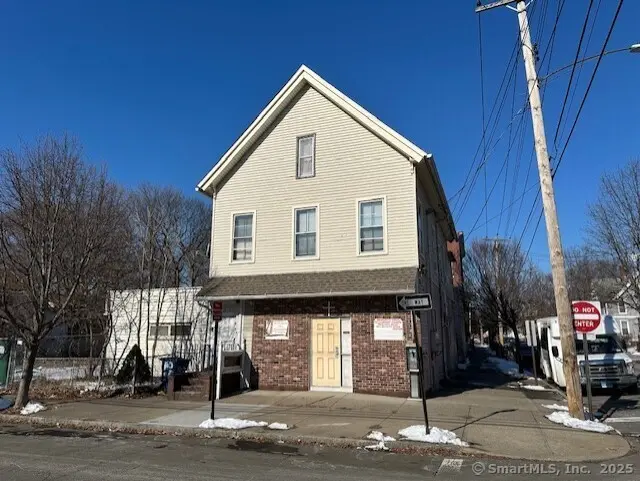
95 Rosette St · New Haven, CT
Flood risk 6/10 · Moderate
- FEMA flood zone
- X (unshaded)
- Chance of flooding over 30 yrs
- 0.95%
- Est. flood insurance / yr
- $473 – $860
Fire risk 1/10 · Minimal
- Est. fire insurance / yr
- $829 – $1,539
Heat risk 7/10 · Major
- Hot days now (above 99°F)
- 7 days/yr
- Hot days in 30 yrs
- 16 days/yr
Wind risk 6/10 · Moderate
- Chance of severe wind over 30 yrs
- 56.0%
Air-quality risk 5/10 · Moderate
- Unhealthy air days now
- 6 days/yr
- Unhealthy air days in 30 yrs
- 8 days/yr
Risk factors via First Street. Map © Google.
Why this score? — see what drove the D+ grade
The composite is a weighted blend of 9 inputs, each scored 0–100. Each bar is that input's sub-score; the figure is the points it added to the 100-point composite (weight × sub-score).
- Cash flow +16.5/30.0
- Appreciation +9.9/10.0
- DSCR +5.1/10.0
- 1% rule +4.5/10.0
- Livability +4.0/5.0
- Rent growth +3.3/5.0
- Schools +1.5/10.0
- Condition / age +1.0/5.0
- ARV discount +0.0/15.0
$665,000
🖨 Deal sheet 📄 Offer letter ✓ Due diligence
Multi-family units
County records classify this as Multi-Family (2-4 Unit). Listing-text estimate: 3 units. confirmed
Listing remarks MLS
Building was being used as a Church reason for - No Property Tax on the property, but could be converted back to a Multifamily. Excellent Location!!! This two family unit has a parking lot, and additional building and lot. The lower unit was used as a church with two baths, large open space room and plenty of storage areas. The second floor unit has its own entrance and was used by the caretaker and has two bedrooms and 1 full bath. Needs renovation, selling "As Is" condition....Big Potential...Priced to Sell!!!
Key facts
- 0.23 acre lot
- 3 garage spots
- Built 1910
Property features AI
Exterior
- Parking: Detached garage; Off-street parking; 6 total parking spaces; 3 garages
- Utilities: Public water connected; Public sewer connected; Electric hot water (50-gallon tank); Electric heat fuel
- Home design: Multi-family property (3-family)
- Construction: Frame construction; Stone foundation
- Exterior features: Corner lot; Level lot; Wood siding; Asphalt shingle roof
Interior
- Bedrooms: 8 bedrooms total
- Bathrooms: 3 full bathrooms; 2 half bathrooms
- Heating & cooling: Baseboard heat; Window unit cooling
- Interior features: 12 total rooms; Partial basement; Finished walk-up attic
Neighborhood map
What this means for you Summary
Snapshot
- This is a 1×3bd/1ba + 1×2bd/1ba + 1×1bd/1ba units multifamily listed at $665k. Condition is rated poor.
Deal economics
- At list price, monthly cash flow is $391 ($5k/yr) — positive. Per door: $130/mo.
- The deal already cash-flows at list — no discount required.
- To meet the 1% rule (rent ≥ 1% of price), the offer needs to be $631k (5.1% below list).
- Recommended offer: $631k (5.1% below list) — sets the bar for 1% rule.
- Cap rate 7.0% vs local median 4.8% in New Haven — top-decile yield for the area; either an underpriced asset or a hidden risk that comps aren't pricing in. Stress-test before assuming the spread holds.
Location & tenants
- Location reads 79/100 on livability (#31 in CT, #2,190 nationally) — a middle-class / working-renter tenant base. Strengths: amenities A+, commute A+, health & safety A+; Watch: employment D, crime F.
- New Haven School District (urban): math 12% / reading 25% proficiency, ranked #147 of 153 in CT (top 96%) — low school quality limits family demand, transient renter base, plan for 1-2y turnover; 66% free/reduced lunch — lower-income household profile, screen leases tightly.
- Zoned schools: Roberto Clemente Leadership Academy For Global Awareness (math 3% / reading 10%, grade F, #541 of 553 statewide, top 98%, 399 students, 90% FRL); Hill Regional Career High School (math 8% / reading 27%, grade F, #173 of 194 statewide, top 90%, 651 students, 78% FRL) — zoned schools average 84% FRL vs 66% district-wide (19 pts higher); higher-poverty schools than district average — tighter screening recommended.
- Market conditions: Rents rising (+3.3%/yr); 46 active listings in the ZIP; 1,059 units permitted in South Central Connecticut Planning Region in 2024 (779 in 5+ unit buildings).
Forward outlook
- In year one you build about $70k of equity ($5k loan paydown + $65k appreciation (9.8% local appreciation)).
- At projected returns (9.8% appreciation + 3.3% rent growth), your $186k cash investment doubles in ~3 years — after that, you're playing with house money.
- By year 2, paydown + projected appreciation supports a ~$112k cash-out refi (75% LTV) — recoverable capital for the next deal without selling this one.
Negotiation context
- It's been on market 17 days — a 2% lower offer ($655k) is reasonable based on typical stale-listing flexibility.
- 2 sale attempts with the ask held roughly flat each time — persistent listings suggest the price (not the market) is what's stuck; bring a comps-based counter.
- Current owner paid $300k; list at $665k implies a 122% gain — meaningful room to come down on a strong offer.
Risks & watch-outs
- Watch-outs: built in 1910 — expect roof / HVAC / electrical / plumbing capex.
- Climate carrying-cost: major flood risk; major wind risk, 56% chance of damaging wind over 30y; extreme-heat days projected 7→16/yr by 2055 (HVAC capex compounding) — expect insurance premiums to compound above CPI over the hold.
Questions for the listing agent
- Can we see the unit-by-unit rent roll, current vacancy, and any below-market leases? What's the average tenancy length?
- What capital expenditures (roof, boiler, parking lot, exteriors) have been made in the last 5 years, and what's planned in the next 2?
- Have any recent inspections been done? Can we get a copy of the seller's disclosures and any deferred-maintenance estimates?
- Built in 1910 — when were the roof, HVAC, electrical panel, plumbing, and water heater last replaced?
- Is there a deadline driving the sale (1031 exchange, divorce, estate, relocation)? That informs how much negotiation room exists.
- Schools are D-rated, which usually means shorter tenancies and higher turnover. Who's the typical renter profile here, and what's been the actual vacancy rate?
- Crime grade is F in this area — have there been break-ins, vandalism, or insurance claims at this property in the last 3 years? What carrier currently insures it and at what premium?
- The area grade is low — what's the realistic commute time and amenity access for the typical tenant pool here? Any planned neighborhood developments (good or bad) we should know about?
- What's the average days-on-market for RENTAL listings here right now (not sales)? A rising rental-DOM trend means longer vacancies and softer asking-rent achievability than the comps imply.
- What's the recent tenant-quality profile in this submarket — average credit score on applications, eviction rate, late-payment / NSF rate, and stable-employment percentage? A property-management company in the area should have these aggregated.
- How much new apartment / multifamily construction is in the pipeline within 1–3 miles? Heavy new supply (>2% of stock underway) typically softens rents 12–24 months out; light construction supports rent growth.
Investment metrics
- 1% rule
- 0.95% ✗
- Cap rate
- 7.00%
- Cash-on-cash
- 2.52%
- DSCR
- 1.11
- GRM
- 8.8
CMA / ARV
- ARV (on-the-fly)
- $466,344
- Comps found
- 11
Show comp detail 11 sales within ~0.75 mi
| Address | Dist | Beds/Ba | Sqft | Sold | Price | $/sf | Match |
|---|---|---|---|---|---|---|---|
| 15 Truman St | 0.28mi | 9/3.0 | 3,630 (-1%) | 1mo | $500,000 | $138 | 81 |
| 56 Dewitt St | 0.04mi | 9/3.0 | 4,032 (+10%) | 17mo | $475,000 | $118 | 64 |
| 34 Cassius St | 0.17mi | 8/2.5 (-1) | 3,744 (+2%) | 17mo | $400,000 | $107 | 64 |
| 51 Salem St | 0.33mi | 10/3.5 (+1) | 3,940 (+7%) | 8mo | $500,000 | $127 | 59 |
| 8 Hurlburt St | 0.19mi | 9/3.0 | 3,314 (-10%) | 18mo | $400,000 | $121 | 56 |
| 284 Hallock Ave | 0.26mi | 8/4.0 (-1) | 3,520 (-4%) | 24mo | $550,000 | $156 | 56 |
| 124 Minor St | 0.39mi | 9/3.0 | 3,894 (+6%) | 16mo | $400,000 | $103 | 55 |
| 248 - 250 Howard Ave | 0.40mi | 10/5.0 (+1) | 3,857 (+5%) | 11mo | $565,000 | $146 | 54 |
| 37 Cassius St | 0.15mi | 8/3.0 (-1) | 3,249 (-12%) | 13mo | $420,000 | $129 | 54 |
| 556 Howard Ave | 0.21mi | 9/3.0 | 3,276 (-11%) | 19mo | $419,900 | $128 | 52 |
| 28 Cassius St | 0.18mi | 8/3.0 (-1) | 3,292 (-10%) | 16mo | $417,050 | $127 | 52 |
Match score weights: distance 35% · size 25% · config 20% · recency 20%. Top-matched comps best support the ARV.
Projected returns pro-forma
9.81% appreciation · 3.3% rent growth · sell at horizon
- IRR
- 25.8%
- Equity multiple
- 3.04×
- Total profit
- $380,409
- Equity at exit
- $589,867
- IRR
- 22.8%
- Equity multiple
- 6.92×
- Total profit
- $1,102,511
- Equity at exit
- $1,262,387
Cash invested: $186,200 (down + closing). Projections, not guarantees.
Landlord ↔ Tenant lean methodology
- Overall (STATE)
- 27 Tenant-Leaning
- State Connecticut
- 27 Tenant-Leaning · D+7
- County
- — inherits STATE
- City
- — inherits STATE
ZIP-level market 06519
- Home prices YoY
- 2.7%
- Rents YoY
- 3.3%
- Active inventory
- 46
- Price-to-rent
- 24.9×
Monthly cashflow live
- Estimated rent
- $6,312 high interval (Pro) →
- Mortgage (P&I)
- −$3,487
- Tax est. 1.5%
- −$831 /mo · $9,975/yr
- Insurance
- −$277
- HOA
- −$0
- Vacancy / Maint / Mgmt
- −$1,326
- Net cashflow
- $391
Break-even live
3-unit breakdown (identical units grouped — click to expand)
| Units | Beds | Baths | Est. rent |
|---|---|---|---|
| 1× unit | 3 | 1 | $2,228 |
| 1× unit | 2 | 1 | $2,035 |
| 1× unit | 1 | 1 | $2,049 |
| Total (3 units) | $6,312 | ||
UW: 25.0% down · 7.5% · 30yr · 1.5% tax · 5.0% vac · 8.0% maint · 8.0% mgmt
Financing live
Cash to close
- Down payment
- $166,250
- Closing costs
- $19,950
- Reserves months
- —
- Total cash needed
- —
Loan-product check · same deal, 3 products live
Conventional
25% down · 7.5% · 30yr
- Down + closing
- —
- Monthly P&I
- —
- Monthly cashflow
- —
- DSCR
- —
- Eligible?
- —
Personal DTI + credit; lowest rate.
DSCR
20% down · 8.5% · 30yr
- Down + closing
- —
- Monthly P&I
- —
- Monthly cashflow
- —
- DSCR
- —
- Eligible?
- —
No personal income docs; deal must DSCR.
Hard money
10% down · 12.0% · 12mo
- Down + closing
- —
- Monthly P&I
- —
- Monthly cashflow
- —
- DSCR
- —
- Eligible?
- —
Short-term bridge; refi at stabilization.
Listing history 15 events
-
2026-06-18days on market $665,000 Active 17 DOM
-
2026-06-17days on market $665,000 Active 16 DOM
-
2026-06-16days on market $665,000 Active 15 DOM
-
2026-06-15days on market $665,000 Active 14 DOM
-
2026-06-14days on market $665,000 Active 12 DOM
-
2026-06-13days on market $665,000 Active 11 DOM
-
2026-06-10days on market $665,000 Active 9 DOM
-
2026-06-09days on market $665,000 Active 8 DOM
-
2026-06-08days on market $665,000 Active 7 DOM
-
2026-06-07days on market $665,000 Active 6 DOM
-
2026-06-05days on market $665,000 Active 3 DOM
-
2026-06-03remarks 699-char remark
-
2026-06-03days on market $665,000 Active 2 DOM
-
2026-06-02remarks 354-char remark
-
2026-06-02$665,000 Active 1 DOM
ⓘ Source: listings_history table (triggers on properties + properties_extension) + one-shot
backfill from property_details.listing_events for pre-trigger history.
Climate risk First Street
- Flood 6/10 Major FEMA zone X (unshaded) · 95% chance over 30 yrs
- Wildfire 1/10 Low
- Heat 7/10 Severe 7 d/yr ≥99°F today · 16 d/yr by 30 yrs out
- Wind 6/10 Major 56% chance of damaging wind over 30 yrs
- Air quality 5/10 Major 6 unhealthy d/yr today · 8 by 30 yrs out
Nearby sold comps map
Loading sold comps map…
Walkable amenities ~0.75 mi
Loading nearby amenities…
Taxation est. · year 1
- Rental income
- $75,744
- − Mortgage interest
- −$37,250
- − Property taxes
- −$9,975
- − Insurance
- −$3,325
- − Repairs & maintenance
- −$6,060
- − Management
- −$6,060
- − Depreciation
- −$19,345
- Taxable loss
- −$6,271
- Est. tax savings @ 24.0%
- +$1,505
- After-tax cash flow
- $6,195/yr
For passive investors: Depreciation is non-cash, so a rental often shows a tax loss while cash-flowing — sheltering income. Rental losses are passive: they offset passive income freely, and up to $25,000/yr can offset ordinary (W-2) income if you actively participate and your MAGI is under $100k (phasing out to $0 by $150k); unused losses carry forward. On sale, claimed depreciation is recaptured at up to 25%, and gains may owe capital-gains tax (a 1031 exchange can defer both). Figures are a year-1 estimate at your 24.0% rate — not tax advice; consult a CPA.
Condition & rehab AI · 1 photo
This 3-unit multifamily property requires extensive repairs and updates to its exterior, structure, and systems, significantly impacting its current condition score. Significant value can be added through comprehensive renovations, including exterior repairs, HVAC upgrades, and landscaping improvements.
Repairs flagged
- Major Exterior siding — Weathered and in need of repair.
- Major Windows — No visible photos of the windows.
- Major Foundation/structure — No visible photos of the foundation/structure.
- Major HVAC/mechanicals — No visible photos of the HVAC/mechanicals.
- Major Landscaping/curb appeal — No visible photos of the landscaping/curb appeal.
Value-add opportunities
- Both Exterior siding repair — Improves both resale and rental value.
- Both Windows replacement — Enhances curb appeal and natural light.
- Both HVAC/mechanical upgrade — Improves comfort and energy efficiency.
- Both Landscaping and curb appeal — Enhances property's visual appeal and marketability.
Renovation cost estimate screening
| Repair item | Severity | Est. cost |
|---|---|---|
| Exterior siding · Weathered and in need of repair. | Major | $15,000–50,000 |
| Windows · No visible photos of the windows. | Major | $15,000–50,000 |
| Foundation/structure · No visible photos of the foundation/structure. | Major | $15,000–50,000 |
| HVAC/mechanicals · No visible photos of the HVAC/mechanicals. | Major | $15,000–50,000 |
| Landscaping/curb appeal · No visible photos of the landscaping/curb appeal. | Major | $15,000–50,000 |
| Total estimated repair cost · 5 items | $75,000–250,000 |
Value-add ROI direction
- Both Exterior siding repair — Improves both resale and rental value. ↑
- Both Windows replacement — Enhances curb appeal and natural light. ↑
- Both HVAC/mechanical upgrade — Improves comfort and energy efficiency. ↑
- Both Landscaping and curb appeal — Enhances property's visual appeal and marketability. ↑
ⓘ Cost ranges are severity-bucket heuristics (US national rule-of-thumb). Get contractor quotes + a written scope before underwriting a rehab budget.
Schools (NCES district)
- District
- New Haven School District
- NCES district ID
- 0902790
- Math proficiency
- 12% ▼ -10.00%
- Reading proficiency
- 25% ▼ -10.00%
- Median HH income
- $38,058
- Composite
- 15.48/100
- National rank
- #9308
- State rank
- #147 of 153 in CT
Livability — New Haven
- Score
- 79/100
- State rank
- #31
- US rank
- #2190
Category grades
Schools grade is shown separately in the Schools card above.
Census & demographics
- Census place
- New Haven, CT
- County
- New Haven County · 688,236 people
- City population
- 132,813
- Metro
- New Haven-Milford, CT
- Population (ZIP)
- 15,605
- Household income
- $49,619
- Rent vs Own
- Severe rent burden
- 1321.0
Population outlook (South Central Connecticut County) Hauer SSP2
- By 2040
- 608,362
Race, ethnicity, and origin ACS 2023
- Neighborhood character
- Diverse neighborhood (Simpson 0.67)
- Race & ethnicity
- Hispanic / Latino 49% Black 26% White 15% Two or more races 13% Asian 4% Native American 1%
- Hispanic origin (detail)
- Mexican 15% Puerto Rican 25% Dominican 3%
- Common ancestry
- Romanian 1% Lithuanian 1%
- Foreign-born
- 25% · Canada, Jamaica, China
- Languages at home
- 50% English-only · Spanish 42% Other Indo-European 4% Arabic 1%
Political lean MEDSL · South Central Connecticut
- 2024 margin
- Strong D (+20.1) · D 59.0% · R 38.9% · Other 2.1%
- All cycles
- 2024: D+20.1
Not yet ingested
- Civics
- —
Market trends
- HPI YoY
- ▲ 9.81%
- Current HPI
- 377.4885
- Rent YoY
- ▲ 3.30%
- Metro
- New Haven-Milford, CT
- State GDP YoY
- ▲ 1.06%
- F500 in state
- 38
Industry mix (Fortune 500 HQ in CT)
| Industry | F500 HQs | Revenue |
|---|---|---|
| Industrial Machinery | 4 | $38B |
|
||
| Insurance | 3 | $71B |
|
||
| Financial Services | 2 | $25B |
|
||
| Transportation / Logistics | 2 | $18B |
|
||
| Healthcare | 1 | $247B |
|
||
| Telecommunications | 1 | $55B |
|
||
Price history
+66.3% since first listed4 events — show timeline
- 2026-05-28 Listed $665,000 Smart MLS
- 2025-03-12 Sold (MLS) $300,000 Smart MLS
- 2025-02-28 Pending — Smart MLS
- 2025-01-27 Listed $399,900 Smart MLS
Cash-flow waterfall
monthlySold comps — $/sqft
last 12 mo · ≤1 miLoading sold comps…