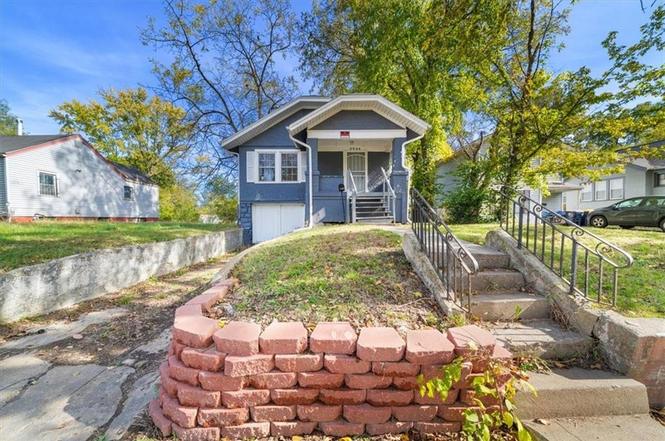
7325 Walrond Ave · Kansas City, MO
Flood risk 1/10 · Minimal
- FEMA flood zone
- X (unshaded)
- Chance of flooding over 30 yrs
- 0.0%
- Est. flood insurance / yr
- $473 – $860
Fire risk 1/10 · Minimal
- Est. fire insurance / yr
- $1,054 – $1,958
Heat risk 4/10 · Minor
- Hot days now (above 106°F)
- 7 days/yr
- Hot days in 30 yrs
- 16 days/yr
Wind risk 2/10 · Minimal
- Chance of severe wind over 30 yrs
- —
Air-quality risk 3/10 · Minor
- Unhealthy air days now
- 3 days/yr
- Unhealthy air days in 30 yrs
- 5 days/yr
Risk factors via First Street. Map © Google.
Why this score? — see what drove the B+ grade
The composite is a weighted blend of 9 inputs, each scored 0–100. Each bar is that input's sub-score; the figure is the points it added to the 100-point composite (weight × sub-score).
- Cash flow +28.2/30.0
- ARV discount +10.3/15.0
- DSCR +10.0/10.0
- Appreciation +10.0/10.0
- 1% rule +6.7/10.0
- Livability +3.9/5.0
- Rent growth +3.2/5.0
- Condition / age +2.5/5.0
- Schools +1.5/10.0
$94,000
🖨 Deal sheet (PDF) 📄 Offer letter ✓ Due diligence
Listing remarks MLS
DRASTIC PRICE REDUCTION!!!!! Motivated seller!! Bring your buyers foks. Come see this cozy AS-IS home, close to schools and shopping . Plus has all new vinyl plank flooring throughout. Home would be a great starter home.
Key facts
- Spacious yard
- Vinyl flooring
- Fresh paint
Tags
Neighborhood map
What this means for you Summary
Snapshot
- This is a 2-bed/1.0-bath single-family listed at $94k.
Deal economics
- At list price, monthly cash flow is $297 ($4k/yr) — positive.
- The deal already cash-flows at list — no discount required.
- Meets the 1% rule at list price ($1k rent vs $94k).
- Recommended offer: $83k (12.0% below list) — sets the bar for market timing.
- Cap rate 10.1% vs local median 3.9% in Kansas City — top-decile yield for the area; either an underpriced asset or a hidden risk that comps aren't pricing in. Stress-test before assuming the spread holds.
Location & tenants
- Location reads 78/100 on livability (#28 in MO, #2,671 nationally) — a middle-class / working-renter tenant base. Strengths: amenities A+, commute A+, cost of living A+; Watch: schools C-, crime F.
- Kansas City 33 (urban): math 12% / reading 24% proficiency, ranked #308 of 324 in MO (top 95%) — low school quality limits family demand, transient renter base, plan for 1-2y turnover; 75% free/reduced lunch — lower-income household profile, screen leases tightly.
- Market conditions: Rents rising (+3.0%/yr); 94 active listings in the ZIP; 3 comparable units currently listed for rent nearby; rentals leasing fast (median 14d on market — plan ~1-2 weeks tenant-placement turnaround); 4,002 units permitted in Jackson County in 2024 (2,271 in 5+ unit buildings).
Forward outlook
- In year one you build about $10k of equity ($650 loan paydown + $9k appreciation (10.0% local appreciation)).
- Jackson County population projected at +4% by 2050 — modest demand growth; plan on rents tracking national, not racing it.
- At projected returns (10.0% appreciation + 3.0% rent growth), your $26k cash investment doubles in ~2 years — after that, you're playing with house money.
- By year 4, paydown + projected appreciation supports a ~$36k cash-out refi (75% LTV) — recoverable capital for the next deal without selling this one.
Negotiation context
- It's been on market 172 days — a 12% lower offer ($83k) is reasonable based on typical stale-listing flexibility.
- 7 sale attempts since 10y ago; this cycle's ask has dropped $26k (22%) from the opening price — seller is motivated, your offer sets the floor, not the list.
Risks & watch-outs
- Watch-outs: built in 1926 — expect roof / HVAC / electrical / plumbing capex.
Questions for the listing agent
- It's been on market 172 days. Have you received any prior offers? Is the seller open to a 12% concession, seller financing, or rate buy-down credit?
- Built in 1926 — when were the roof, HVAC, electrical panel, plumbing, and water heater last replaced?
- Why hasn't it sold? Are there any deal-killer items the seller is aware of (foundation, flood, title, zoning, code violations)?
- Is there a deadline driving the sale (1031 exchange, divorce, estate, relocation)? That informs how much negotiation room exists.
- Crime grade is F in this area — have there been break-ins, vandalism, or insurance claims at this property in the last 3 years? What carrier currently insures it and at what premium?
- What's the average days-on-market for RENTAL listings here right now (not sales)? A rising rental-DOM trend means longer vacancies and softer asking-rent achievability than the comps imply.
- What's the recent tenant-quality profile in this submarket — average credit score on applications, eviction rate, late-payment / NSF rate, and stable-employment percentage? A property-management company in the area should have these aggregated.
- How much new for-sale + rental construction is in the pipeline within 1–3 miles? Heavy new supply typically softens prices + rents 12–24 months out; constrained supply supports both.
Investment metrics
- 1% rule
- 1.17% ✓
- Cap rate
- 10.09%
- Cash-on-cash
- 13.56%
- DSCR
- 1.60
- GRM
- 7.1
CMA / ARV
- ARV (median comp)
- $100,313
- List price
- $94,000
- Delta
- -6.29%
- Verdict
- FAIR
- Comps
- 20 within 1.0 mi
Show comp detail 6 sales within ~0.75 mi
| Address | Dist | Beds/Ba | Sqft | Sold | Price | $/sf | Match |
|---|---|---|---|---|---|---|---|
| 3309 E 73rd St | 0.10mi | 2/1.0 | 672 (+9%) | 1mo | $79,000 | $118 | 80 |
| 7403 Montgall Ave | 0.32mi | 2/1.0 | 614 (-0%) | 7mo | $85,000 | $138 | 79 |
| 7430 Chestnut Ave | 0.31mi | 2/1.0 | 596 (-3%) | 12mo | $69,500 | $117 | 70 |
| 2247 E 69th Ter | 0.73mi | 3/1.5 (+1) | 608 (-1%) | 12mo | $79,900 | $131 | 47 |
| 6920 Agnes St | 0.54mi | 3/1.0 (+1) | 691 (+12%) | 13mo | $90,000 | $130 | 39 |
| 3014 E 69 St | 0.59mi | 2/1.0 | 696 (+13%) | 14mo | $80,000 | $115 | 39 |
Match score weights: distance 35% · size 25% · config 20% · recency 20%. Top-matched comps best support the ARV.
Projected returns pro-forma
10.0% appreciation · 2.98% rent growth · sell at horizon
- IRR
- 34.2%
- Equity multiple
- 3.66×
- Total profit
- $70,076
- Equity at exit
- $84,683
- IRR
- 29.5%
- Equity multiple
- 8.27×
- Total profit
- $191,362
- Equity at exit
- $182,621
Cash invested: $26,320 (down + closing). Projections, not guarantees.
Landlord ↔ Tenant lean methodology
- Overall (STATE)
- 81 Strongly Landlord-Friendly
- State Missouri
- 81 Strongly Landlord-Friendly · R+10
- County
- — inherits STATE
- City
- — inherits STATE
ZIP-level market 64132
- Home prices YoY
- 23.6%
- Rents YoY
- 3.0%
- Active inventory
- 94
- Price-to-rent
- 7.1×
Monthly cashflow live
- Estimated rent
- $1,097 medium interval (Pro) →
- Mortgage (P&I)
- −$493
- Tax from tax record
- −$37 /mo · $443/yr
- Insurance
- −$39
- HOA
- −$0
- Vacancy / Maint / Mgmt
- −$230
- Net cashflow
- $297
Break-even live
Sensitivity live
| Price | -10% $351 | -5% $324 | +0% $297 | +5% $271 | +10% $244 |
|---|---|---|---|---|---|
| Rent | -10% $211 | -5% $254 | +0% $297 | +5% $341 | +10% $384 |
| Rate | -1.0pp $345 | -0.5pp $321 | base $297 | +0.5pp $273 | +1.0pp $248 |
UW: 25.0% down · 7.5% · 30yr · 1.5% tax · 5.0% vac · 8.0% maint · 8.0% mgmt
Financing live
Cash to close
- Down payment
- $23,500
- Closing costs
- $2,820
- Reserves months
- —
- Total cash needed
- —
Loan-product check · same deal, 3 products live
Conventional
25% down · 7.5% · 30yr
- Down + closing
- —
- Monthly P&I
- —
- Monthly cashflow
- —
- DSCR
- —
- Eligible?
- —
Personal DTI + credit; lowest rate.
DSCR
20% down · 8.5% · 30yr
- Down + closing
- —
- Monthly P&I
- —
- Monthly cashflow
- —
- DSCR
- —
- Eligible?
- —
No personal income docs; deal must DSCR.
Hard money
10% down · 12.0% · 12mo
- Down + closing
- —
- Monthly P&I
- —
- Monthly cashflow
- —
- DSCR
- —
- Eligible?
- —
Short-term bridge; refi at stabilization.
Rent comps 3 comps
| Address | Beds | Baths | Sqft | Rent | $/sqft | DOM | Units | Dist |
|---|---|---|---|---|---|---|---|---|
| 2422 E 70th Ter Kansas City, MO | 2.0 | 1.0 | 748 | $1,356 | $1.81 | 13d | 1 | 0.59mi |
| 6921 Prospect Ave Unit C Kansas City, MO | 1.0 | 1.0 | 538 | $850 | $1.58 | 5d | 1 | 0.64mi |
| 3601 E Meyer Blvd Kansas City, MO | 1.0 | 1.0 | 560 | $900 | $1.61 | 44d | 1 | 0.95mi |
Listing history 30 events
-
2026-06-21days on market $94,000 Active 172 DOM
-
2026-06-18days on market $94,000 Active 169 DOM
-
2026-06-17days on market $94,000 Active 168 DOM
-
2026-06-16days on market $94,000 Active 167 DOM
-
2026-06-15days on market $94,000 Active 166 DOM
-
2026-06-13days on market $94,000 Active 164 DOM
-
2026-06-10pricestatus $94,000 Active 160 DOM
-
2026-05-03historical
-
2026-04-03price $99,900
-
2026-02-24status Active
-
2026-02-24price $104,900
-
2026-02-03historical
-
2026-01-20price $110,000
-
2025-12-18price $115,000
-
2025-11-03$120,000 Active
-
2025-05-22historical $1,000
-
2025-04-16price $1,000
-
2025-03-28price $1,050
-
2024-11-26$1,150
-
2024-01-21historical $1,025
-
2024-01-10$1,025
-
2020-05-28soldstatus
-
2019-06-10historical 220-char remark
Show marketing remark (220 chars)
DRASTIC PRICE REDUCTION!!!!! Motivated seller!! Bring your buyers foks. Come see this cozy AS-IS home, close to schools and shopping . Plus has all new vinyl plank flooring throughout. Home would be a great starter home.
-
2019-05-03price $59,900 220-char remark
Show marketing remark (220 chars)
DRASTIC PRICE REDUCTION!!!!! Motivated seller!! Bring your buyers foks. Come see this cozy AS-IS home, close to schools and shopping . Plus has all new vinyl plank flooring throughout. Home would be a great starter home.
-
2019-05-02status Active 220-char remark
Show marketing remark (220 chars)
DRASTIC PRICE REDUCTION!!!!! Motivated seller!! Bring your buyers foks. Come see this cozy AS-IS home, close to schools and shopping . Plus has all new vinyl plank flooring throughout. Home would be a great starter home.
-
2019-02-23historical 220-char remark
Show marketing remark (220 chars)
DRASTIC PRICE REDUCTION!!!!! Motivated seller!! Bring your buyers foks. Come see this cozy AS-IS home, close to schools and shopping . Plus has all new vinyl plank flooring throughout. Home would be a great starter home.
-
2019-01-12$79,500 Active 220-char remark
Show marketing remark (220 chars)
DRASTIC PRICE REDUCTION!!!!! Motivated seller!! Bring your buyers foks. Come see this cozy AS-IS home, close to schools and shopping . Plus has all new vinyl plank flooring throughout. Home would be a great starter home.
-
2017-07-01historical
-
2016-11-14$34,000 Active
-
1989-08-21soldstatus
ⓘ Source: listings_history table (triggers on properties + properties_extension) + one-shot
backfill from property_details.listing_events for pre-trigger history.
Tax reassessment forecast MO · Resets to sale price
- Current annual tax
- $443 · $37/mo
- Projected year-2 tax
- $912 · $76/mo
- Expected delta
- +$469/yr (+$39/mo · 106.0%)
ⓘ Screening estimate from a state-policy table — verify with the county assessor before closing.
Climate risk First Street
- Flood 1/10 Low FEMA zone X (unshaded) · 0% chance over 30 yrs
- Wildfire 1/10 Low
- Heat 4/10 Moderate 7 d/yr ≥106°F today · 16 d/yr by 30 yrs out
- Wind 2/10 Low
- Air quality 3/10 Moderate 3 unhealthy d/yr today · 5 by 30 yrs out
Nearby sold comps map
Loading sold comps map…
Walkable amenities ~0.75 mi
Loading nearby amenities…
Taxation est. · year 1
- Rental income
- $13,159
- − Mortgage interest
- −$5,265
- − Property taxes
- −$443
- − Insurance
- −$470
- − Repairs & maintenance
- −$1,053
- − Management
- −$1,053
- − Depreciation
- −$2,735
- Taxable income
- $2,141
- Est. tax owed @ 24.0%
- −$514
- After-tax cash flow
- $3,054/yr
For passive investors: Depreciation is non-cash, so a rental often shows a tax loss while cash-flowing — sheltering income. Rental losses are passive: they offset passive income freely, and up to $25,000/yr can offset ordinary (W-2) income if you actively participate and your MAGI is under $100k (phasing out to $0 by $150k); unused losses carry forward. On sale, claimed depreciation is recaptured at up to 25%, and gains may owe capital-gains tax (a 1031 exchange can defer both). Figures are a year-1 estimate at your 24.0% rate — not tax advice; consult a CPA.
Schools (NCES district)
- District
- Kansas City 33
- NCES district ID
- 2916400
- Math proficiency
- 12% ▼ -8.00%
- Reading proficiency
- 24% ▬ 0.00%
- Median HH income
- $35,227
- Composite
- 14.8/100
- National rank
- #9387
- State rank
- #308 of 324 in MO
Livability — Kansas City
- Score
- 78/100
- State rank
- #28
- US rank
- #2671
Category grades
Schools grade is shown separately in the Schools card above.
Census & demographics
- Census place
- Kansas City, MO
- County
- Jackson County · 687,798 people
- City population
- 439,467
- Metro
- Kansas City, MO-KS
- Population (ZIP)
- 12,084
- Household income
- $45,622
- Rent vs Own
- Severe rent burden
- 679.0
Population outlook (Jackson County) Hauer SSP2
- Today (2025)
- 719,589 people
- By 2030
- 731,456 · +1.6%
- By 2040
- 746,689 · +3.8%
- By 2050
- 749,289 · +4.1%
- By 2075
- 736,227 · +2.3%
- By 2100
- 668,210 · -7.1%
Race, ethnicity, and origin ACS 2023
- Neighborhood character
- Predominantly Black (66%)
- Race & ethnicity
- Black 66% White 16% Hispanic / Latino 11% Two or more races 10%
- Hispanic origin (detail)
- Mexican 9%
- Common ancestry
- Italian 2% Scotch-Irish 1% Romanian 1%
- Foreign-born
- 6% · Canada, Jamaica
- Languages at home
- 92% English-only · Spanish 7%
Political lean MEDSL · Jackson
- 2024 margin
- D (+19.3) · D 58.9% · R 39.5% · Other 1.6%
- 2008→2024 swing
- -6.1pp toward R · 2008: 25.4pp · 2024: 19.3pp
- All cycles
- 2024: D+19.3 2020: D+22.0 2016: D+16.6 2012: D+19.0 2008: D+25.4
Not yet ingested
- Civics
- —
Market trends
- HPI YoY
- ▲ 79.13%
- Current HPI
- 414.4305
- Rent YoY
- ▲ 2.98%
- Metro
- Kansas City, MO-KS
- State GDP YoY
- ▲ 1.84%
- F500 in state
- 20
Industry mix (Fortune 500 HQ in MO)
| Industry | F500 HQs | Revenue |
|---|---|---|
| Healthcare | 1 | $163B |
|
||
| Insurance | 1 | $21B |
|
||
| Industrial Technology | 1 | $17B |
|
||
| Retail | 1 | $16B |
|
||
| Industrial Distribution | 1 | $10B |
|
||
| Utilities | 1 | $9B |
|
||
Price history
+193.8% since first listed23 events — show timeline
- 2026-05-03 Listing Removed — Heartland MLS as Distributed by MLS Grid
- 2026-04-03 Price Changed $99,900 Heartland MLS as Distributed by MLS Grid
- 2026-02-24 Relisted — Heartland MLS as Distributed by MLS Grid
- 2026-02-24 Price Changed $104,900 Heartland MLS as Distributed by MLS Grid
- 2026-02-03 Listing Removed — Heartland MLS as Distributed by MLS Grid
- 2026-01-20 Price Changed $110,000 Heartland MLS as Distributed by MLS Grid
- 2025-12-18 Price Changed $115,000 Heartland MLS as Distributed by MLS Grid
- 2025-11-03 Listed $120,000 Heartland MLS as Distributed by MLS Grid
- 2025-05-22 Rental Removed $1,000 RENTLY
- 2025-04-16 Price Changed $1,000 RENTLY
- 2025-03-28 Price Changed $1,050 RENTLY
- 2024-11-26 Listed for Rent $1,150 RENTLY
- 2024-01-21 Rental Removed $1,025 RENTLY
- 2024-01-10 Listed for Rent $1,025 RENTLY
- 2020-05-28 Sold (Public Records) — Public Records
- 2019-06-10 Listing Removed — Heartland MLS as Distributed by MLS Grid
- 2019-05-03 Price Changed $59,900 Heartland MLS as Distributed by MLS Grid
- 2019-05-02 Relisted — Heartland MLS as Distributed by MLS Grid
- 2019-02-23 Listing Removed — Heartland MLS as Distributed by MLS Grid
- 2019-01-12 Listed $79,500 Heartland MLS as Distributed by MLS Grid
- 2017-07-01 Listing Removed — Heartland MLS as Distributed by MLS Grid
- 2016-11-14 Listed $34,000 Heartland MLS as Distributed by MLS Grid
- 1989-08-21 Sold (Public Records) — Public Records
Property tax history
+5.2%/yrLatest (2025): $443 · -65.9% YoY. Source: county tax records.
Cash-flow waterfall
monthlySold comps — $/sqft
last 12 mo · ≤1 miLoading sold comps…