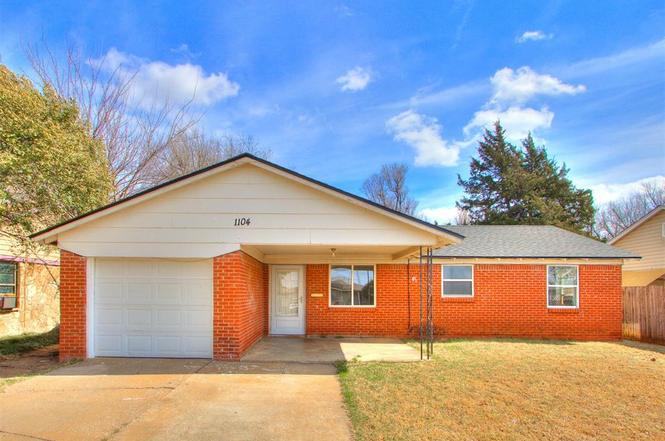
1104 Stansell Dr · Midwest City, OK
Flood risk 1/10 · Minimal
- FEMA flood zone
- X (unshaded)
- Chance of flooding over 30 yrs
- 0.0%
- Est. flood insurance / yr
- $507 – $1,088
Fire risk 1/10 · Minimal
- Est. fire insurance / yr
- $2,463 – $4,575
Heat risk 6/10 · Moderate
- Hot days now (above 107°F)
- 7 days/yr
- Hot days in 30 yrs
- 19 days/yr
Wind risk 2/10 · Minimal
- Chance of severe wind over 30 yrs
- 4.0%
Air-quality risk 2/10 · Minimal
- Unhealthy air days now
- 1 days/yr
- Unhealthy air days in 30 yrs
- 3 days/yr
Risk factors via First Street. Map © Google.
Why this score? — see what drove the D grade
The composite is a weighted blend of 9 inputs, each scored 0–100. Each bar is that input's sub-score; the figure is the points it added to the 100-point composite (weight × sub-score).
- Cash flow +16.2/30.0
- ARV discount +6.6/15.0
- DSCR +5.0/10.0
- 1% rule +3.6/10.0
- Livability +3.6/5.0
- Rent growth +3.2/5.0
- Condition / age +2.5/5.0
- Schools +1.2/10.0
- Appreciation +0.0/10.0
$130,000
🖨 Deal sheet (PDF) 📄 Offer letter ✓ Due diligence
Listing remarks MLS
Brick house.Needs paint,carpet,general clean-up.Currently being sold as-is.No owner-carry.All rooms are nice size.Could be a great rental.
Key facts
- New stove
- Renovated bathroom
- One year old roof
Tags
Property features AI
Finance
- Other: Living area recorded by assessor; Historical designation: No; Occupied: No; Days on market: 14
- Financial info: Accepts Cash, Conventional, FHA or VA; Loan qualifying allowed; Not assumable
- HOA & community: No mandatory association dues
Exterior
- Parking: 1-car garage
- Utilities: Homestead exemption applied
- Home design: Single family residence; One level; Faces west; Residential property
- Construction: Brick and frame construction; Composition roof; Built (existing)
- Exterior features: Cabana; Interior lot
Interior
- Kitchen: Gas range; Free‑standing gas oven
- Bedrooms: 3 bedrooms
- Bathrooms: 1 full bathroom
- Heating & cooling: Combination cooling
- Interior features: No fireplace; No in-law plan
- Laundry & utility: Slab foundation
Neighborhood map
What this means for you Summary
Snapshot
- This is a 2-bed/1.0-bath single-family listed at $130k.
Deal economics
- At list price, monthly cash flow is $69 ($827/yr) — positive.
- The deal already cash-flows at list — no discount required.
- To meet the 1% rule (rent ≥ 1% of price), the offer needs to be $111k (14.4% below list).
- Recommended offer: $111k (14.4% below list) — sets the bar for 1% rule.
- Cap rate 6.9% vs local median 5.6% in Midwest City — meaningfully above typical; check what's discounted (condition, days-on-market, listing class) to confirm the premium yield is real.
Location & tenants
- Location reads 71/100 on livability (#30 in OK) — a middle-class / working-renter tenant base. Strengths: cost of living A+, housing A+, health & safety A; Watch: crime D+, employment D, amenities F.
- Midwest City-Del City (suburban): math 10% / reading 17% proficiency, ranked #231 of 270 in OK (top 86%) — low school quality limits family demand, transient renter base, plan for 1-2y turnover.
- Zoned schools: Country Estates Es (math 12% / reading 17%, grade F, #604 of 845 statewide, top 76%, 335 students, 0% FRL); Midwest City Hs (math 7% / reading 17%, grade F, #359 of 447 statewide, top 80%, 1,368 students, 0% FRL) — zoned schools average 0% FRL vs 57% district-wide (57 pts lower); this property's tenant base skews higher-income than the district average.
- Market conditions: Rents rising (+3.0%/yr); 173 active listings in the ZIP; 40 comparable units currently listed for rent nearby; rentals at typical pace (median 19d on market — plan ~3-4 weeks tenant-placement turnaround); 5,365 units permitted in Oklahoma County in 2024 (569 in 5+ unit buildings).
Forward outlook
- Local home prices are declining (-3.0%/yr); year-one equity from $899 of loan paydown is wiped out by about $4k of value loss. Plan a longer hold.
- Oklahoma County population projected at +41% by 2050 — long-run rental-demand tailwind backs the buy-and-hold thesis.
Negotiation context
- It's been on market 34 days — a 3% lower offer ($126k) is reasonable based on typical stale-listing flexibility.
- 2 sale attempts since 22y ago; this cycle's ask has dropped $15k (10%) from the opening price — seller is motivated, your offer sets the floor, not the list.
- Current owner paid $40k; list at $130k implies a 225% gain — meaningful room to come down on a strong offer.
Risks & watch-outs
- Watch-outs: built in 1950 — expect roof / HVAC / electrical / plumbing capex.
- Climate carrying-cost: extreme-heat days projected 7→19/yr by 2055 (HVAC capex compounding) — expect insurance premiums to compound above CPI over the hold.
Questions for the listing agent
- It's been on market 34 days. Have you received any prior offers? Is the seller open to a 14% concession, seller financing, or rate buy-down credit?
- Built in 1950 — when were the roof, HVAC, electrical panel, plumbing, and water heater last replaced?
- Is there a deadline driving the sale (1031 exchange, divorce, estate, relocation)? That informs how much negotiation room exists.
- Schools are D-rated, which usually means shorter tenancies and higher turnover. Who's the typical renter profile here, and what's been the actual vacancy rate?
- Crime grade is D in this area — have there been break-ins, vandalism, or insurance claims at this property in the last 3 years? What carrier currently insures it and at what premium?
- The area grade is low — what's the realistic commute time and amenity access for the typical tenant pool here? Any planned neighborhood developments (good or bad) we should know about?
- What's the average days-on-market for RENTAL listings here right now (not sales)? A rising rental-DOM trend means longer vacancies and softer asking-rent achievability than the comps imply.
- What's the recent tenant-quality profile in this submarket — average credit score on applications, eviction rate, late-payment / NSF rate, and stable-employment percentage? A property-management company in the area should have these aggregated.
- How much new for-sale + rental construction is in the pipeline within 1–3 miles? Heavy new supply typically softens prices + rents 12–24 months out; constrained supply supports both.
Investment metrics
- 1% rule
- 0.86% ✗
- Cap rate
- 6.93%
- Cash-on-cash
- 2.27%
- DSCR
- 1.10
- GRM
- 9.7
CMA / ARV
- ARV (on-the-fly)
- $127,323
- Comps found
- 12
Show comp detail 12 sales within ~0.75 mi
| Address | Dist | Beds/Ba | Sqft | Sold | Price | $/sf | Match |
|---|---|---|---|---|---|---|---|
| 1104 Stansell Dr | 0.00mi | 3/1.0 (+1) | 903 (0%) | 1mo | $130,000 | $144 | 94 |
| 1500 Sandra Dr | 0.29mi | 2/1.0 | 816 (-10%) | 2mo | $114,900 | $141 | 69 |
| 713 E Proctor Pl | 0.26mi | 3/1.0 (+1) | 990 (+10%) | 2mo | $135,000 | $136 | 65 |
| 128 W Lilac Ln | 0.54mi | 3/1.0 (+1) | 875 (-3%) | 1mo | $75,000 | $86 | 64 |
| 6220 SE 11th St | 0.53mi | 3/1.0 (+1) | 933 (+3%) | 4mo | $155,000 | $166 | 62 |
| 207 W Ercoupe Dr | 0.65mi | 2/1.0 | 864 (-4%) | 2mo | $117,500 | $136 | 61 |
| 508 W Lockheed Dr | 0.65mi | 3/1.0 (+1) | 924 (+2%) | 2mo | $115,000 | $124 | 59 |
| 1407 E Lockheed Ct | 0.53mi | 2/1.0 | 816 (-10%) | 2mo | $138,500 | $170 | 57 |
| 220 W Ercoupe Dr | 0.64mi | 2/1.0 | 816 (-10%) | 0mo | $118,000 | $145 | 54 |
| 208 W Jacobs Dr | 0.50mi | 3/1.0 (+1) | 1,022 (+13%) | 0mo | $171,000 | $167 | 50 |
| 109 E Northrup Dr | 0.62mi | 3/2.0 (+1) | 950 (+5%) | 6mo | $100,000 | $105 | 48 |
| 1800 N Mitchell Dr | 0.39mi | 3/1.5 (+1) | 1,038 (+15%) | 6mo | $142,900 | $138 | 45 |
Match score weights: distance 35% · size 25% · config 20% · recency 20%. Top-matched comps best support the ARV.
Projected returns pro-forma
-3.0% appreciation · 2.99% rent growth · sell at horizon
- IRR
- -12.7%
- Equity multiple
- 0.54×
- Total profit
- $-16,727
- Equity at exit
- $19,383
- IRR
- -3.8%
- Equity multiple
- 0.75×
- Total profit
- $-9,114
- Equity at exit
- $11,240
Cash invested: $36,400 (down + closing). Projections, not guarantees.
Landlord ↔ Tenant lean methodology
- Overall (STATE)
- 83 Strongly Landlord-Friendly
- State Oklahoma
- 83 Strongly Landlord-Friendly · R+20
- County
- — inherits STATE
- City
- — inherits STATE
ZIP-level market 73110
- Rents YoY
- 3.0%
- Active inventory
- 173
- Price-to-rent
- 9.7×
Monthly cashflow live
- Estimated rent
- $1,113 high interval (Pro) →
- Mortgage (P&I)
- −$682
- Tax from tax record
- −$74 /mo · $890/yr
- Insurance
- −$54
- HOA
- −$0
- Vacancy / Maint / Mgmt
- −$234
- Net cashflow
- $69
Break-even live
Sensitivity live
| Price | -10% $142 | -5% $106 | +0% $69 | +5% $32 | +10% $-5 |
|---|---|---|---|---|---|
| Rent | -10% $-19 | -5% $25 | +0% $69 | +5% $113 | +10% $157 |
| Rate | -1.0pp $134 | -0.5pp $102 | base $69 | +0.5pp $35 | +1.0pp $1 |
UW: 25.0% down · 7.5% · 30yr · 1.5% tax · 5.0% vac · 8.0% maint · 8.0% mgmt
Financing live
Cash to close
- Down payment
- $32,500
- Closing costs
- $3,900
- Reserves months
- —
- Total cash needed
- —
Loan-product check · same deal, 3 products live
Conventional
25% down · 7.5% · 30yr
- Down + closing
- —
- Monthly P&I
- —
- Monthly cashflow
- —
- DSCR
- —
- Eligible?
- —
Personal DTI + credit; lowest rate.
DSCR
20% down · 8.5% · 30yr
- Down + closing
- —
- Monthly P&I
- —
- Monthly cashflow
- —
- DSCR
- —
- Eligible?
- —
No personal income docs; deal must DSCR.
Hard money
10% down · 12.0% · 12mo
- Down + closing
- —
- Monthly P&I
- —
- Monthly cashflow
- —
- DSCR
- —
- Eligible?
- —
Short-term bridge; refi at stabilization.
Rent comps 40 comps
| Address | Beds | Baths | Sqft | Rent | $/sqft | DOM | Units | Dist |
|---|---|---|---|---|---|---|---|---|
| 1111 Jet Dr Oklahoma City, OK | 3.0 | 1.0 | 1067 | $1,095 | $1.03 | 23d | 1 | 0.16mi |
| 1111 Jet Dr Oklahoma City, OK | 3.0 | 1.0 | 1067 | $1,095 | $1.03 | 6d | 1 | 0.16mi |
| 6608 SE 15th St Oklahoma City, OK | 3.0 | 2.0 | 1103 | $1,425 | $1.29 | 23d | 1 | 0.17mi |
| 317 W Peach St Oklahoma City, OK | 2.0 | 1.0 | 878 | $1,045 | $1.19 | 4d | 1 | 0.27mi |
| 314 W Peach St Midwest City, OK | 2.0 | 1.0 | 736 | $950 | $1.29 | 25d | 1 | 0.28mi |
| 313 W Peach St Oklahoma City, OK | 2.0 | 1.0 | 724 | $975 | $1.35 | 19d | 1 | 0.29mi |
| 2220 S Air Depot Blvd Oklahoma City, OK | 3.0 | 1.0 | 1020 | $1,395 | $1.37 | 25d | 1 | 0.38mi |
| 407 W Fairchild Dr Oklahoma City, OK | 3.0 | 1.0 | 1062 | $1,045 | $0.98 | 4d | 1 | 0.48mi |
| 215 W McArthur Dr Oklahoma City, OK | 2.0 | 1.0–2.0 | 795 | $1,122 | $1.41 | 4d | 5 | 0.49mi |
| 7122 SE 15th St Oklahoma City, OK | 2.0 | 1.0 | 816 | $1,100 | $1.35 | 6d | 1 | 0.55mi |
| 423 W Douglas Dr Oklahoma City, OK | 3.0 | 1.0 | 1014 | $1,095 | $1.08 | 23d | 1 | 0.58mi |
| 201 W Fairchild Dr Oklahoma City, OK | 3.0 | 1.0 | 984 | $975 | $0.99 | 4d | 1 | 0.61mi |
| 208 W Ercoupe Dr Oklahoma City, OK | 3.0 | 1.0 | 1125 | $1,500 | $1.33 | 25d | 1 | 0.66mi |
| 204 Elm St Oklahoma City, OK | 3.0 | 2.0 | 1098 | $1,250 | $1.14 | 25d | 1 | 0.67mi |
| 209 W Douglas Dr Oklahoma City, OK | 2.0 | 1.0 | 952 | $895 | $0.94 | 19d | 1 | 0.69mi |
| 204 W Lockheed Dr Oklahoma City, OK | 2.0 | 1.0 | 864 | $1,150 | $1.33 | 19d | 1 | 0.73mi |
| 404 Mid America Blvd Oklahoma City, OK | 2.0 | 1.0 | 831 | $1,150 | $1.38 | 4d | 1 | 0.75mi |
| 305 Babb Dr Oklahoma City, OK | 1.0 | 1.0 | 625 | $825 | $1.32 | 6d | 1 | 0.79mi |
| 312 Bolton Pl Oklahoma City, OK | 3.0 | 1.5 | 756 | $1,099 | $1.45 | 25d | 1 | 0.87mi |
| 810 N Marshall Dr Midwest City, OK | 1.0 | 1.0 | 686 | $875 | $1.28 | 22d | 1 | 0.88mi |
| 2105 Maple Dr Midwest City, OK | 3.0 | 2.0 | 1032 | $1,295 | $1.25 | 25d | 1 | 0.90mi |
| 413 E Northrup Dr Oklahoma City, OK | 3.0 | 1.0 | 800 | $1,395 | $1.74 | 4d | 1 | 0.91mi |
| 417 Babb Dr Midwest City, OK | 1.0 | 1.0 | 640 | $700 | $1.09 | 13d | 1 | 0.93mi |
| 422 E Northrup Dr Oklahoma City, OK | 3.0 | 1.0 | 819 | $1,395 | $1.70 | 3d | 1 | 0.96mi |
| 444 1/2 Babb Dr Oklahoma City, OK | 2.0 | 1.0 | 920 | $895 | $0.97 | 6d | 1 | 0.99mi |
| 442 Babb Dr Oklahoma City, OK | 2.0 | 2.0 | 920 | $925 | $1.01 | 6d | 1 | 0.99mi |
| 901 N Key Blvd Oklahoma City, OK | 1.0 | 1.0 | 620 | $600 | $0.97 | 16d | 1 | 1.00mi |
| 705 N key Blvd Midwest City, OK | 1.0 | 1.0 | 700 | $795 | $1.14 | 25d | 1 | 1.02mi |
| 421 N Key Blvd Oklahoma City, OK | 2.0 | 1.0 | 780 | $900 | $1.15 | 25d | 1 | 1.09mi |
| 536 E Northrup Dr Oklahoma City, OK | 2.0 | 1.0 | 858 | $889 | $1.04 | 4d | 1 | 1.13mi |
| 403 N Key Blvd Oklahoma City, OK | 2.0 | 1.0 | 794 | $995 | $1.25 | 6d | 1 | 1.13mi |
| 4772 SE 23rd St Oklahoma City, OK | 3.0 | 1.0 | 1044 | $1,300 | $1.25 | 4d | 1 | 1.17mi |
| 538 E Indian Dr Oklahoma City, OK | 2.0 | 1.0 | 739 | $920 | $1.24 | 23d | 1 | 1.18mi |
| 6000 E Reno Ave Oklahoma City, OK | 1.0–2.0 | 1.0–2.0 | 692 | $989 | $1.43 | 25d | 1 | 1.20mi |
| 205 N Key Blvd Oklahoma City, OK | 2.0 | 1.0 | 1047 | $995 | $0.95 | 23d | 1 | 1.20mi |
| 4765 SE 25th St Oklahoma City, OK | 2.0 | 1.0 | 864 | $895 | $1.04 | 6d | 1 | 1.23mi |
| 322 E Kerr Dr Oklahoma City, OK | 3.0 | 1.0 | 1086 | $1,200 | $1.10 | 25d | 1 | 1.23mi |
| 4625 Tinker Diagonal Oklahoma City, OK | 1.0 | 1.0 | 600 | $850 | $1.42 | 12d | 1 | 1.25mi |
| 4625 Tinker Diagonal Oklahoma City, OK | 1.0 | 1.0 | 600 | $850 | $1.42 | 21d | 1 | 1.25mi |
| 4625 Tinker Diagonal Oklahoma City, OK | 2.0 | 2.0 | 900 | $1,050 | $1.17 | 13d | 1 | 1.25mi |
Listing history 7 events
-
2026-04-13status Pending
-
2026-03-23price $130,000
-
2026-03-09$144,900 Active
-
2004-03-29soldstatus $40,000
-
2004-03-26soldstatus $40,000 138-char remark
Show marketing remark (138 chars)
Brick house.Needs paint,carpet,general clean-up.Currently being sold as-is.No owner-carry.All rooms are nice size.Could be a great rental.
-
2004-02-19$40,000 138-char remark
Show marketing remark (138 chars)
Brick house.Needs paint,carpet,general clean-up.Currently being sold as-is.No owner-carry.All rooms are nice size.Could be a great rental.
-
1989-10-18soldstatus $12,000
ⓘ Source: listings_history table (triggers on properties + properties_extension) + one-shot
backfill from property_details.listing_events for pre-trigger history.
Tax reassessment forecast OK · Resets to sale price
- Current annual tax
- $890 · $74/mo
- Projected year-2 tax
- $1,170 · $98/mo
- Expected delta
- +$280/yr (+$23/mo · 31.5%)
ⓘ Screening estimate from a state-policy table — verify with the county assessor before closing.
Climate risk First Street
- Flood 1/10 Low FEMA zone X (unshaded) · 0% chance over 30 yrs
- Wildfire 1/10 Low
- Heat 6/10 Major 7 d/yr ≥107°F today · 19 d/yr by 30 yrs out
- Wind 2/10 Low 4% chance of damaging wind over 30 yrs
- Air quality 2/10 Low 1 unhealthy d/yr today · 3 by 30 yrs out
Nearby sold comps map
Loading sold comps map…
Walkable amenities ~0.75 mi
Loading nearby amenities…
Taxation est. · year 1
- Rental income
- $13,351
- − Mortgage interest
- −$7,282
- − Property taxes
- −$890
- − Insurance
- −$650
- − Repairs & maintenance
- −$1,068
- − Management
- −$1,068
- − Depreciation
- −$3,782
- Taxable loss
- −$1,389
- Est. tax savings @ 24.0%
- +$333
- After-tax cash flow
- $1,160/yr
For passive investors: Depreciation is non-cash, so a rental often shows a tax loss while cash-flowing — sheltering income. Rental losses are passive: they offset passive income freely, and up to $25,000/yr can offset ordinary (W-2) income if you actively participate and your MAGI is under $100k (phasing out to $0 by $150k); unused losses carry forward. On sale, claimed depreciation is recaptured at up to 25%, and gains may owe capital-gains tax (a 1031 exchange can defer both). Figures are a year-1 estimate at your 24.0% rate — not tax advice; consult a CPA.
Schools (NCES district)
- District
- Midwest City-Del City
- NCES district ID
- 4019950
- Math proficiency
- 10% ▼ -11.00%
- Reading proficiency
- 17% ▼ -8.00%
- Median HH income
- $45,724
- Composite
- 12.09/100
- National rank
- #9658
- State rank
- #231 of 270 in OK
Livability — Midwest City
- Score
- 71/100
- State rank
- #30
- US rank
- #6637
Category grades
Schools grade is shown separately in the Schools card above.
Census & demographics
- Census place
- Midwest City, OK
- County
- Oklahoma County · 771,644 people
- City population
- 57,386
- Metro
- Oklahoma City, OK
- Population (ZIP)
- 32,348
- Household income
- $51,228
- Rent vs Own
- Severe rent burden
- 1440.0
Population outlook (Oklahoma County) Hauer SSP2
- Today (2025)
- 911,875 people
- By 2030
- 982,413 · +7.7%
- By 2040
- 1,130,468 · +24.0%
- By 2050
- 1,288,422 · +41.3%
- By 2075
- 1,711,482 · +87.7%
- By 2100
- 2,088,448 · +129.0%
Race, ethnicity, and origin ACS 2023
- Neighborhood character
- Diverse neighborhood (Simpson 0.63)
- Race & ethnicity
- White 55% Black 25% Two or more races 11% Hispanic / Latino 7% Native American 4% Asian 1%
- Hispanic origin (detail)
- Mexican 5%
- Common ancestry
- Lithuanian 2% Slovak 1% Serbian 1%
- Foreign-born
- 3% · Canada, Vietnam
- Languages at home
- 95% English-only · Spanish 3%
Political lean MEDSL · Oklahoma
- 2024 margin
- Toss-up / Even · D 48.0% · R 49.7% · Other 2.3%
- 2008→2024 swing
- +15.1pp toward D · 2008: -16.8pp · 2024: -1.7pp
- All cycles
- 2024: R+1.7 2020: R+1.1 2016: R+10.5 2012: R+16.7 2008: R+16.8
Not yet ingested
- Civics
- —
Market trends
- HPI YoY
- ▼ -156.25%
- Current HPI
- 257.0791
- Rent YoY
- ▲ 2.99%
- Metro
- Oklahoma City, OK
- State GDP YoY
- ▲ 1.55%
- F500 in state
- 6
Industry mix (Fortune 500 HQ in OK)
| Industry | F500 HQs | Revenue |
|---|---|---|
| Energy | 3 | $48B |
|
||
Price history
+983.3% since first listed7 events — show timeline
- 2026-04-13 Pending — MLSOK
- 2026-03-23 Price Changed $130,000 MLSOK
- 2026-03-09 Listed $144,900 MLSOK
- 2004-03-29 Sold (Public Records) $40,000 Public Records
- 2004-03-26 Sold (MLS) $40,000 MLSOK
- 2004-02-19 Listed $40,000 MLSOK
- 1989-10-18 Sold (Public Records) $12,000 Public Records
Property tax history
+2.6%/yrLatest (2025): $890 · +2.5% YoY. Source: county tax records.
Cash-flow waterfall
monthlySold comps — $/sqft
last 12 mo · ≤1 miLoading sold comps…