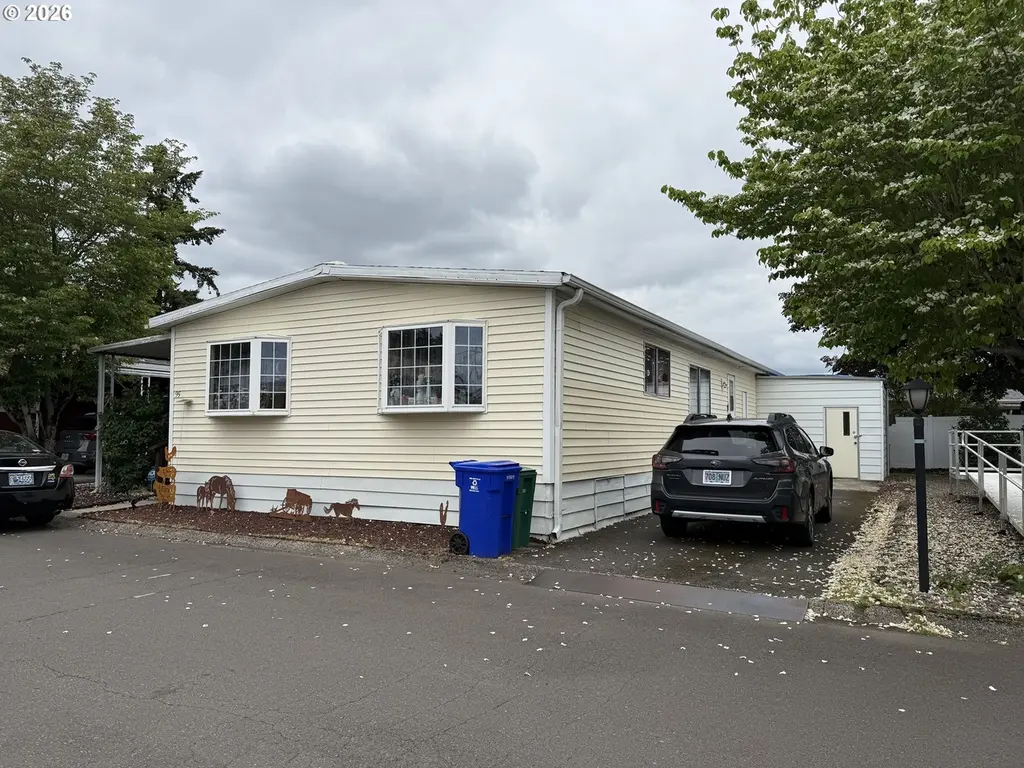
13640 SE Highway 212 #95 · Happy Valley, OR
Flood risk 1/10 · Minimal
- FEMA flood zone
- X (unshaded)
- Chance of flooding over 30 yrs
- 0.0%
- Est. flood insurance / yr
- $507 – $1,088
Fire risk 3/10 · Minor
- Est. fire insurance / yr
- $498 – $926
Heat risk 3/10 · Minor
- Hot days now (above 93°F)
- 7 days/yr
- Hot days in 30 yrs
- 15 days/yr
Wind risk 1/10 · Minimal
- Chance of severe wind over 30 yrs
- —
Air-quality risk 10/10 · Severe
- Unhealthy air days now
- 14 days/yr
- Unhealthy air days in 30 yrs
- 16 days/yr
Risk factors via First Street. Map © Google.
Why this score? — see what drove the D+ grade
The composite is a weighted blend of 9 inputs, each scored 0–100. Each bar is that input's sub-score; the figure is the points it added to the 100-point composite (weight × sub-score).
- Cash flow +15.0/30.0
- ARV discount +7.5/15.0
- 1% rule +5.0/10.0
- DSCR +5.0/10.0
- Livability +3.8/5.0
- Schools +3.2/10.0
- Rent growth +3.1/5.0
- Condition / age +2.5/5.0
- Appreciation +0.0/10.0
$45,000
🖨 Deal sheet (PDF) 📄 Offer letter ✓ Due diligence
Listing remarks MLS
NICE 3BD 2 BA FAMILY ROOM HOME IN 55+ PARK. BUILT IN HUTCH, GOOD FLOOR PLAN & STORAGE. 9X10 INSULATED SHED. POSSIBLE CONTRACT. MUST SELL!
Key facts
- Community pool
- Built 1977
- Listed 40 days
Property features AI
Finance
- Other: No land lease; Listing status: Active
- Financial info: Monthly lot rent: $1,370
- HOA & community: Community pool; Community recreation facilities; Community meeting room; Party room; Library; Shadowbrook park with community center; Senior community
Exterior
- Parking: Driveway; Parking pad; RV parking
- Security: Entry security feature
- Utilities: Community water; Community sewer; Electric fuel/power
- Home design: Manufactured home in park; Residential property, not attached; Updated/remodeled; Owner-occupied main level; Built in 1977; Facing information not provided
- Construction: Vinyl siding; Membrane roof; Skirting foundation
- Exterior features: Covered deck; Porch; Yard; Level lot; Paved road access
Interior
- Kitchen: Built-in oven; Cooktop; Range hood; Dishwasher; Stainless steel appliances
- Bedrooms: Primary bedroom (Main level); 2nd bedroom (Main level); 3rd bedroom (Main level)
- Flooring: Engineered hardwood
- Bathrooms: 2 full bathrooms; Primary bathroom includes bathtub with shower
- Heating & cooling: Forced air heating; Heat pump (heating and cooling); Central air conditioning
- Interior features: Engineered hardwood floors; Vinyl window frames; Accessible approach with ramp
- Laundry & utility: Electric hot water
Neighborhood map
What this means for you Summary
Snapshot
- This is a 3-bed/2.0-bath other listed at $45k.
Deal economics
- At list price, monthly cash flow is $2k ($19k/yr) — positive.
- The deal already cash-flows at list — no discount required.
- Meets the 1% rule at list price ($2k rent vs $45k).
- Recommended offer: $44k (3.0% below list) — sets the bar for market timing.
- Cap rate 49.1% vs local median 2.5% in Happy Valley — top-decile yield for the area; either an underpriced asset or a hidden risk that comps aren't pricing in. Stress-test before assuming the spread holds.
Location & tenants
- Location reads 76/100 on livability (#76 in OR, #3,386 nationally) — a middle-class / working-renter tenant base. Strengths: employment A+, housing A+, crime A; Watch: amenities F, cost of living F.
- North Clackamas SD 12 (suburban): math 29% / reading 43% proficiency, ranked #22 of 58 in OR (top 38%) — families likely to look elsewhere, expect single-tenant / working-renter base with shorter leases.
- Zoned schools: Whitcomb Elementary School (math 10% / reading 10%, grade F, #404 of 412 statewide, top 100%, 403 students, 71% FRL); Clackamas High School (math 52% / reading 67%, grade C+, #23 of 143 statewide, top 19%, 1,224 students, 27% FRL).
- Market conditions: Rents rising (+2.5%/yr); 120 active listings in the ZIP; 9 comparable units currently listed for rent nearby; rentals at typical pace (median 25d on market — plan ~3-4 weeks tenant-placement turnaround); solid renter incomes; 946 units permitted in Clackamas County in 2024 (188 in 5+ unit buildings).
- This rent runs 33% of the median local income ($87k/yr) — at the standard rent-burdened threshold; future hikes will face affordability resistance.
Forward outlook
- Local home prices are declining (-3.0%/yr); year-one equity from $311 of loan paydown is wiped out by about $1k of value loss. Plan a longer hold.
- Clackamas County population projected at +25% by 2050 — long-run rental-demand tailwind backs the buy-and-hold thesis.
- At projected returns (-3.0% appreciation + 2.5% rent growth), your $13k cash investment doubles in ~1 year — after that, you're playing with house money.
Negotiation context
- It's been on market 40 days — a 3% lower offer ($44k) is reasonable based on typical stale-listing flexibility.
- 2 sale attempts since 28y ago; this cycle's ask has dropped $19k (30%) from the opening price — seller is motivated, your offer sets the floor, not the list.
- Current owner paid $15k; list at $45k implies a 200% gain — meaningful room to come down on a strong offer.
Questions for the listing agent
- It's been on market 40 days. Have you received any prior offers? Is the seller open to a 3% concession, seller financing, or rate buy-down credit?
- Built in 1977 — when were the roof, HVAC, electrical panel, plumbing, and water heater last replaced?
- Is there a deadline driving the sale (1031 exchange, divorce, estate, relocation)? That informs how much negotiation room exists.
- Schools are A-rated — typically a magnet for longer-tenancy family renters. What's the average tenant stay here, and is there a school-zone premium baked into asking?
- The area grade is low — what's the realistic commute time and amenity access for the typical tenant pool here? Any planned neighborhood developments (good or bad) we should know about?
- What's the average days-on-market for RENTAL listings here right now (not sales)? A rising rental-DOM trend means longer vacancies and softer asking-rent achievability than the comps imply.
- What's the recent tenant-quality profile in this submarket — average credit score on applications, eviction rate, late-payment / NSF rate, and stable-employment percentage? A property-management company in the area should have these aggregated.
- How much new for-sale + rental construction is in the pipeline within 1–3 miles? Heavy new supply typically softens prices + rents 12–24 months out; constrained supply supports both.
Investment metrics
- 1% rule
- 5.33% ✓
- Cap rate
- 49.10%
- Cash-on-cash
- 152.89%
- DSCR
- 7.80
- GRM
- 1.6
CMA / ARV
- ARV (median comp)
- $102,500
- List price
- $45,000
- Delta
- -56.10%
- Verdict
- UNDERPRICED
- Comps
- 20 within 1.0 mi
Projected returns pro-forma
-3.0% appreciation · 2.48% rent growth · sell at horizon
- IRR
- —
- Equity multiple
- 8.44×
- Total profit
- $93,729
- Equity at exit
- $6,710
- IRR
- —
- Equity multiple
- 17.53×
- Total profit
- $208,301
- Equity at exit
- $3,891
Cash invested: $12,600 (down + closing). Projections, not guarantees.
Landlord ↔ Tenant lean methodology
- Overall (STATE)
- 28 Tenant-Leaning
- State Oregon
- 28 Tenant-Leaning · D+6
- County
- — inherits STATE
- City
- — inherits STATE
ZIP-level market 97015
- Rents YoY
- 2.5%
- Active inventory
- 120
- Price-to-rent
- 1.6×
Monthly cashflow live
- Estimated rent
- $2,400 high interval (Pro) →
- Mortgage (P&I)
- −$236
- Tax from tax record
- −$36 /mo · $431/yr
- Insurance
- −$19
- HOA
- −$0
- Vacancy / Maint / Mgmt
- −$504
- Net cashflow
- $1,605
Break-even live
Sensitivity live
| Price | -10% $1,631 | -5% $1,618 | +0% $1,605 | +5% $1,593 | +10% $1,580 |
|---|---|---|---|---|---|
| Rent | -10% $1,416 | -5% $1,511 | +0% $1,605 | +5% $1,700 | +10% $1,795 |
| Rate | -1.0pp $1,628 | -0.5pp $1,617 | base $1,605 | +0.5pp $1,594 | +1.0pp $1,582 |
UW: 25.0% down · 7.5% · 30yr · 1.5% tax · 5.0% vac · 8.0% maint · 8.0% mgmt
Financing live
Cash to close
- Down payment
- $11,250
- Closing costs
- $1,350
- Reserves months
- —
- Total cash needed
- —
Loan-product check · same deal, 3 products live
Conventional
25% down · 7.5% · 30yr
- Down + closing
- —
- Monthly P&I
- —
- Monthly cashflow
- —
- DSCR
- —
- Eligible?
- —
Personal DTI + credit; lowest rate.
DSCR
20% down · 8.5% · 30yr
- Down + closing
- —
- Monthly P&I
- —
- Monthly cashflow
- —
- DSCR
- —
- Eligible?
- —
No personal income docs; deal must DSCR.
Hard money
10% down · 12.0% · 12mo
- Down + closing
- —
- Monthly P&I
- —
- Monthly cashflow
- —
- DSCR
- —
- Eligible?
- —
Short-term bridge; refi at stabilization.
Rent comps 9 comps
| Address | Beds | Baths | Sqft | Rent | $/sqft | DOM | Units | Dist |
|---|---|---|---|---|---|---|---|---|
| 13300 SE Hubbard Rd Clackamas, OR | 3.0 | 1.0–2.0 | 818 | $2,290 | $2.80 | 2d | 6 | 0.32mi |
| 12301 SE Hubbard Rd Clackamas, OR | 2.0–3.0 | 1.0–2.0 | 936 | $2,063 | $2.20 | 11d | 4 | 0.73mi |
| 13898 SE Rogers Ln Clackamas, OR | 3.0 | 2.0 | 1488 | $2,599 | $1.75 | 44d | 1 | 0.84mi |
| 14439 SE Oregon Trail Dr Clackamas, OR | 3.0 | 2.0 | 1650 | $2,615 | $1.58 | 2d | 1 | 0.93mi |
| 14095 SE Summerfield Loop Happy Valley, OR | 3.0 | 2.5 | 1453 | $2,695 | $1.85 | 44d | 1 | 1.09mi |
| 14712 SE Misty Dr Happy Valley, OR | 2.0 | 1.0–2.0 | 955 | $1,988 | $2.08 | 2d | 13 | 1.19mi |
| 14154 SE Summerfield Loop Unit 14194 Happy Valley, OR | 3.0 | 2.5 | 1125 | $2,250 | $2.00 | 24d | 1 | 1.22mi |
| 14194 SE Summerfield Loop Happy Valley, OR | 3.0 | 2.5 | 1125 | $2,250 | $2.00 | 24d | 1 | 1.22mi |
| 13120 SE 128th Ave Happy Valley, OR | 3.0 | 2.5 | 1861 | $2,900 | $1.56 | 44d | 1 | 1.29mi |
Listing history 17 events
-
2026-06-17status $45,000 Pending 40 DOM
-
2026-06-16days on market $45,000 Active 40 DOM
-
2026-06-15days on market $45,000 Active 39 DOM
-
2026-06-13days on market $45,000 Active 37 DOM
-
2026-06-09days on market $45,000 Active 33 DOM
-
2026-06-08days on market $45,000 Active 32 DOM
-
2026-06-07days on market $45,000 Active 31 DOM
-
2026-06-05remarks 439-char remark
-
2026-06-05days on market $45,000 Active 28 DOM
-
2026-06-03days on market $45,000 Active 27 DOM
-
2026-06-02days on market $45,000 Active 26 DOM
-
2026-06-01days on market $45,000 Active 25 DOM
-
2026-05-31pricedays on market $45,000 Active 24 DOM
-
2026-05-12price $55,000 375-char remark
-
2026-05-07$64,000 Active 375-char remark
-
1999-04-26soldstatus $15,000 141-char remark
Show marketing remark (141 chars)
NICE 3BD 2 BA FAMILY ROOM HOME IN 55+ PARK. BUILT IN HUTCH, GOOD FLOOR PLAN & STORAGE. 9X10 INSULATED SHED. POSSIBLE CONTRACT. MUST SELL!
-
1998-11-13$29,995 141-char remark
Show marketing remark (141 chars)
NICE 3BD 2 BA FAMILY ROOM HOME IN 55+ PARK. BUILT IN HUTCH, GOOD FLOOR PLAN & STORAGE. 9X10 INSULATED SHED. POSSIBLE CONTRACT. MUST SELL!
ⓘ Source: listings_history table (triggers on properties + properties_extension) + one-shot
backfill from property_details.listing_events for pre-trigger history.
Tax reassessment forecast OR · Resets to sale price
- Current annual tax
- $431 · $36/mo
- Projected year-2 tax
- $436 · $36/mo
- Expected delta
- +$6/yr ($0/mo · 1.3%)
ⓘ Screening estimate from a state-policy table — verify with the county assessor before closing.
Climate risk First Street
- Flood 1/10 Low FEMA zone X (unshaded) · 0% chance over 30 yrs
- Wildfire 3/10 Moderate
- Heat 3/10 Moderate 7 d/yr ≥93°F today · 15 d/yr by 30 yrs out
- Wind 1/10 Low
- Air quality 10/10 Extreme 14 unhealthy d/yr today · 16 by 30 yrs out
Nearby sold comps map
Loading sold comps map…
Walkable amenities ~0.75 mi
Loading nearby amenities…
Taxation est. · year 1
- Rental income
- $28,800
- − Mortgage interest
- −$2,521
- − Property taxes
- −$431
- − Insurance
- −$225
- − Repairs & maintenance
- −$2,304
- − Management
- −$2,304
- − Depreciation
- −$1,309
- Taxable income
- $19,706
- Est. tax owed @ 24.0%
- −$4,730
- After-tax cash flow
- $14,535/yr
For passive investors: Depreciation is non-cash, so a rental often shows a tax loss while cash-flowing — sheltering income. Rental losses are passive: they offset passive income freely, and up to $25,000/yr can offset ordinary (W-2) income if you actively participate and your MAGI is under $100k (phasing out to $0 by $150k); unused losses carry forward. On sale, claimed depreciation is recaptured at up to 25%, and gains may owe capital-gains tax (a 1031 exchange can defer both). Figures are a year-1 estimate at your 24.0% rate — not tax advice; consult a CPA.
Schools (NCES district)
- District
- North Clackamas SD 12
- NCES district ID
- 4108830
- Math proficiency
- 29% ▼ -14.00%
- Reading proficiency
- 43% ▼ -13.00%
- Median HH income
- $60,217
- Composite
- 32.1/100
- National rank
- #5807
- State rank
- #22 of 58 in OR
Livability — Happy Valley
- Score
- 76/100
- State rank
- #76
- US rank
- #3386
Category grades
Schools grade is shown separately in the Schools card above.
Census & demographics
- County
- Clackamas County · 361,406 people
- City population
- 34,567
- Metro
- Portland-Vancouver-Hillsboro, OR-WA
- Population (ZIP)
- 24,433
- Household income
- $87,333
- Rent vs Own
- Severe rent burden
- 1166.0
Population outlook (Clackamas County) Hauer SSP2
- Today (2025)
- 458,456 people
- By 2030
- 485,185 · +5.8%
- By 2040
- 532,932 · +16.2%
- By 2050
- 574,445 · +25.3%
- By 2075
- 665,497 · +45.2%
- By 2100
- 697,488 · +52.1%
Race, ethnicity, and origin ACS 2023
- Neighborhood character
- Predominantly White (66%)
- Race & ethnicity
- White 66% Hispanic / Latino 15% Two or more races 12% Asian 11% Black 2%
- Hispanic origin (detail)
- Mexican 13%
- Common ancestry
- Italian 4% Scotch-Irish 4% Lithuanian 3%
- Foreign-born
- 15% · Canada, China, Vietnam
- Languages at home
- 74% English-only · Spanish 11% Chinese 5% Russian/Polish/Slavic 3%
Political lean MEDSL · Clackamas
- 2024 margin
- Lean D (+9.7) · D 53.4% · R 43.6% · Other 3.0%
- 2008→2024 swing
- -0.6pp no change · 2008: 10.4pp · 2024: 9.7pp
- All cycles
- 2024: D+9.7 2020: D+11.1 2016: D+6.1 2012: D+3.5 2008: D+10.4
Not yet ingested
- Civics
- —
Market trends
- HPI YoY
- ▼ -170.50%
- Current HPI
- 295.7295
- Rent YoY
- ▲ 2.48%
- Metro
- Portland-Vancouver-Hillsboro, OR-WA
- State GDP YoY
- ▲ 2.05%
- F500 in state
- 2
Industry mix (Fortune 500 HQ in OR)
| Industry | F500 HQs | Revenue |
|---|---|---|
| Consumer Goods | 1 | $51B |
|
||
Price history
+50.0% since first listed7 events — show timeline
- 2026-06-16 Pending — RMLS
- 2026-05-30 Price Changed $45,000 RMLS
- 2026-05-20 Price Changed $49,000 RMLS
- 2026-05-12 Price Changed $55,000 RMLS
- 2026-05-07 Listed $64,000 RMLS
- 1999-04-26 Sold (MLS) $15,000 RMLS
- 1998-11-13 Listed $29,995 RMLS
Property tax history
+60.8%/yrLatest (2024): $431 · -4.3% YoY. Source: county tax records.
Cash-flow waterfall
monthlySold comps — $/sqft
last 12 mo · ≤1 miLoading sold comps…