43532 Clinton St #305 · Indio, CA
Flood risk 1/10 · Minimal
- FEMA flood zone
- X (unshaded)
- Chance of flooding over 30 yrs
- 0.0%
- Est. flood insurance / yr
- $507 – $1,088
Fire risk 7/10 · Major
- Est. fire insurance / yr
- $659 – $1,223
Heat risk 10/10 · Severe
- Hot days now (above 114°F)
- 6 days/yr
- Hot days in 30 yrs
- 16 days/yr
Wind risk 1/10 · Minimal
- Chance of severe wind over 30 yrs
- —
Air-quality risk 3/10 · Minor
- Unhealthy air days now
- 3 days/yr
- Unhealthy air days in 30 yrs
- 5 days/yr
Risk factors via First Street. Map © Google.
Why this score? — see what drove the B- grade
The composite is a weighted blend of 9 inputs, each scored 0–100. Each bar is that input's sub-score; the figure is the points it added to the 100-point composite (weight × sub-score).
- Cash flow +30.0/30.0
- 1% rule +10.0/10.0
- DSCR +10.0/10.0
- ARV discount +7.4/15.0
- Schools +3.8/10.0
- Rent growth +3.3/5.0
- Livability +2.7/5.0
- Condition / age +2.5/5.0
- Appreciation +0.0/10.0
$90,000
🖨 Deal sheet (PDF) 📄 Offer letter ✓ Due diligence
Key facts
- Garage
- Built 1980
- Listed 93 days
Neighborhood map
What this means for you Summary
Snapshot
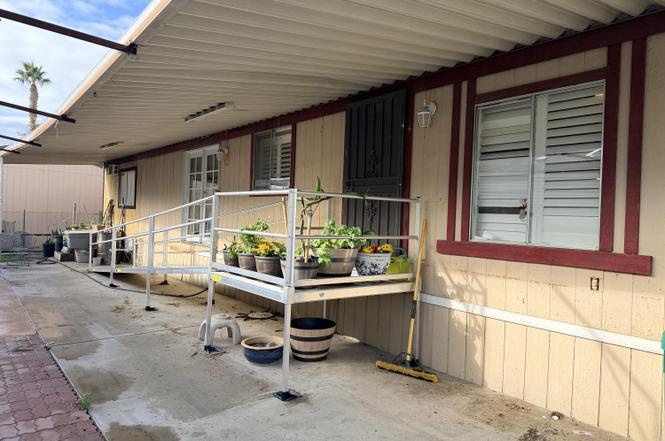
- This is a 2-bed/2.0-bath manufactured listed at $90k.
Deal economics
- At list price, monthly cash flow is $1k ($17k/yr) — positive.
- The deal already cash-flows at list — no discount required.
- Meets the 1% rule at list price ($3k rent vs $90k).
- Recommended offer: $82k (9.0% below list) — sets the bar for market timing.
- Cap rate 24.9% vs local median 4.3% in Indio — top-decile yield for the area; either an underpriced asset or a hidden risk that comps aren't pricing in. Stress-test before assuming the spread holds.
Location & tenants
- Location reads 53/100 on livability (#927 in CA) — a working-class tenant base; expect higher turnover. Strengths: housing B+; Watch: employment D, crime F, amenities F.
- Desert Sands Unified (suburban): math 31% / reading 56% proficiency, ranked #199 of 517 in CA (top 38%) — families likely to look elsewhere, expect single-tenant / working-renter base with shorter leases.
- Zoned schools: Carrillo Ranch Elementary (492 students, 81% FRL); Indio Middle (784 students, 89% FRL); Indio High (math 15% / reading 42%, grade F, #774 of 1,170 statewide, top 66%, 2,143 students, 92% FRL) — zoned schools average 87% FRL vs 56% district-wide (31 pts higher); higher-poverty schools than district average — tighter screening recommended.
- Zoned-school proficiency averages 28% at this address vs 44% district-wide (-15 pts) — the specific schools serving this property underperform the Desert Sands Unified average; the district grade overstates school quality for this exact location.
- Market conditions: Rents rising (+3.3%/yr); 515 active listings in the ZIP; 31 comparable units currently listed for rent nearby; rentals lingering (median 45d on market — plan ~5-8 weeks vacancy on turnover, expect pricing pressure); 55% of comp listings sitting > 30 days — soft ceiling on asking rent; 9,195 units permitted in Riverside County in 2024 (1,512 in 5+ unit buildings).
- At $2,557/mo this rent would consume 46% of the median local household income ($67k/yr) (locally 2036% of renters already pay >50% of income on rent) — very limited rent-growth headroom before tenants either downsize or default.
Forward outlook
- Local home prices are declining (-3.0%/yr); year-one equity from $622 of loan paydown is wiped out by about $3k of value loss. Plan a longer hold.
- Riverside County population projected at +22% by 2050 — long-run rental-demand tailwind backs the buy-and-hold thesis.
- At projected returns (-3.0% appreciation + 3.3% rent growth), your $25k cash investment doubles in ~2 years — after that, you're playing with house money.
Negotiation context
- It's been on market 93 days — a 9% lower offer ($82k) is reasonable based on typical stale-listing flexibility.
Risks & watch-outs
- Climate carrying-cost: major wildfire risk; extreme-heat days projected 6→16/yr by 2055 (HVAC capex compounding) — expect insurance premiums to compound above CPI over the hold.
Questions for the listing agent
- It's been on market 93 days. Have you received any prior offers? Is the seller open to a 9% concession, seller financing, or rate buy-down credit?
- Why hasn't it sold? Are there any deal-killer items the seller is aware of (foundation, flood, title, zoning, code violations)?
- Is there a deadline driving the sale (1031 exchange, divorce, estate, relocation)? That informs how much negotiation room exists.
- Schools are F-rated, which usually means shorter tenancies and higher turnover. Who's the typical renter profile here, and what's been the actual vacancy rate?
- Crime grade is F in this area — have there been break-ins, vandalism, or insurance claims at this property in the last 3 years? What carrier currently insures it and at what premium?
- What's the average days-on-market for RENTAL listings here right now (not sales)? A rising rental-DOM trend means longer vacancies and softer asking-rent achievability than the comps imply.
- What's the recent tenant-quality profile in this submarket — average credit score on applications, eviction rate, late-payment / NSF rate, and stable-employment percentage? A property-management company in the area should have these aggregated.
- How much new for-sale + rental construction is in the pipeline within 1–3 miles? Heavy new supply typically softens prices + rents 12–24 months out; constrained supply supports both.
Investment metrics
- 1% rule
- 2.84% ✓
- Cap rate
- 24.94%
- Cash-on-cash
- 66.59%
- DSCR
- 3.96
- GRM
- 2.9
CMA / ARV
- ARV (on-the-fly)
- $89,856
- Comps found
- 2
Show comp detail 2 sales within ~0.75 mi
| Address | Dist | Beds/Ba | Sqft | Sold | Price | $/sf | Match |
|---|---|---|---|---|---|---|---|
| 43532 Clinton St #305 | 0.00mi | 2/2.0 | 1,248 (0%) | 0mo | $85,000 | $68 | 100 |
| 43532 Clinton St #359 | 0.00mi | 2/2.0 | 1,248 (0%) | 15mo | $90,000 | $72 | 88 |
Match score weights: distance 35% · size 25% · config 20% · recency 20%. Top-matched comps best support the ARV.
Projected returns pro-forma
-3.0% appreciation · 3.34% rent growth · sell at horizon
- IRR
- 66.3%
- Equity multiple
- 3.99×
- Total profit
- $75,393
- Equity at exit
- $13,419
- IRR
- 70.6%
- Equity multiple
- 8.31×
- Total profit
- $184,115
- Equity at exit
- $7,782
Cash invested: $25,200 (down + closing). Projections, not guarantees.
Landlord ↔ Tenant lean methodology
- Overall (STATE)
- 18 Strongly Tenant-Friendly
- State California
- 18 Strongly Tenant-Friendly · D+13
- County
- — inherits STATE
- City
- — inherits STATE
ZIP-level market 92201
- Home prices YoY
- -28.4%
- Rents YoY
- 3.3%
- Active inventory
- 515
- Price-to-rent
- 2.9×
Monthly cashflow live
- Estimated rent
- $2,557 high interval (Pro) →
- Mortgage (P&I)
- −$472
- Tax est. 1.5%
- −$112 /mo · $1,350/yr
- Insurance
- −$38
- HOA
- −$0
- Vacancy / Maint / Mgmt
- −$537
- Net cashflow
- $1,398
Break-even live
Sensitivity live
| Price | -10% $1,461 | -5% $1,429 | +0% $1,398 | +5% $1,367 | +10% $1,336 |
|---|---|---|---|---|---|
| Rent | -10% $1,196 | -5% $1,297 | +0% $1,398 | +5% $1,499 | +10% $1,600 |
| Rate | -1.0pp $1,444 | -0.5pp $1,421 | base $1,398 | +0.5pp $1,375 | +1.0pp $1,351 |
UW: 25.0% down · 7.5% · 30yr · 1.5% tax · 5.0% vac · 8.0% maint · 8.0% mgmt
Financing live
Cash to close
- Down payment
- $22,500
- Closing costs
- $2,700
- Reserves months
- —
- Total cash needed
- —
Loan-product check · same deal, 3 products live
Conventional
25% down · 7.5% · 30yr
- Down + closing
- —
- Monthly P&I
- —
- Monthly cashflow
- —
- DSCR
- —
- Eligible?
- —
Personal DTI + credit; lowest rate.
DSCR
20% down · 8.5% · 30yr
- Down + closing
- —
- Monthly P&I
- —
- Monthly cashflow
- —
- DSCR
- —
- Eligible?
- —
No personal income docs; deal must DSCR.
Hard money
10% down · 12.0% · 12mo
- Down + closing
- —
- Monthly P&I
- —
- Monthly cashflow
- —
- DSCR
- —
- Eligible?
- —
Short-term bridge; refi at stabilization.
Rent comps 31 comps
| Address | Beds | Baths | Sqft | Rent | $/sqft | DOM | Units | Dist |
|---|---|---|---|---|---|---|---|---|
| 44313 Larrea St Indio, CA | 3.0 | 2.0 | 1219 | $2,400 | $1.97 | 25d | 1 | 0.33mi |
| 81351 Fred Waring Dr Apt 218 Indio, CA | 2.0 | 1.0 | 946 | $1,595 | $1.69 | 45d | 1 | 0.44mi |
| 81351 Fred Waring Dr Unit 215 Indio, CA | 2.0 | 1.0 | 946 | $1,595 | $1.69 | 14d | 1 | 0.44mi |
| 81955 Hoover Ave Indio, CA | 1.0–2.0 | 1.0–2.0 | 799 | $1,895 | $2.37 | 45d | 1 | 0.49mi |
| 81153 Francis Ave Indio, CA | 3.0 | 2.0 | 1288 | $2,800 | $2.17 | 6d | 1 | 0.82mi |
| 45546 Aladdin St Unit D201 Indio, CA | 2.0 | 1.0 | 907 | $1,549 | $1.71 | 45d | 1 | 0.96mi |
| 44900 Rubidoux St Indio, CA | 3.0 | 2.0 | 1158 | $2,295 | $1.98 | 6d | 1 | 0.98mi |
| 81682 Avenida Celaya Indio, CA | 2.0 | 2.0 | 1099 | $2,800 | $2.55 | 25d | 1 | 0.99mi |
| 82481 Valencia Ave Indio, CA | 2.0 | 1.0 | 900 | $1,750 | $1.94 | 45d | 1 | 0.99mi |
| 81683 De Plata Ave Indio, CA | 3.0 | 2.0 | 1216 | $3,100 | $2.55 | 20d | 1 | 1.03mi |
| 81656 Avenida de Baile Indio, CA | 2.0 | 2.0 | 1488 | $4,300 | $2.89 | 45d | 1 | 1.03mi |
| 81272 Palmwood Dr Indio, CA | 3.0 | 2.0 | 1104 | $3,200 | $2.90 | 45d | 1 | 1.05mi |
| 81720 Avenue Indio, CA | 2.0 | 2.0 | 1080 | $1,795 | $1.66 | 45d | 1 | 1.10mi |
| 81673 Avenida Alturas Indio, CA | 2.0 | 2.0 | 1432 | $2,700 | $1.89 | 45d | 1 | 1.11mi |
| 81840 Avenida del Mar Unit A203 Indio, CA | 2.0 | 2.0 | 874 | $1,750 | $2.00 | 25d | 1 | 1.11mi |
| 81710 Avenida Parito Indio, CA | 2.0 | 2.0 | 1488 | $2,700 | $1.81 | 16d | 1 | 1.18mi |
| 81720 Avenida Parito Indio, CA | 2.0 | 2.0 | 1257 | $2,600 | $2.07 | 45d | 1 | 1.19mi |
| 80589 Hoylake Dr Indio, CA | 2.0 | 2.0 | 1420 | $2,500 | $1.76 | 20d | 1 | 1.24mi |
| 43696 Old Troon Ct Indio, CA | 2.0 | 2.0 | 1382 | $4,500 | $3.26 | 45d | 1 | 1.26mi |
| 81579 Avenida Contento Indio, CA | 2.0 | 2.0 | 1257 | $4,600 | $3.66 | 45d | 1 | 1.27mi |
| 41085 Calle Pampas Indio, CA | 2.0 | 2.0 | 1488 | $2,700 | $1.81 | 45d | 1 | 1.29mi |
| 82435 Requa Ave Apt 01 Indio, CA | 2.0 | 1.5 | 769 | $1,595 | $2.07 | 45d | 1 | 1.31mi |
| 41562 Via Arleta Indio, CA | 2.0 | 2.0 | 1276 | $2,800 | $2.19 | 25d | 1 | 1.38mi |
| 41544 Via Arleta Indio, CA | 2.0 | 2.0 | 1374 | $2,500 | $1.82 | 25d | 1 | 1.39mi |
| 80208 Royal Birkdale Dr Indio, CA | 2.0 | 2.0 | 1382 | $3,875 | $2.80 | 25d | 1 | 1.40mi |
| 41444 Via Arleta Indio, CA | 2.0 | 2.0 | 1374 | $2,500 | $1.82 | 25d | 1 | 1.41mi |
| 80675 Harvard Ct Indio, CA | 3.0 | 2.0 | 1248 | $2,495 | $2.00 | 12d | 1 | 1.42mi |
| 81916 Avenida del Toro Indio, CA | 2.0 | 2.0 | 1257 | $2,600 | $2.07 | 45d | 1 | 1.44mi |
| 40799 Calle Los Osos Indio, CA | 2.0 | 2.0 | 1257 | $3,900 | $3.10 | 45d | 1 | 1.46mi |
| 40759 Calle Guapo Indio, CA | 2.0 | 2.0 | 1488 | $4,500 | $3.02 | 45d | 1 | 1.47mi |
| 40751 Calle Los Osos Indio, CA | 2.0 | 2.0 | 1257 | $2,500 | $1.99 | 45d | 1 | 1.48mi |
Listing history 3 events
-
2026-04-09status Pending
-
2026-02-24price $90,000
-
2026-01-02$95,000 Active
ⓘ Source: listings_history table (triggers on properties + properties_extension) + one-shot
backfill from property_details.listing_events for pre-trigger history.
Climate risk First Street
- Flood 1/10 Low FEMA zone X (unshaded) · 0% chance over 30 yrs
- Wildfire 7/10 Severe
- Heat 10/10 Extreme 6 d/yr ≥114°F today · 16 d/yr by 30 yrs out
- Wind 1/10 Low
- Air quality 3/10 Moderate 3 unhealthy d/yr today · 5 by 30 yrs out
Nearby sold comps map
Loading sold comps map…
Walkable amenities ~0.75 mi
Loading nearby amenities…
Taxation est. · year 1
- Rental income
- $30,688
- − Mortgage interest
- −$5,041
- − Property taxes
- −$1,350
- − Insurance
- −$450
- − Repairs & maintenance
- −$2,455
- − Management
- −$2,455
- − Depreciation
- −$2,618
- Taxable income
- $16,319
- Est. tax owed @ 24.0%
- −$3,916
- After-tax cash flow
- $12,864/yr
For passive investors: Depreciation is non-cash, so a rental often shows a tax loss while cash-flowing — sheltering income. Rental losses are passive: they offset passive income freely, and up to $25,000/yr can offset ordinary (W-2) income if you actively participate and your MAGI is under $100k (phasing out to $0 by $150k); unused losses carry forward. On sale, claimed depreciation is recaptured at up to 25%, and gains may owe capital-gains tax (a 1031 exchange can defer both). Figures are a year-1 estimate at your 24.0% rate — not tax advice; consult a CPA.
Schools (NCES district)
- District
- Desert Sands Unified
- NCES district ID
- 0611110
- Math proficiency
- 31% ▼ -4.00%
- Reading proficiency
- 56% ▲ 7.00%
- Median HH income
- $54,957
- Composite
- 37.77/100
- National rank
- #4346
- State rank
- #199 of 517 in CA
Livability — Indio
- Score
- 53/100
- State rank
- #927
- US rank
- #24244
Category grades
Schools grade is shown separately in the Schools card above.
Census & demographics
- Census place
- Indio, CA
- County
- Riverside County · 2,287,001 people
- City population
- 100,560
- Metro
- Riverside-San Bernardino-Ontario, CA
- Population (ZIP)
- 65,825
- Household income
- $66,758
- Rent vs Own
- Severe rent burden
- 2036.0
Population outlook (Riverside County) Hauer SSP2
- Today (2025)
- 2,664,475 people
- By 2030
- 2,802,692 · +5.2%
- By 2040
- 3,050,904 · +14.5%
- By 2050
- 3,256,783 · +22.2%
- By 2075
- 3,655,058 · +37.2%
- By 2100
- 3,766,594 · +41.4%
Race, ethnicity, and origin ACS 2023
- Neighborhood character
- Predominantly Hispanic (74%)
- Race & ethnicity
- Hispanic / Latino 74% Two or more races 39% White 19% Black 3% Asian 3% Native American 1%
- Hispanic origin (detail)
- Mexican 69%
- Common ancestry
- Romanian 1% Iranian 1%
- Foreign-born
- 29% · Canada, Vietnam, Jamaica
- Languages at home
- 41% English-only · Spanish 55% Arabic 1% Tagalog/Filipino 1%
Political lean MEDSL · Riverside
- 2024 margin
- Toss-up / Even · D 48.0% · R 49.3% · Other 2.6%
- 2008→2024 swing
- -3.6pp toward R · 2008: 2.3pp · 2024: -1.3pp
- All cycles
- 2024: R+1.3 2020: D+8.0 2016: D+4.3 2012: R+0.4 2008: D+2.3
Not yet ingested
- Civics
- —
Market trends
- HPI YoY
- ▼ -138.46%
- Current HPI
- 348.6605
- Rent YoY
- ▲ 3.34%
- Metro
- Riverside-San Bernardino-Ontario, CA
- State GDP YoY
- ▲ 3.21%
- F500 in state
- 116
Industry mix (Fortune 500 HQ in CA)
| Industry | F500 HQs | Revenue |
|---|---|---|
| Technology | 27 | $1,492B |
|
||
| Financial Services | 3 | $174B |
|
||
| Retail | 3 | $44B |
|
||
| Insurance | 3 | $26B |
|
||
| Media / Entertainment | 2 | $115B |
|
||
| Pharmaceuticals / Biotech | 2 | $62B |
|
||
Price history
-5.3% since first listed3 events — show timeline
- 2026-04-09 Pending — GPSMLS
- 2026-02-24 Price Changed $90,000 GPSMLS
- 2026-01-02 Listed $95,000 GPSMLS
Cash-flow waterfall
monthlySold comps — $/sqft
last 12 mo · ≤1 miLoading sold comps…