 Duplex
155 Lake Vista Cv · Rockwell, AR
Flood risk No data
- FEMA flood zone
- —
- Chance of flooding over 30 yrs
- —
- Est. flood insurance / yr
- —
Fire risk No data
- Est. fire insurance / yr
- —
Heat risk No data
- Hot days now (above threshold)
- —
- Hot days in 30 yrs
- —
Wind risk No data
- Chance of severe wind over 30 yrs
- —
Air-quality risk No data
- Unhealthy air days now
- —
- Unhealthy air days in 30 yrs
- —
Risk factors via First Street. Map © Google.
Why this score? — see what drove the D+ grade
The composite is a weighted blend of 9 inputs, each scored 0–100. Each bar is that input's sub-score; the figure is the points it added to the 100-point composite (weight × sub-score).
- Cash flow +18.0/30.0
- ARV discount +7.5/15.0
- DSCR +5.6/10.0
- Rent growth +4.1/5.0
- 1% rule +3.8/10.0
- Schools +3.6/10.0
- Livability +3.4/5.0
- Condition / age +2.2/5.0
- Appreciation +0.0/10.0
$299,999
🖨 Deal sheet 📄 Offer letter ✓ Due diligence
Multi-family units
County records classify this as Multi-Family (2-4 Unit). Listing-text estimate: 2 units. confirmed
Listing remarks
Investment opportunity in Hot Springs! This duplex features two separate units, offering flexibility for a variety of uses. Unit A includes 2 bedrooms and 1 bathroom, while Unit B offers 3 bedrooms and 2 bathrooms. The property provides the potential for rental income, owner occupancy with an additional rental unit, or expansion of an investment portfolio. Conveniently located near shopping, dining, recreation, and other area amenities. Whether you're an experienced investor or exploring your next real estate opportunity, this property offers versatility and income-producing potential. More photos coming soon.
Key facts
- Near dining
- Two separate units
- Near recreation
Tags
Property features AI
Finance
- Other: Approximate lot size 0.17 acres
- Financial info: Financing options include Cash, FHA, Conventional, and VA; Investor-oriented property: 2 units (see unit counts and bathroom/bedroom breakdown)
Exterior
- Parking: Parking pads
- Utilities: Municipal electric; Public sewer; Public water
- Home design: Multifamily building (2 units)
- Construction: Composition roof; Other foundation (see remarks)
- Exterior features: Composition exterior; Other exterior features (see remarks); Paved road access; Sloped lot
Interior
- Kitchen: Kitchen equipment: other (see remarks)
- Bedrooms: One 3-bedroom unit; One 2-bedroom unit
- Flooring: Other flooring (see remarks)
- Bathrooms: Two units with 3 bathrooms; One unit with 2 bathrooms
- Heating & cooling: Central electric cooling; Central electric heating
- Interior features: Other interior features (see remarks); Other flooring (see remarks)
Neighborhood map
What this means for you Summary
Snapshot
- This is a 1×2bd/1.0ba + 1×3bd/2.0ba units multifamily listed at $300k. Condition is rated fair.
Deal economics
- At list price, monthly cash flow is $256 ($3k/yr) — positive. Per door: $128/mo.
- The deal already cash-flows at list — no discount required.
- To meet the 1% rule (rent ≥ 1% of price), the offer needs to be $264k (12.0% below list).
- Recommended offer: $264k (12.0% below list) — sets the bar for 1% rule.
- Cap rate 7.3% vs local median 1.4% in Rockwell — top-decile yield for the area; either an underpriced asset or a hidden risk that comps aren't pricing in. Stress-test before assuming the spread holds.
Location & tenants
- Location reads 68/100 on livability (#81 in AR) — a middle-class / working-renter tenant base. Strengths: crime A+, cost of living A+, housing A+; Watch: employment C-, schools D-, amenities F.
- Lake Hamilton School District (rural): math 41% / reading 43% proficiency, ranked #54 of 238 in AR (top 23%) — families likely to look elsewhere, expect single-tenant / working-renter base with shorter leases.
- Market conditions: Rents rising fast (+6.4%/yr); 986 active listings in the ZIP; 2 comparable units currently listed for rent nearby; 117 units permitted in Garland County in 2024 (24 in 5+ unit buildings).
- At $2,640/mo this rent would consume 57% of the median local household income ($56k/yr) (locally 1442% of renters already pay >50% of income on rent) — very limited rent-growth headroom before tenants either downsize or default.
Forward outlook
- Local home prices are declining (-3.0%/yr); year-one equity from $2k of loan paydown is wiped out by about $9k of value loss. Plan a longer hold.
- Garland County population projected at +7% by 2050 — modest demand growth; plan on rents tracking national, not racing it.
Negotiation context
- Only 10 days on market — expect competitive offers; lowballing is unlikely to land.
Questions for the listing agent
- Can we see the unit-by-unit rent roll, current vacancy, and any below-market leases? What's the average tenancy length?
- What capital expenditures (roof, boiler, parking lot, exteriors) have been made in the last 5 years, and what's planned in the next 2?
- Have any recent inspections been done? Can we get a copy of the seller's disclosures and any deferred-maintenance estimates?
- Is there a deadline driving the sale (1031 exchange, divorce, estate, relocation)? That informs how much negotiation room exists.
- Schools are D-rated, which usually means shorter tenancies and higher turnover. Who's the typical renter profile here, and what's been the actual vacancy rate?
- The area grade is low — what's the realistic commute time and amenity access for the typical tenant pool here? Any planned neighborhood developments (good or bad) we should know about?
- What's the average days-on-market for RENTAL listings here right now (not sales)? A rising rental-DOM trend means longer vacancies and softer asking-rent achievability than the comps imply.
- What's the recent tenant-quality profile in this submarket — average credit score on applications, eviction rate, late-payment / NSF rate, and stable-employment percentage? A property-management company in the area should have these aggregated.
- How much new apartment / multifamily construction is in the pipeline within 1–3 miles? Heavy new supply (>2% of stock underway) typically softens rents 12–24 months out; light construction supports rent growth.
Investment metrics
- 1% rule
- 0.88% ✗
- Cap rate
- 7.32%
- Cash-on-cash
- 3.65%
- DSCR
- 1.16
- GRM
- 9.5
CMA / ARV
No comps found within radius.
Projected returns pro-forma
-3.0% appreciation · 6.43% rent growth · sell at horizon
- IRR
- -7.2%
- Equity multiple
- 0.73×
- Total profit
- $-23,022
- Equity at exit
- $44,731
- IRR
- 5.9%
- Equity multiple
- 1.50×
- Total profit
- $41,967
- Equity at exit
- $25,938
Cash invested: $84,000 (down + closing). Projections, not guarantees.
Landlord ↔ Tenant lean methodology
- Overall (STATE)
- 92 Strongly Landlord-Friendly
- State Arkansas
- 92 Strongly Landlord-Friendly · R+14
- County
- — inherits STATE
- City
- — inherits STATE
ZIP-level market 71913
- Home prices YoY
- -33.9%
- Rents YoY
- 6.4%
- Active inventory
- 986
- Price-to-rent
- 19.6×
Monthly cashflow live
- Estimated rent
- $2,640 medium interval (Pro) →
- Mortgage (P&I)
- −$1,573
- Tax from tax record
- −$132 /mo · $1,582/yr
- Insurance
- −$125
- HOA
- −$0
- Vacancy / Maint / Mgmt
- −$554
- Net cashflow
- $256
Break-even live
2-unit breakdown (identical units grouped — click to expand)
| Units | Beds | Baths | Est. rent |
|---|---|---|---|
| 1× unit | 2 | 1 | $1,277 |
| 1× unit | 3 | 2 | $1,363 |
| Total (2 units) | $2,640 | ||
UW: 25.0% down · 7.5% · 30yr · 1.5% tax · 5.0% vac · 8.0% maint · 8.0% mgmt
Financing live
Cash to close
- Down payment
- $75,000
- Closing costs
- $9,000
- Reserves months
- —
- Total cash needed
- —
Loan-product check · same deal, 3 products live
Conventional
25% down · 7.5% · 30yr
- Down + closing
- —
- Monthly P&I
- —
- Monthly cashflow
- —
- DSCR
- —
- Eligible?
- —
Personal DTI + credit; lowest rate.
DSCR
20% down · 8.5% · 30yr
- Down + closing
- —
- Monthly P&I
- —
- Monthly cashflow
- —
- DSCR
- —
- Eligible?
- —
No personal income docs; deal must DSCR.
Hard money
10% down · 12.0% · 12mo
- Down + closing
- —
- Monthly P&I
- —
- Monthly cashflow
- —
- DSCR
- —
- Eligible?
- —
Short-term bridge; refi at stabilization.
Rent comps 2 comps
| Address | Beds | Baths | Sqft | Rent | $/sqft | DOM | Units | Dist |
|---|---|---|---|---|---|---|---|---|
| 113 Shadow Peak Ln Unit B Hot Springs National Park, AR | 3.0 | 2.5 | 1649 | $1,700 | $1.03 | 44d | 1 | 1.15mi |
| 106A Shadow Peak Ln Unit A Hot Springs National Park, AR | 3.0 | 2.5 | 1666 | $1,700 | $1.02 | 44d | 1 | 1.21mi |
Listing history 9 events
-
2026-06-19days on market $299,999 Active 10 DOM
-
2026-06-18days on market $299,999 Active 9 DOM
-
2026-06-17days on market $299,999 Active 8 DOM
-
2026-06-16statusdays on market $299,999 Active 7 DOM
-
2026-06-15days on market $299,999 New Listing 6 DOM
-
2026-06-14days on market $299,999 New Listing 4 DOM
-
2026-06-13days on market $299,999 New Listing 3 DOM
-
2026-06-10remarks 617-char remark
-
2026-06-10$299,999 New Listing 1 DOM
ⓘ Source: listings_history table (triggers on properties + properties_extension) + one-shot
backfill from property_details.listing_events for pre-trigger history.
Tax reassessment forecast AR · Resets to sale price
- Current annual tax
- $1,582 · $132/mo
- Projected year-2 tax
- $1,920 · $160/mo
- Expected delta
- +$338/yr (+$28/mo · 21.4%)
ⓘ Screening estimate from a state-policy table — verify with the county assessor before closing.
Nearby sold comps map
Loading sold comps map…
Walkable amenities ~0.75 mi
Loading nearby amenities…
Taxation est. · year 1
- Rental income
- $31,680
- − Mortgage interest
- −$16,805
- − Property taxes
- −$1,582
- − Insurance
- −$1,500
- − Repairs & maintenance
- −$2,534
- − Management
- −$2,534
- − Depreciation
- −$8,727
- Taxable loss
- −$2,002
- Est. tax savings @ 24.0%
- +$481
- After-tax cash flow
- $3,547/yr
For passive investors: Depreciation is non-cash, so a rental often shows a tax loss while cash-flowing — sheltering income. Rental losses are passive: they offset passive income freely, and up to $25,000/yr can offset ordinary (W-2) income if you actively participate and your MAGI is under $100k (phasing out to $0 by $150k); unused losses carry forward. On sale, claimed depreciation is recaptured at up to 25%, and gains may owe capital-gains tax (a 1031 exchange can defer both). Figures are a year-1 estimate at your 24.0% rate — not tax advice; consult a CPA.
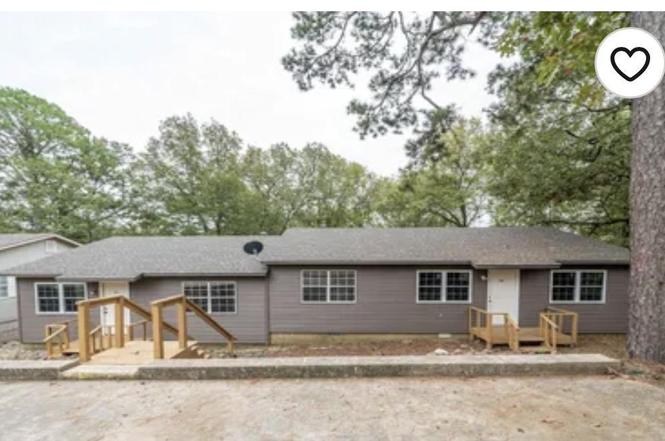
Condition & rehab AI · 1 photo
This multi-family property requires moderate repairs and landscaping to improve its curb appeal and structural integrity, enhancing both resale and rental value.
Repairs flagged
- Major Exposed concrete foundation — Needs stabilization and landscaping
- Major Uneven ground — Needs leveling and landscaping
Value-add opportunities
- Both Landscaping and foundation repair — Enhances curb appeal and structural integrity
- Both Interior updates — Improves living space and rental appeal
Renovation cost estimate screening
| Repair item | Severity | Est. cost |
|---|---|---|
| Exposed concrete foundation · Needs stabilization and landscaping | Major | $15,000–50,000 |
| Uneven ground · Needs leveling and landscaping | Major | $15,000–50,000 |
| Total estimated repair cost · 2 items | $30,000–100,000 |
Value-add ROI direction
- Both Landscaping and foundation repair — Enhances curb appeal and structural integrity ↑
- Both Interior updates — Improves living space and rental appeal ↑
ⓘ Cost ranges are severity-bucket heuristics (US national rule-of-thumb). Get contractor quotes + a written scope before underwriting a rehab budget.
Schools (NCES district)
- District
- Lake Hamilton School District
- NCES district ID
- 0508610
- Math proficiency
- 41% ▼ -15.00%
- Reading proficiency
- 43% ▼ -7.00%
- Median HH income
- $46,223
- Composite
- 35.79/100
- National rank
- #4834
- State rank
- #54 of 238 in AR
Livability — Rockwell
- Score
- 68/100
- State rank
- #81
- US rank
- #9175
Category grades
Schools grade is shown separately in the Schools card above.
Census & demographics
- County
- Garland County · 76,414 people
- Metro
- Hot Springs, AR
- Population (ZIP)
- 47,477
- Household income
- $56,010
- Rent vs Own
- Severe rent burden
- 1442.0
Population outlook (Garland County) Hauer SSP2
- Today (2025)
- 100,343 people
- By 2030
- 101,880 · +1.5%
- By 2040
- 104,804 · +4.4%
- By 2050
- 107,292 · +6.9%
- By 2075
- 113,182 · +12.8%
- By 2100
- 112,247 · +11.9%
Race, ethnicity, and origin ACS 2023
- Neighborhood character
- Predominantly White (79%)
- Race & ethnicity
- White 79% Hispanic / Latino 8% Black 8% Two or more races 6% Asian 1%
- Hispanic origin (detail)
- Mexican 6%
- Common ancestry
- Italian 3% Lithuanian 2% Slovak 2%
- Foreign-born
- 5% · Canada
- Languages at home
- 91% English-only · Spanish 7% Other Indo-European 1%
Political lean MEDSL · Garland
- 2024 margin
- Solid R (+36.2) · D 30.8% · R 67.0% · Other 2.2%
- 2008→2024 swing
- -11.3pp toward R · 2008: -25.0pp · 2024: -36.2pp
- All cycles
- 2024: R+36.2 2020: R+34.0 2016: R+34.1 2012: R+29.9 2008: R+25.0
Not yet ingested
- Civics
- —
Market trends
- HPI YoY
- ▼ -137.67%
- Current HPI
- 268.5228
- Rent YoY
- ▲ 6.43%
- Metro
- Hot Springs, AR
- State GDP YoY
- ▲ 3.80%
- F500 in state
- 10
Industry mix (Fortune 500 HQ in AR)
| Industry | F500 HQs | Revenue |
|---|---|---|
| Retail | 1 | $681B |
|
||
| Food / Agriculture | 1 | $53B |
|
||
| Retail / Energy | 1 | $22B |
|
||
| Transportation / Logistics | 1 | $12B |
|
||
| Energy | 1 | $4B |
|
||
Price history
-9.1% since first listed3 events — show timeline
- 2026-05-13 Listed $299,999 CARMLS
- 2026-04-24 Price Changed $310,000 HSBOR
- 2026-04-02 Price Changed $330,000 HSBOR
Property tax history
-1.2%/yrLatest (2025): $1,582 · -1.2% YoY. Source: county tax records.
Cash-flow waterfall
monthlySold comps — $/sqft
last 12 mo · ≤1 miLoading sold comps…