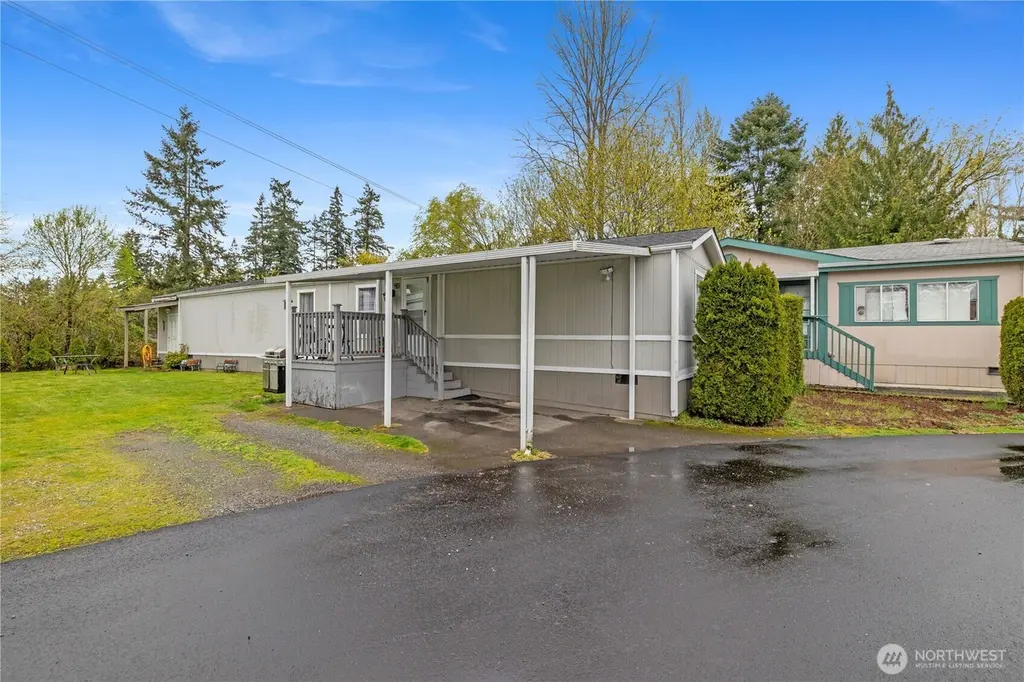
9810 State Ave #16 · Marysville, WA
Flood risk No data
- FEMA flood zone
- —
- Chance of flooding over 30 yrs
- —
- Est. flood insurance / yr
- —
Fire risk No data
- Est. fire insurance / yr
- —
Heat risk No data
- Hot days now (above threshold)
- —
- Hot days in 30 yrs
- —
Wind risk No data
- Chance of severe wind over 30 yrs
- —
Air-quality risk No data
- Unhealthy air days now
- —
- Unhealthy air days in 30 yrs
- —
Risk factors via First Street. Map © Google.
Why this score? — see what drove the B+ grade
The composite is a weighted blend of 9 inputs, each scored 0–100. Each bar is that input's sub-score; the figure is the points it added to the 100-point composite (weight × sub-score).
- Cash flow +30.0/30.0
- ARV discount +15.0/15.0
- 1% rule +10.0/10.0
- DSCR +10.0/10.0
- Livability +4.2/5.0
- Schools +4.1/10.0
- Rent growth +2.9/5.0
- Condition / age +2.5/5.0
- Appreciation +0.0/10.0
$90,000
🖨 Deal sheet 📄 Offer letter ✓ Due diligence
Listing remarks
Enjoy comfortable, affordable living in this well-kept 1998 manufactured home featuring a spacious layout and a generous yard in a park with no age restrictions. The home offers two large bedrooms, a bright kitchen with a breakfast bar and dedicated eating space, and great natural flow throughout. A storage shed in the backyard provides extra room for tools, hobbies, or seasonal items. Space rent includes water, sewer, and garbage, adding convenience and value. Park approval required.
Key facts
- Bright kitchen
- Generous yard
- Storage shed
Tags
Neighborhood map
What this means for you Summary
Snapshot
- This is a 2-bed/2.0-bath manufactured listed at $90k.
Deal economics
- At list price, monthly cash flow is $1k ($14k/yr) — positive.
- The deal already cash-flows at list — no discount required.
- Meets the 1% rule at list price ($2k rent vs $90k).
- Recommended offer: $89k (1.5% below list) — sets the bar for market timing.
- Cap rate 21.9% vs local median 3.0% in Marysville — top-decile yield for the area; either an underpriced asset or a hidden risk that comps aren't pricing in. Stress-test before assuming the spread holds.
Location & tenants
- Location reads 84/100 on livability (#43 in WA, #768 nationally) — a professional / high-income tenant draw. Strengths: commute A+, employment A+, housing A+; Watch: cost of living F.
- Marysville School District (suburban): math 36% / reading 51% proficiency, ranked #177 of 291 in WA (top 61%) — families likely to look elsewhere, expect single-tenant / working-renter base with shorter leases.
- Market conditions: Rents rising (+1.7%/yr); 430 active listings in the ZIP; 11 comparable units currently listed for rent nearby; rentals at typical pace (median 24d on market — plan ~3-4 weeks tenant-placement turnaround); solid renter incomes; 3,982 units permitted in Snohomish County in 2024 (1,492 in 5+ unit buildings).
Forward outlook
- Local home prices are declining (-3.0%/yr); year-one equity from $622 of loan paydown is wiped out by about $3k of value loss. Plan a longer hold.
- Snohomish County population projected at +30% by 2050 — long-run rental-demand tailwind backs the buy-and-hold thesis.
- At projected returns (-3.0% appreciation + 1.7% rent growth), your $25k cash investment doubles in ~3 years — after that, you're playing with house money.
Negotiation context
- It's been on market 28 days — a 2% lower offer ($89k) is reasonable based on typical stale-listing flexibility.
- 3 sale attempts since 18y ago with the ask held roughly flat each time — persistent listings suggest the price (not the market) is what's stuck; bring a comps-based counter.
- Current owner paid $15k; list at $90k implies a 500% gain — meaningful room to come down on a strong offer.
Questions for the listing agent
- Is there a deadline driving the sale (1031 exchange, divorce, estate, relocation)? That informs how much negotiation room exists.
- Schools are B-rated — typically a magnet for longer-tenancy family renters. What's the average tenant stay here, and is there a school-zone premium baked into asking?
- What's the average days-on-market for RENTAL listings here right now (not sales)? A rising rental-DOM trend means longer vacancies and softer asking-rent achievability than the comps imply.
- What's the recent tenant-quality profile in this submarket — average credit score on applications, eviction rate, late-payment / NSF rate, and stable-employment percentage? A property-management company in the area should have these aggregated.
- How much new for-sale + rental construction is in the pipeline within 1–3 miles? Heavy new supply typically softens prices + rents 12–24 months out; constrained supply supports both.
Investment metrics
- 1% rule
- 2.38% ✓
- Cap rate
- 21.86%
- Cash-on-cash
- 55.61%
- DSCR
- 3.47
- GRM
- 3.5
CMA / ARV
- ARV (median comp)
- $130,530
- List price
- $90,000
- Delta
- -31.05%
- Verdict
- UNDERPRICED
- Comps
- 7 within 1.0 mi
Projected returns pro-forma
-3.0% appreciation · 1.66% rent growth · sell at horizon
- IRR
- 52.5%
- Equity multiple
- 3.26×
- Total profit
- $56,913
- Equity at exit
- $13,419
- IRR
- 57.2%
- Equity multiple
- 6.31×
- Total profit
- $133,824
- Equity at exit
- $7,782
Cash invested: $25,200 (down + closing). Projections, not guarantees.
Landlord ↔ Tenant lean methodology
- Overall (STATE)
- 28 Tenant-Leaning
- State Washington
- 28 Tenant-Leaning · D+8
- County
- — inherits STATE
- City
- — inherits STATE
ZIP-level market 98270
- Rents YoY
- 1.7%
- Active inventory
- 430
- Price-to-rent
- 3.5×
Monthly cashflow live
- Estimated rent
- $2,145 high interval (Pro) →
- Mortgage (P&I)
- −$472
- Tax from tax record
- −$17 /mo · $208/yr
- Insurance
- −$38
- HOA
- −$0
- Vacancy / Maint / Mgmt
- −$450
- Net cashflow
- $1,168
Break-even live
UW: 25.0% down · 7.5% · 30yr · 1.5% tax · 5.0% vac · 8.0% maint · 8.0% mgmt
Financing live
Cash to close
- Down payment
- $22,500
- Closing costs
- $2,700
- Reserves months
- —
- Total cash needed
- —
Loan-product check · same deal, 3 products live
Conventional
25% down · 7.5% · 30yr
- Down + closing
- —
- Monthly P&I
- —
- Monthly cashflow
- —
- DSCR
- —
- Eligible?
- —
Personal DTI + credit; lowest rate.
DSCR
20% down · 8.5% · 30yr
- Down + closing
- —
- Monthly P&I
- —
- Monthly cashflow
- —
- DSCR
- —
- Eligible?
- —
No personal income docs; deal must DSCR.
Hard money
10% down · 12.0% · 12mo
- Down + closing
- —
- Monthly P&I
- —
- Monthly cashflow
- —
- DSCR
- —
- Eligible?
- —
Short-term bridge; refi at stabilization.
Rent comps 11 comps
| Address | Beds | Baths | Sqft | Rent | $/sqft | DOM | Units | Dist |
|---|---|---|---|---|---|---|---|---|
| 9114 44th Dr NE #1 Marysville, WA | 2.0 | 1.0 | 1006 | $2,095 | $2.08 | 24d | 1 | 0.47mi |
| 10021 54th Dr NE Marysville, WA | 2.0 | 1.5 | 922 | $1,200 | $1.30 | 4d | 1 | 0.74mi |
| 11508 51st Ave NE Unit C Marysville, WA | 3.0 | 2.0 | 1100 | $2,595 | $2.36 | 43d | 1 | 1.08mi |
| 5828 93rd Pl NE Marysville, WA | 3.0 | 1.0 | 912 | $2,000 | $2.19 | 24d | 1 | 1.11mi |
| 4521 80th St NE Marysville, WA | 1.0–2.0 | 1.0–1.5 | 881 | $2,150 | $2.44 | 4d | 3 | 1.11mi |
| 4602 80th St NE Marysville, WA | 1.0–2.0 | 1.0–2.0 | 777 | $1,975 | $2.54 | 4d | 3 | 1.22mi |
| 12115 State Ave Marysville, WA | 1.0–3.0 | 1.0–2.0 | 881 | $2,106 | $2.39 | 4d | 1 | 1.31mi |
| 4817 76th St NE Marysville, WA | 2.0 | 1.5 | 995 | $1,895 | $1.90 | 43d | 1 | 1.37mi |
| 1345 Beach Ave Unit B Marysville, WA | 3.0 | 2.5 | 1125 | $2,100 | $1.87 | 43d | 1 | 1.38mi |
| 1310 Cedar Ave Marysville, WA | 1.0–2.0 | 1.0 | 778 | $2,055 | $2.64 | 43d | 7 | 1.43mi |
| 4000 76th St NE #42 Marysville, WA | 2.0 | 1.0 | 540 | $1,850 | $3.43 | 4d | 1 | 1.45mi |
Listing history 10 events
-
2026-05-14status Pending
-
2026-04-15$90,000 Active
-
2009-10-19soldstatus $15,000 Sold
-
2009-09-28status Pending
-
2009-09-15status Pending Inspection
-
2009-09-12price $17,000
-
2009-08-24$19,000 Active
-
2008-07-10soldstatus $21,000
-
2008-07-01historical
-
2008-06-12$24,000
ⓘ Source: listings_history table (triggers on properties + properties_extension) + one-shot
backfill from property_details.listing_events for pre-trigger history.
Tax reassessment forecast WA · Resets to sale price
- Current annual tax
- $208 · $17/mo
- Projected year-2 tax
- $882 · $74/mo
- Expected delta
- +$674/yr (+$56/mo · 323.8%)
ⓘ Screening estimate from a state-policy table — verify with the county assessor before closing.
Nearby sold comps map
Loading sold comps map…
Walkable amenities ~0.75 mi
Loading nearby amenities…
Taxation est. · year 1
- Rental income
- $25,741
- − Mortgage interest
- −$5,041
- − Property taxes
- −$208
- − Insurance
- −$450
- − Repairs & maintenance
- −$2,059
- − Management
- −$2,059
- − Depreciation
- −$2,618
- Taxable income
- $13,305
- Est. tax owed @ 24.0%
- −$3,193
- After-tax cash flow
- $10,820/yr
For passive investors: Depreciation is non-cash, so a rental often shows a tax loss while cash-flowing — sheltering income. Rental losses are passive: they offset passive income freely, and up to $25,000/yr can offset ordinary (W-2) income if you actively participate and your MAGI is under $100k (phasing out to $0 by $150k); unused losses carry forward. On sale, claimed depreciation is recaptured at up to 25%, and gains may owe capital-gains tax (a 1031 exchange can defer both). Figures are a year-1 estimate at your 24.0% rate — not tax advice; consult a CPA.
Schools (NCES district)
- District
- Marysville School District
- NCES district ID
- 5304860
- Math proficiency
- 36% ▼ -1.00%
- Reading proficiency
- 51% ▲ 2.00%
- Median HH income
- $67,461
- Composite
- 41.31/100
- National rank
- #7367
- State rank
- #177 of 291 in WA
Livability — Marysville
- Score
- 84/100
- State rank
- #43
- US rank
- #768
Category grades
Schools grade is shown separately in the Schools card above.
Census & demographics
- Census place
- Marysville, WA
- County
- Snohomish County · 786,756 people
- City population
- 85,887
- Metro
- Seattle-Tacoma-Bellevue, WA
- Population (ZIP)
- 55,049
- Household income
- $108,147
- Rent vs Own
- Severe rent burden
- 1150.0
Population outlook (Snohomish County) Hauer SSP2
- Today (2025)
- 899,800 people
- By 2030
- 960,975 · +6.8%
- By 2040
- 1,074,447 · +19.4%
- By 2050
- 1,171,954 · +30.2%
- By 2075
- 1,384,849 · +53.9%
- By 2100
- 1,497,296 · +66.4%
Race, ethnicity, and origin ACS 2023
- Neighborhood character
- Diverse neighborhood (Simpson 0.55)
- Race & ethnicity
- White 64% Hispanic / Latino 17% Two or more races 14% Asian 8% Black 3% Native American 2%
- Hispanic origin (detail)
- Mexican 13%
- Common ancestry
- Portuguese 5% Italian 3% Lithuanian 2%
- Foreign-born
- 14% · Canada, China, Vietnam
- Languages at home
- 79% English-only · Spanish 9% Russian/Polish/Slavic 4% Tagalog/Filipino 2%
Political lean MEDSL · Snohomish
- 2024 margin
- D (+19.0) · D 57.8% · R 38.9% · Other 3.3%
- 2008→2024 swing
- +0.1pp no change · 2008: 18.9pp · 2024: 19.0pp
- All cycles
- 2024: D+19.0 2020: D+20.6 2016: D+16.6 2012: D+16.2 2008: D+18.9
Not yet ingested
- Civics
- —
Market trends
- HPI YoY
- ▼ -673.52%
- Current HPI
- 321.1535
- Rent YoY
- ▲ 1.66%
- Metro
- Seattle-Tacoma-Bellevue, WA
- State GDP YoY
- ▲ 4.65%
- F500 in state
- 22
Industry mix (Fortune 500 HQ in WA)
| Industry | F500 HQs | Revenue |
|---|---|---|
| Retail | 2 | $269B |
|
||
| Technology / Retail | 1 | $638B |
|
||
| Technology | 1 | $245B |
|
||
| Telecommunications | 1 | $38B |
|
||
| Food / Beverage | 1 | $36B |
|
||
| Automotive / Trucks | 1 | $34B |
|
||
Price history
+275.0% since first listed10 events — show timeline
- 2026-05-14 Pending — NWMLS as Distributed by MLS Grid
- 2026-04-15 Listed $90,000 NWMLS as Distributed by MLS Grid
- 2009-10-19 Sold (MLS) $15,000 NWMLS as Distributed by MLS Grid
- 2009-09-28 Pending — NWMLS as Distributed by MLS Grid
- 2009-09-15 Pending — NWMLS as Distributed by MLS Grid
- 2009-09-12 Price Changed $17,000 NWMLS as Distributed by MLS Grid
- 2009-08-24 Listed $19,000 NWMLS as Distributed by MLS Grid
- 2008-07-10 Sold (MLS) $21,000 NWMLS as Distributed by MLS Grid
- 2008-07-01 Delisted — NWMLS as Distributed by MLS Grid
- 2008-06-12 Listed $24,000 NWMLS as Distributed by MLS Grid
Property tax history
+8.4%/yrLatest (2026): $208 · +3.1% YoY. Source: county tax records.
Cash-flow waterfall
monthlySold comps — $/sqft
last 12 mo · ≤1 miLoading sold comps…