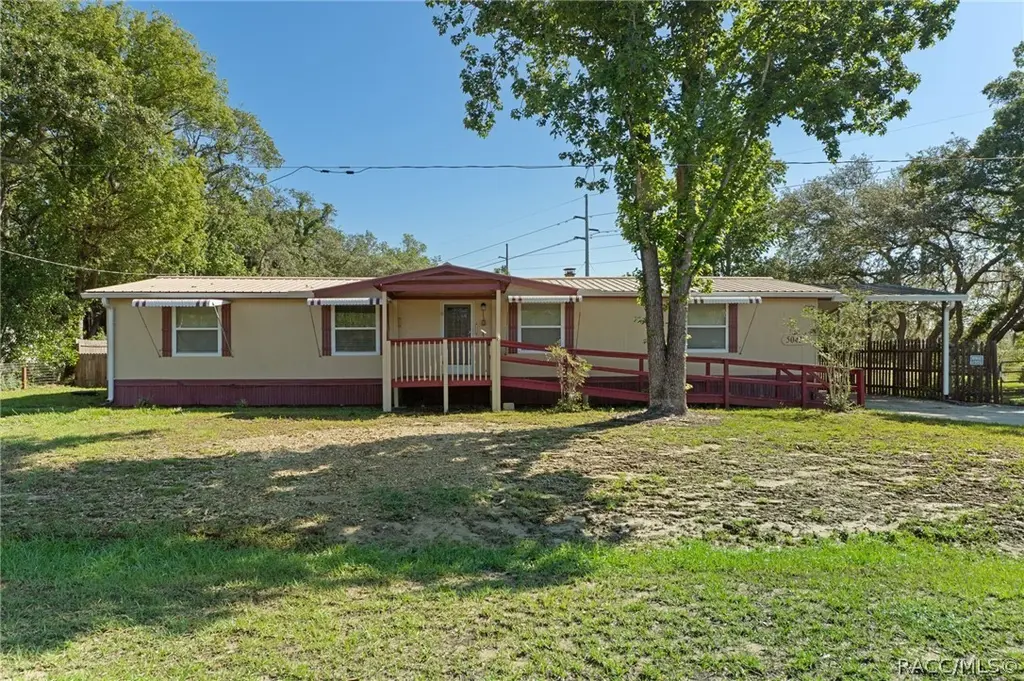
5041 W Rolling View Pl · Homosassa Springs, FL
Flood risk 1/10 · Minimal
- FEMA flood zone
- X (unshaded)
- Chance of flooding over 30 yrs
- 0.0%
- Est. flood insurance / yr
- $507 – $1,088
Fire risk 6/10 · Moderate
- Est. fire insurance / yr
- $947 – $1,759
Heat risk 9/10 · Severe
- Hot days now (above 108°F)
- 7 days/yr
- Hot days in 30 yrs
- 24 days/yr
Wind risk 9/10 · Severe
- Chance of severe wind over 30 yrs
- 99.0%
Air-quality risk 1/10 · Minimal
- Unhealthy air days now
- 0 days/yr
- Unhealthy air days in 30 yrs
- 0 days/yr
Risk factors via First Street. Map © Google.
Why this score? — see what drove the B- grade
The composite is a weighted blend of 9 inputs, each scored 0–100. Each bar is that input's sub-score; the figure is the points it added to the 100-point composite (weight × sub-score).
- Cash flow +30.0/30.0
- DSCR +10.0/10.0
- 1% rule +8.2/10.0
- ARV discount +7.3/15.0
- Schools +4.1/10.0
- Livability +3.6/5.0
- Rent growth +2.5/5.0
- Condition / age +2.5/5.0
- Appreciation +0.0/10.0
$165,000
🖨 Deal sheet (PDF) 📄 Offer letter ✓ Due diligence
Listing remarks
Situated on nearly one acre in a peaceful Lecanto location, this well-maintained 3-bedroom, 2-bath residence offers 1,784 square feet of comfortable living space with a functional and open layout. Built in 1985, the home features a welcoming fireplace, new A/C in 2023, metal roof in 2013, covered carport parking, and multiple outbuildings great for storage, a workshop, or hobby space. The expansive lot provides exceptional privacy and ample room for outdoor living, gardening, RV or boat parking, or future enhancements. This location delivers a desirable rural atmosphere while remaining convenient to shopping, dining, medical facilities, and major roadways, making it an excellent opportunity
Key facts
- Metal roof
- New a/c
- Welcoming fireplace
Tags
Property features AI
Exterior
- Parking: 2 parking spaces total; 1-car garage; Attached carport; Detached parking options; Driveway; Concrete surfaces
- Utilities: Private well water; Septic tank sewer
- Home design: Manufactured double-wide home; Single-level (one story); Residential property in Cinnamon Ridge subdivision
- Construction: Metal roof
- Exterior features: Level lot; Paved road access; No pool
Interior
- Kitchen: Gas oven and gas range; Microwave; Refrigerator; Dishwasher not listed
- Flooring: Carpet; Laminate
- Bathrooms: 2 full bathrooms
- Heating & cooling: Propane heating; Central air conditioning
- Interior features: Gas fireplace; Gas oven and gas range; Microwave; Refrigerator; Water heater
- Laundry & utility: Washer and dryer included
Neighborhood map
What this means for you Summary
Snapshot
- This is a 3-bed/2.0-bath manufactured listed at $165k.
Deal economics
- At list price, monthly cash flow is $739 ($9k/yr) — positive.
- The deal already cash-flows at list — no discount required.
- Meets the 1% rule at list price ($2k rent vs $165k).
- Cap rate 11.7% vs local median 5.9% in Homosassa Springs — top-decile yield for the area; either an underpriced asset or a hidden risk that comps aren't pricing in. Stress-test before assuming the spread holds.
Location & tenants
- Location reads 71/100 on livability (#391 in FL) — a middle-class / working-renter tenant base. Strengths: cost of living A+, housing A+, health & safety A+; Watch: crime C-, amenities F, commute F.
- Citrus (rural): math 49% / reading 50% proficiency, ranked #44 of 73 in FL (top 60%) — families likely to look elsewhere, expect single-tenant / working-renter base with shorter leases.
- Zoned schools: Rock Crusher Elementary School (math 70% / reading 56%, grade B, #582 of 2,144 statewide, top 28%, 665 students, 68% FRL); Crystal River Middle School (math 49% / reading 47%, grade C-, #286 of 571 statewide, top 50%, 900 students, 64% FRL); Crystal River High School (math 31% / reading 44%, grade F, #336 of 667 statewide, top 51%, 1,249 students, 56% FRL).
- Market conditions: 199 active listings in the ZIP; 3 comparable units currently listed for rent nearby; rentals at typical pace (median 23d on market — plan ~3-4 weeks tenant-placement turnaround); 2,443 units permitted in Citrus County in 2024 (0 in 5+ unit buildings).
- This rent runs 41% of the median local income ($63k/yr) — at the standard rent-burdened threshold; future hikes will face affordability resistance.
Forward outlook
- Local home prices are declining (-3.0%/yr); year-one equity from $1k of loan paydown is wiped out by about $5k of value loss. Plan a longer hold.
- Citrus County population projected to shrink 10% by 2050 — rents likely to lag national; underwrite the cash flow, not the appreciation.
- At projected returns (-3.0% appreciation + 3.0% rent growth), your $46k cash investment doubles in ~7 years — after that, you're playing with house money.
Negotiation context
- Only 5 days on market — expect competitive offers; lowballing is unlikely to land.
- Current owner paid $53k; list at $165k implies a 211% gain — meaningful room to come down on a strong offer.
Risks & watch-outs
- Climate carrying-cost: severe wind risk, 99% chance of damaging wind over 30y; major wildfire risk; extreme-heat days projected 7→24/yr by 2055 (HVAC capex compounding) — expect insurance premiums to compound above CPI over the hold.
Questions for the listing agent
- Is there a deadline driving the sale (1031 exchange, divorce, estate, relocation)? That informs how much negotiation room exists.
- Schools are F-rated, which usually means shorter tenancies and higher turnover. Who's the typical renter profile here, and what's been the actual vacancy rate?
- What's the average days-on-market for RENTAL listings here right now (not sales)? A rising rental-DOM trend means longer vacancies and softer asking-rent achievability than the comps imply.
- What's the recent tenant-quality profile in this submarket — average credit score on applications, eviction rate, late-payment / NSF rate, and stable-employment percentage? A property-management company in the area should have these aggregated.
- How much new for-sale + rental construction is in the pipeline within 1–3 miles? Heavy new supply typically softens prices + rents 12–24 months out; constrained supply supports both.
Investment metrics
- 1% rule
- 1.32% ✓
- Cap rate
- 11.67%
- Cash-on-cash
- 19.19%
- DSCR
- 1.85
- GRM
- 6.3
CMA / ARV
- ARV (on-the-fly)
- $164,128
- Comps found
- 3
Show comp detail 3 sales within ~0.75 mi
| Address | Dist | Beds/Ba | Sqft | Sold | Price | $/sf | Match |
|---|---|---|---|---|---|---|---|
| 5041 W Rolling View Pl | 0.00mi | 3/2.0 | 1,784 (0%) | 0mo | $165,000 | $92 | 100 |
| 5042 W Southern St | 0.07mi | 4/2.0 (+1) | 1,890 (+6%) | 7mo | $135,000 | $71 | 76 |
| 5246 W Shaker Pl | 0.23mi | 3/2.0 | 1,568 (-12%) | 14mo | $249,000 | $159 | 58 |
Match score weights: distance 35% · size 25% · config 20% · recency 20%. Top-matched comps best support the ARV.
Projected returns pro-forma
-3.0% appreciation · 3.0% rent growth · sell at horizon
- IRR
- 11.1%
- Equity multiple
- 1.44×
- Total profit
- $20,262
- Equity at exit
- $24,602
- IRR
- 20.1%
- Equity multiple
- 2.69×
- Total profit
- $77,980
- Equity at exit
- $14,266
Cash invested: $46,200 (down + closing). Projections, not guarantees.
Landlord ↔ Tenant lean methodology
- Overall (STATE)
- 87 Strongly Landlord-Friendly
- State Florida
- 87 Strongly Landlord-Friendly · R+3
- County
- — inherits STATE
- City
- — inherits STATE
ZIP-level market 34461
- Home prices YoY
- -10.2%
- Active inventory
- 199
- Price-to-rent
- 6.3×
Monthly cashflow live
- Estimated rent
- $2,176 medium interval (Pro) →
- Mortgage (P&I)
- −$865
- Tax from tax record
- −$46 /mo · $552/yr
- Insurance
- −$69
- HOA
- −$0
- Vacancy / Maint / Mgmt
- −$457
- Net cashflow
- $739
Break-even live
Sensitivity live
| Price | -10% $832 | -5% $786 | +0% $739 | +5% $692 | +10% $646 |
|---|---|---|---|---|---|
| Rent | -10% $567 | -5% $653 | +0% $739 | +5% $825 | +10% $911 |
| Rate | -1.0pp $822 | -0.5pp $781 | base $739 | +0.5pp $696 | +1.0pp $653 |
UW: 25.0% down · 7.5% · 30yr · 1.5% tax · 5.0% vac · 8.0% maint · 8.0% mgmt
Financing live
Cash to close
- Down payment
- $41,250
- Closing costs
- $4,950
- Reserves months
- —
- Total cash needed
- —
Loan-product check · same deal, 3 products live
Conventional
25% down · 7.5% · 30yr
- Down + closing
- —
- Monthly P&I
- —
- Monthly cashflow
- —
- DSCR
- —
- Eligible?
- —
Personal DTI + credit; lowest rate.
DSCR
20% down · 8.5% · 30yr
- Down + closing
- —
- Monthly P&I
- —
- Monthly cashflow
- —
- DSCR
- —
- Eligible?
- —
No personal income docs; deal must DSCR.
Hard money
10% down · 12.0% · 12mo
- Down + closing
- —
- Monthly P&I
- —
- Monthly cashflow
- —
- DSCR
- —
- Eligible?
- —
Short-term bridge; refi at stabilization.
Rent comps 3 comps
| Address | Beds | Baths | Sqft | Rent | $/sqft | DOM | Units | Dist |
|---|---|---|---|---|---|---|---|---|
| 31 N Pizarro Pt Lecanto, FL | 2.0 | 2.0 | 2011 | $2,395 | $1.19 | 23d | 1 | 0.49mi |
| 5085 W Kristina Loop Lecanto, FL | 2.0 | 2.0 | 1227 | $1,800 | $1.47 | 23d | 1 | 0.57mi |
| 271 N Lombardy Pt Lecanto, FL | 2.0 | 2.0 | 1809 | $1,500 | $0.83 | 23d | 1 | 0.75mi |
Listing history 4 events
-
2026-05-24status Pending
-
2026-05-19$165,000 Active
-
2004-02-19soldstatus $53,000
-
2002-09-23soldstatus $50,000
ⓘ Source: listings_history table (triggers on properties + properties_extension) + one-shot
backfill from property_details.listing_events for pre-trigger history.
Tax reassessment forecast FL · Resets to sale price
- Current annual tax
- $552 · $46/mo
- Projected year-2 tax
- $1,370 · $114/mo
- Expected delta
- +$817/yr (+$68/mo · 147.9%)
ⓘ Screening estimate from a state-policy table — verify with the county assessor before closing.
Climate risk First Street
- Flood 1/10 Low FEMA zone X (unshaded) · 0% chance over 30 yrs
- Wildfire 6/10 Major
- Heat 9/10 Extreme 7 d/yr ≥108°F today · 24 d/yr by 30 yrs out
- Wind 9/10 Extreme 99% chance of damaging wind over 30 yrs
- Air quality 1/10 Low 0 unhealthy d/yr today · 0 by 30 yrs out
Nearby sold comps map
Loading sold comps map…
Walkable amenities ~0.75 mi
Loading nearby amenities…
Taxation est. · year 1
- Rental income
- $26,112
- − Mortgage interest
- −$9,243
- − Property taxes
- −$552
- − Insurance
- −$825
- − Repairs & maintenance
- −$2,089
- − Management
- −$2,089
- − Depreciation
- −$4,800
- Taxable income
- $6,514
- Est. tax owed @ 24.0%
- −$1,563
- After-tax cash flow
- $7,304/yr
For passive investors: Depreciation is non-cash, so a rental often shows a tax loss while cash-flowing — sheltering income. Rental losses are passive: they offset passive income freely, and up to $25,000/yr can offset ordinary (W-2) income if you actively participate and your MAGI is under $100k (phasing out to $0 by $150k); unused losses carry forward. On sale, claimed depreciation is recaptured at up to 25%, and gains may owe capital-gains tax (a 1031 exchange can defer both). Figures are a year-1 estimate at your 24.0% rate — not tax advice; consult a CPA.
Schools (NCES district)
- District
- Citrus
- NCES district ID
- 1200270
- Math proficiency
- 49% ▼ -10.00%
- Reading proficiency
- 50% ▼ -6.00%
- Median HH income
- $38,618
- Composite
- 41.28/100
- National rank
- #3519
- State rank
- #44 of 73 in FL
Livability — Homosassa Springs
- Score
- 71/100
- State rank
- #391
- US rank
- #6877
Category grades
Schools grade is shown separately in the Schools card above.
Census & demographics
- Census place
- Homosassa Springs, FL
- County
- Citrus County · 111,314 people
- Metro
- Homosassa Springs, FL
- Population (ZIP)
- 13,377
- Household income
- $63,418
- Rent vs Own
- Severe rent burden
- 41.0
Population outlook (Citrus County) Hauer SSP2
- Today (2025)
- 138,622 people
- By 2030
- 136,886 · -1.3%
- By 2040
- 132,009 · -4.8%
- By 2050
- 125,196 · -9.7%
- By 2075
- 108,570 · -21.7%
- By 2100
- 84,454 · -39.1%
Race, ethnicity, and origin ACS 2023
- Neighborhood character
- Predominantly White (87%)
- Race & ethnicity
- White 87% Hispanic / Latino 8% Two or more races 7% Black 2%
- Hispanic origin (detail)
- Puerto Rican 3%
- Common ancestry
- Romanian 3% Lithuanian 3% Slovak 3%
- Foreign-born
- 8% · Canada, Jamaica
- Languages at home
- 95% English-only · Spanish 3%
Political lean MEDSL · Citrus
- 2024 margin
- Solid R (+45.9) · D 26.8% · R 72.6%
- 2008→2024 swing
- -29.8pp toward R · 2008: -16.1pp · 2024: -45.9pp
- All cycles
- 2024: R+45.9 2020: R+41.0 2016: R+39.7 2012: R+21.9 2008: R+16.1
Not yet ingested
- Civics
- —
Market trends
- HPI YoY
- ▼ -29.48%
- Current HPI
- 258.0866
- Rent YoY
- —
- Metro
- Homosassa Springs, FL
- State GDP YoY
- ▲ 3.28%
- F500 in state
- 36
Industry mix (Fortune 500 HQ in FL)
| Industry | F500 HQs | Revenue |
|---|---|---|
| Industrial Technology | 2 | $29B |
|
||
| Insurance | 2 | $17B |
|
||
| Retail | 1 | $60B |
|
||
| Technology Distribution | 1 | $58B |
|
||
| Homebuilding | 1 | $35B |
|
||
| Technology Manufacturing | 1 | $35B |
|
||
Price history
+230.0% since first listed4 events — show timeline
- 2026-05-24 Pending — RACC
- 2026-05-19 Listed $165,000 RACC
- 2004-02-19 Sold (Public Records) $53,000 Public Records
- 2002-09-23 Sold (Public Records) $50,000 Public Records
Property tax history
+7.0%/yrLatest (2025): $552 · +13.3% YoY. Source: county tax records.
Cash-flow waterfall
monthlySold comps — $/sqft
last 12 mo · ≤1 miLoading sold comps…