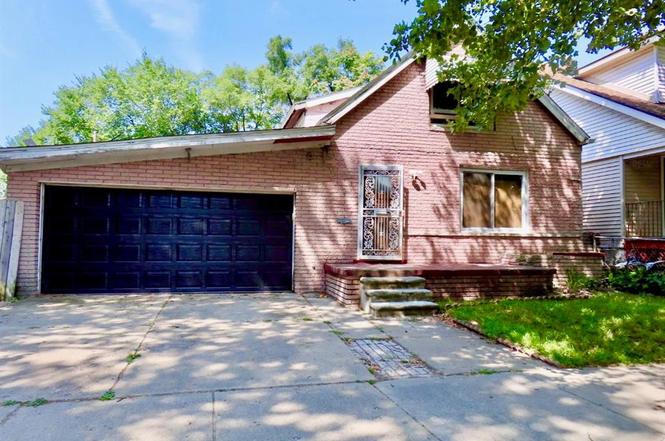
17405 Greeley St · Detroit, MI
Flood risk 1/10 · Minimal
- FEMA flood zone
- X (unshaded)
- Chance of flooding over 30 yrs
- 0.0%
- Est. flood insurance / yr
- $473 – $860
Fire risk 1/10 · Minimal
- Est. fire insurance / yr
- $784 – $1,456
Heat risk 2/10 · Minimal
- Hot days now (above 97°F)
- 6 days/yr
- Hot days in 30 yrs
- 13 days/yr
Wind risk 2/10 · Minimal
- Chance of severe wind over 30 yrs
- —
Air-quality risk 4/10 · Minor
- Unhealthy air days now
- 4 days/yr
- Unhealthy air days in 30 yrs
- 6 days/yr
Risk factors via First Street. Map © Google.
Why this score? — see what drove the B grade
The composite is a weighted blend of 9 inputs, each scored 0–100. Each bar is that input's sub-score; the figure is the points it added to the 100-point composite (weight × sub-score).
- Cash flow +30.0/30.0
- ARV discount +15.0/15.0
- 1% rule +10.0/10.0
- DSCR +10.0/10.0
- Livability +3.7/5.0
- Rent growth +2.5/5.0
- Condition / age +2.5/5.0
- Schools +1.3/10.0
- Appreciation +0.0/10.0
$45,000
🖨 Deal sheet (PDF) 📄 Offer letter ✓ Due diligence
Listing remarks MLS
Charming 3-Bedroom Home with Great Potential!Listed at $45,000, this 3-bedroom, 1.5-bath home offers both investors and first-time buyers an incredible opportunity. Features include an attached garage with a brand-new garage door, a new detached garage in the back, and a recently installed security system. Major updates have already been completed: new windows, doors, furnace, electric panel, and garage doors. The roof was repaired just 2 years ago, giving you peace of mind. With solid bones and modern upgrades already in place, this property is a perfect blank canvas ready for your personal touch.
Key facts
- 3,920 sq ft lot
- 2 garage spots
- Built 1918
Neighborhood map
What this means for you Summary
Snapshot
- This is a 3-bed/1.0-bath single-family listed at $45k.
Deal economics
- At list price, monthly cash flow is $731 ($9k/yr) — positive.
- The deal already cash-flows at list — no discount required.
- Meets the 1% rule at list price ($1k rent vs $45k).
- Cap rate 25.8% vs local median 10.2% in Detroit — top-decile yield for the area; either an underpriced asset or a hidden risk that comps aren't pricing in. Stress-test before assuming the spread holds.
Location & tenants
- Location reads 73/100 on livability (#218 in MI) — a middle-class / working-renter tenant base. Strengths: amenities A+, commute A+, cost of living A+; Watch: schools F, crime F, employment F.
- Detroit Public Schools Community District (urban): math 10% / reading 24% proficiency, ranked #499 of 540 in MI (top 92%) — low school quality limits family demand, transient renter base, plan for 1-2y turnover; 90% free/reduced lunch — lower-income household profile, screen leases tightly.
- Market conditions: 216 active listings in the ZIP; 20 comparable units currently listed for rent nearby; rentals at typical pace (median 25d on market — plan ~3-4 weeks tenant-placement turnaround); lower-income renter base — watch delinquency; 2,639 units permitted in Wayne County in 2024 (1,216 in 5+ unit buildings).
- This rent runs 42% of the median local income ($38k/yr) — at the standard rent-burdened threshold; future hikes will face affordability resistance.
Forward outlook
- Local home prices are declining (-3.0%/yr); year-one equity from $311 of loan paydown is wiped out by about $1k of value loss. Plan a longer hold.
- Wayne County population projected at -17% by 2050 — secular population decline; favor cash flow + early exit over multi-decade hold.
- At projected returns (-3.0% appreciation + 3.0% rent growth), your $13k cash investment doubles in ~2 years — after that, you're playing with house money.
Negotiation context
- Only 0 days on market — expect competitive offers; lowballing is unlikely to land.
- 8 sale attempts since 7y ago with the ask held roughly flat each time — persistent listings suggest the price (not the market) is what's stuck; bring a comps-based counter.
- Current owner paid $7k; list at $45k implies a 543% gain — meaningful room to come down on a strong offer.
Risks & watch-outs
- Watch-outs: built in 1918 — expect roof / HVAC / electrical / plumbing capex.
Questions for the listing agent
- Built in 1918 — when were the roof, HVAC, electrical panel, plumbing, and water heater last replaced?
- Is there a deadline driving the sale (1031 exchange, divorce, estate, relocation)? That informs how much negotiation room exists.
- Schools are F-rated, which usually means shorter tenancies and higher turnover. Who's the typical renter profile here, and what's been the actual vacancy rate?
- Crime grade is F in this area — have there been break-ins, vandalism, or insurance claims at this property in the last 3 years? What carrier currently insures it and at what premium?
- What's the average days-on-market for RENTAL listings here right now (not sales)? A rising rental-DOM trend means longer vacancies and softer asking-rent achievability than the comps imply.
- What's the recent tenant-quality profile in this submarket — average credit score on applications, eviction rate, late-payment / NSF rate, and stable-employment percentage? A property-management company in the area should have these aggregated.
- How much new for-sale + rental construction is in the pipeline within 1–3 miles? Heavy new supply typically softens prices + rents 12–24 months out; constrained supply supports both.
Investment metrics
- 1% rule
- 2.98% ✓
- Cap rate
- 25.78%
- Cash-on-cash
- 69.60%
- DSCR
- 4.10
- GRM
- 2.8
CMA / ARV
- ARV (on-the-fly)
- $74,550
- Comps found
- 12
Show comp detail 12 sales within ~0.75 mi
| Address | Dist | Beds/Ba | Sqft | Sold | Price | $/sf | Match |
|---|---|---|---|---|---|---|---|
| 17803 Saint Aubin St | 0.33mi | 4/2.0 (+1) | 1,518 (+2%) | 6mo | $50,001 | $33 | 68 |
| 18615 Orleans St | 0.58mi | 3/1.5 | 1,516 (+2%) | 3mo | $86,500 | $57 | 66 |
| 17496 Saint Aubin St | 0.33mi | 4/1.5 (+1) | 1,377 (-8%) | 5mo | $25,000 | $18 | 60 |
| 17428 Goddard St | 0.48mi | 3/1.5 | 1,409 (-6%) | 13mo | $75,000 | $53 | 56 |
| 18101 Marx St | 0.39mi | 3/1.5 | 1,291 (-13%) | 2mo | $37,500 | $29 | 55 |
| 18595 Dequindre St | 0.60mi | 3/1.5 | 1,393 (-7%) | 13mo | $70,000 | $50 | 48 |
| 18051 Orleans St | 0.33mi | 4/2.0 (+1) | 1,300 (-13%) | 9mo | $39,000 | $30 | 47 |
| 50 E Nevada St | 0.71mi | 3/2.5 | 1,465 (-2%) | 15mo | $130,000 | $89 | 45 |
| 17520 Goddard Street St | 0.49mi | 4/2.0 (+1) | 1,302 (-13%) | 3mo | $54,900 | $42 | 45 |
| 18184 Riopelle St | 0.44mi | 3/1.0 | 1,700 (+14%) | 16mo | $65,000 | $38 | 43 |
| 116 Church St | 0.71mi | 3/1.5 | 1,400 (-6%) | 15mo | $106,500 | $76 | 42 |
| 18844 Hull St | 0.65mi | 3/2.0 | 1,603 (+8%) | 18mo | $125,000 | $78 | 38 |
Match score weights: distance 35% · size 25% · config 20% · recency 20%. Top-matched comps best support the ARV.
Projected returns pro-forma
-3.0% appreciation · 3.0% rent growth · sell at horizon
- IRR
- 69.1%
- Equity multiple
- 4.12×
- Total profit
- $39,283
- Equity at exit
- $6,710
- IRR
- 73.2%
- Equity multiple
- 8.48×
- Total profit
- $94,267
- Equity at exit
- $3,891
Cash invested: $12,600 (down + closing). Projections, not guarantees.
Landlord ↔ Tenant lean methodology
- Overall (STATE)
- 62 Landlord-Friendly
- State Michigan
- 62 Landlord-Friendly · EVEN
- County
- — inherits STATE
- City
- — inherits STATE
ZIP-level market 48203
- Home prices YoY
- -23.3%
- Active inventory
- 216
- Price-to-rent
- 2.8×
Monthly cashflow live
- Estimated rent
- $1,342 high interval (Pro) →
- Mortgage (P&I)
- −$236
- Tax from tax record
- −$74 /mo · $891/yr
- Insurance
- −$19
- HOA
- −$0
- Vacancy / Maint / Mgmt
- −$282
- Net cashflow
- $731
Break-even live
Sensitivity live
| Price | -10% $756 | -5% $744 | +0% $731 | +5% $718 | +10% $705 |
|---|---|---|---|---|---|
| Rent | -10% $625 | -5% $678 | +0% $731 | +5% $784 | +10% $837 |
| Rate | -1.0pp $753 | -0.5pp $742 | base $731 | +0.5pp $719 | +1.0pp $707 |
UW: 25.0% down · 7.5% · 30yr · 1.5% tax · 5.0% vac · 8.0% maint · 8.0% mgmt
Financing live
Cash to close
- Down payment
- $11,250
- Closing costs
- $1,350
- Reserves months
- —
- Total cash needed
- —
Loan-product check · same deal, 3 products live
Conventional
25% down · 7.5% · 30yr
- Down + closing
- —
- Monthly P&I
- —
- Monthly cashflow
- —
- DSCR
- —
- Eligible?
- —
Personal DTI + credit; lowest rate.
DSCR
20% down · 8.5% · 30yr
- Down + closing
- —
- Monthly P&I
- —
- Monthly cashflow
- —
- DSCR
- —
- Eligible?
- —
No personal income docs; deal must DSCR.
Hard money
10% down · 12.0% · 12mo
- Down + closing
- —
- Monthly P&I
- —
- Monthly cashflow
- —
- DSCR
- —
- Eligible?
- —
Short-term bridge; refi at stabilization.
Rent comps 20 comps
| Address | Beds | Baths | Sqft | Rent | $/sqft | DOM | Units | Dist |
|---|---|---|---|---|---|---|---|---|
| 18503 Riopelle St Highland Park, MI | 3.0 | 1.0 | 1254 | $1,250 | $1.00 | 5d | 1 | 0.44mi |
| 242 Ferris St Highland Park, MI | 3.0 | 1.0 | 1192 | $1,275 | $1.07 | 0d | 1 | 0.51mi |
| 18551 Saint Aubin St Detroit, MI | 3.0 | 1.0 | 962 | $1,200 | $1.25 | 17d | 1 | 0.58mi |
| 18882 Marx St Highland Park, MI | 2.0 | 1.0 | 1000 | $1,300 | $1.30 | 44d | 1 | 0.70mi |
| 18629 Fleming St Detroit, MI | 3.0 | 1.5 | 900 | $1,150 | $1.28 | 25d | 1 | 0.71mi |
| 101 Stevens St Highland Park, MI | 3.0 | 1.5 | 1152 | $1,600 | $1.39 | 18d | 1 | 0.72mi |
| 18666 Joseph Campau St Detroit, MI | 3.0 | 1.0 | 1000 | $1,400 | $1.40 | 17d | 1 | 0.98mi |
| 406 W Goldengate St Detroit, MI | 2.0 | 1.0 | 1050 | $1,100 | $1.05 | 44d | 1 | 1.10mi |
| 404 W Golden Gate Highland Park, MI | 2.0 | 1.0 | 1050 | $1,100 | $1.05 | 44d | 1 | 1.10mi |
| 17550 2nd Ave Detroit, MI | 2.0 | 1.0 | 1350 | $1,150 | $0.85 | 18d | 1 | 1.13mi |
| 168 Beresford St Highland Park, MI | 4.0 | 1.0 | 1541 | $1,475 | $0.96 | 18d | 1 | 1.21mi |
| 574 W Golden Gate Highland Park, MI | 3.0 | 1.0 | 1315 | $1,300 | $0.99 | 44d | 1 | 1.25mi |
| 18557 Wexford St Detroit, MI | 3.0 | 1.0 | 1216 | $1,250 | $1.03 | 25d | 1 | 1.26mi |
| 27 Pasadena St Highland Park, MI | 2.0 | 1.0 | 900 | $825 | $0.92 | 44d | 1 | 1.31mi |
| 19703 Keating St Highland Park, MI | 3.0 | 1.0 | 1000 | $1,200 | $1.20 | 17d | 1 | 1.32mi |
| 885 Covington Dr Unit 201 Highland Park, MI | 2.0 | 2.0 | 1350 | $1,695 | $1.26 | 44d | 1 | 1.40mi |
| 19360 Revere St Detroit, MI | 3.0 | 1.0 | 1050 | $1,250 | $1.19 | 25d | 1 | 1.43mi |
| 19995 Goddard St Detroit, MI | 4.0 | 1.0 | 1292 | $1,400 | $1.08 | 22d | 1 | 1.46mi |
| 19694 Gallagher St Detroit, MI | 3.0 | 1.0 | 1000 | $1,150 | $1.15 | 15d | 1 | 1.50mi |
| 1029 Covington Dr Unit 1029 Detroit, MI | 2.0 | 1.0 | 1200 | $1,495 | $1.25 | 44d | 1 | 1.50mi |
Listing history 27 events
-
2026-03-04historical
Show marketing remark (605 chars)
Charming 3-Bedroom Home with Great Potential!Listed at $45,000, this 3-bedroom, 1.5-bath home offers both investors and first-time buyers an incredible opportunity. Features include an attached garage with a brand-new garage door, a new detached garage in the back, and a recently installed security system. Major updates have already been completed: new windows, doors, furnace, electric panel, and garage doors. The roof was repaired just 2 years ago, giving you peace of mind. With solid bones and modern upgrades already in place, this property is a perfect blank canvas ready for your personal touch.
-
2026-03-04$45,000
Show marketing remark (605 chars)
Charming 3-Bedroom Home with Great Potential!Listed at $45,000, this 3-bedroom, 1.5-bath home offers both investors and first-time buyers an incredible opportunity. Features include an attached garage with a brand-new garage door, a new detached garage in the back, and a recently installed security system. Major updates have already been completed: new windows, doors, furnace, electric panel, and garage doors. The roof was repaired just 2 years ago, giving you peace of mind. With solid bones and modern upgrades already in place, this property is a perfect blank canvas ready for your personal touch.
-
2026-03-04historical 605-char remark
Show marketing remark (605 chars)
Charming 3-Bedroom Home with Great Potential!Listed at $45,000, this 3-bedroom, 1.5-bath home offers both investors and first-time buyers an incredible opportunity. Features include an attached garage with a brand-new garage door, a new detached garage in the back, and a recently installed security system. Major updates have already been completed: new windows, doors, furnace, electric panel, and garage doors. The roof was repaired just 2 years ago, giving you peace of mind. With solid bones and modern upgrades already in place, this property is a perfect blank canvas ready for your personal touch.
-
2026-03-04$45,000 605-char remark
Show marketing remark (605 chars)
Charming 3-Bedroom Home with Great Potential!Listed at $45,000, this 3-bedroom, 1.5-bath home offers both investors and first-time buyers an incredible opportunity. Features include an attached garage with a brand-new garage door, a new detached garage in the back, and a recently installed security system. Major updates have already been completed: new windows, doors, furnace, electric panel, and garage doors. The roof was repaired just 2 years ago, giving you peace of mind. With solid bones and modern upgrades already in place, this property is a perfect blank canvas ready for your personal touch.
-
2026-02-06historical
-
2026-02-05historical
-
2025-11-06price $35,000
-
2025-11-05price $35,000
-
2025-11-05price $35,000
-
2025-08-05$45,000 Active
-
2025-08-05$45,000 Active
-
2021-01-18historical
-
2020-12-09status Pending
-
2020-12-09status Pending
-
2020-12-09historical
-
2020-11-28price $6,000
-
2020-11-27price $6,000
-
2020-10-26price $7,000
-
2020-10-26price $7,000
-
2020-09-23$6,800 Active
-
2020-09-23$6,800 Active
-
2019-08-09soldstatus $7,000 Sold
-
2019-08-09soldstatus $7,000 Closed
-
2019-07-16status Pending
-
2019-07-16status Pending
-
2019-07-01$6,000 Active
-
2019-07-01$6,000 Active
ⓘ Source: listings_history table (triggers on properties + properties_extension) + one-shot
backfill from property_details.listing_events for pre-trigger history.
Tax reassessment forecast MI · Partial reset (capped growth)
- Current annual tax
- $891 · $74/mo
- Projected year-2 tax
- $891 · $74/mo
- Expected delta
- $0/yr ($0/mo · 0.0%)
ⓘ Screening estimate from a state-policy table — verify with the county assessor before closing.
Climate risk First Street
- Flood 1/10 Low FEMA zone X (unshaded) · 0% chance over 30 yrs
- Wildfire 1/10 Low
- Heat 2/10 Low 6 d/yr ≥97°F today · 13 d/yr by 30 yrs out
- Wind 2/10 Low
- Air quality 4/10 Moderate 4 unhealthy d/yr today · 6 by 30 yrs out
Nearby sold comps map
Loading sold comps map…
Walkable amenities ~0.75 mi
Loading nearby amenities…
Taxation est. · year 1
- Rental income
- $16,098
- − Mortgage interest
- −$2,521
- − Property taxes
- −$891
- − Insurance
- −$225
- − Repairs & maintenance
- −$1,288
- − Management
- −$1,288
- − Depreciation
- −$1,309
- Taxable income
- $8,576
- Est. tax owed @ 24.0%
- −$2,058
- After-tax cash flow
- $6,711/yr
For passive investors: Depreciation is non-cash, so a rental often shows a tax loss while cash-flowing — sheltering income. Rental losses are passive: they offset passive income freely, and up to $25,000/yr can offset ordinary (W-2) income if you actively participate and your MAGI is under $100k (phasing out to $0 by $150k); unused losses carry forward. On sale, claimed depreciation is recaptured at up to 25%, and gains may owe capital-gains tax (a 1031 exchange can defer both). Figures are a year-1 estimate at your 24.0% rate — not tax advice; consult a CPA.
Schools (NCES district)
- District
- Detroit Public Schools Community District
- NCES district ID
- 2601103
- Math proficiency
- 10% ▼ -2.00%
- Reading proficiency
- 24% ▲ 6.00%
- Median HH income
- $25,815
- Composite
- 13.06/100
- National rank
- #9564
- State rank
- #499 of 540 in MI
Livability — Detroit
- Score
- 73/100
- State rank
- #218
- US rank
- #5427
Category grades
Schools grade is shown separately in the Schools card above.
Census & demographics
- Census place
- Detroit, MI
- County
- Wayne County · 1,562,939 people
- City population
- 572,865
- Metro
- Detroit-Warren-Dearborn, MI
- Population (ZIP)
- 20,049
- Household income
- $38,404
- Rent vs Own
- Severe rent burden
- 1192.0
Population outlook (Wayne County) Hauer SSP2
- Today (2025)
- 1,675,273 people
- By 2030
- 1,620,300 · -3.3%
- By 2040
- 1,502,341 · -10.3%
- By 2050
- 1,384,039 · -17.4%
- By 2075
- 1,124,592 · -32.9%
- By 2100
- 881,193 · -47.4%
Race, ethnicity, and origin ACS 2023
- Neighborhood character
- Predominantly Black (85%)
- Race & ethnicity
- Black 85% White 8% Two or more races 5% Hispanic / Latino 2%
- Common ancestry
- Lithuanian 1%
- Foreign-born
- 2% · Canada
- Languages at home
- 95% English-only · Spanish 3% French/Haitian/Cajun 1%
Political lean MEDSL · Wayne
- 2024 margin
- Strong D (+29.0) · D 62.7% · R 33.7% · Other 3.6%
- 2008→2024 swing
- -20.5pp toward R · 2008: 49.5pp · 2024: 29.0pp
- All cycles
- 2024: D+29.0 2020: D+38.1 2016: D+37.3 2012: D+46.9 2008: D+49.5
Not yet ingested
- Civics
- —
Market trends
- HPI YoY
- ▼ -90.13%
- Current HPI
- 297.0176
- Rent YoY
- —
- Metro
- Detroit-Warren-Dearborn, MI
- State GDP YoY
- ▲ 1.37%
- F500 in state
- 28
Industry mix (Fortune 500 HQ in MI)
| Industry | F500 HQs | Revenue |
|---|---|---|
| Automotive Parts | 3 | $48B |
|
||
| Automotive | 2 | $372B |
|
||
| Chemicals | 1 | $45B |
|
||
| Automotive Retail | 1 | $29B |
|
||
| Healthcare / Medical Devices | 1 | $23B |
|
||
| Automotive Technology | 1 | $20B |
|
||
Price history
+650.0% since first listed27 events — show timeline
- 2026-03-04 Listed $45,000 MiRealSource-MiMLS
- 2026-03-04 Listing Removed — MiRealSource-MiMLS
- 2026-03-04 Listed $45,000 REALCOMP
- 2026-03-04 Listing Removed — REALCOMP
- 2026-02-06 Listing Removed — MiRealSource-MiMLS
- 2026-02-05 Listing Removed — REALCOMP
- 2025-11-06 Price Changed $35,000 MiRealSource-MiMLS
- 2025-11-05 Price Changed $35,000 REALCOMP
- 2025-11-05 Price Changed $35,000 SW Michigan MLS
- 2025-08-05 Listed $45,000 REALCOMP
- 2025-08-05 Listed $45,000 MiRealSource-MiMLS
- 2021-01-18 Listing Removed — REALCOMP
- 2020-12-09 Pending — MiRealSource-MiMLS
- 2020-12-09 Pending — REALCOMP
- 2020-12-09 Listing Removed — MiRealSource-MiMLS
- 2020-11-28 Price Changed $6,000 MiRealSource-MiMLS
- 2020-11-27 Price Changed $6,000 REALCOMP
- 2020-10-26 Price Changed $7,000 MiRealSource-MiMLS
- 2020-10-26 Price Changed $7,000 REALCOMP
- 2020-09-23 Listed $6,800 MiRealSource-MiMLS
- 2020-09-23 Listed $6,800 REALCOMP
- 2019-08-09 Sold (MLS) $7,000 MiRealSource-MiMLS
- 2019-08-09 Sold (MLS) $7,000 REALCOMP
- 2019-07-16 Pending — MiRealSource-MiMLS
- 2019-07-16 Pending — REALCOMP
- 2019-07-01 Listed $6,000 MiRealSource-MiMLS
- 2019-07-01 Listed $6,000 REALCOMP
Property tax history
+3.3%/yrLatest (2025): $891 · +1.7% YoY. Source: county tax records.
Cash-flow waterfall
monthlySold comps — $/sqft
last 12 mo · ≤1 miLoading sold comps…