 Multi-family
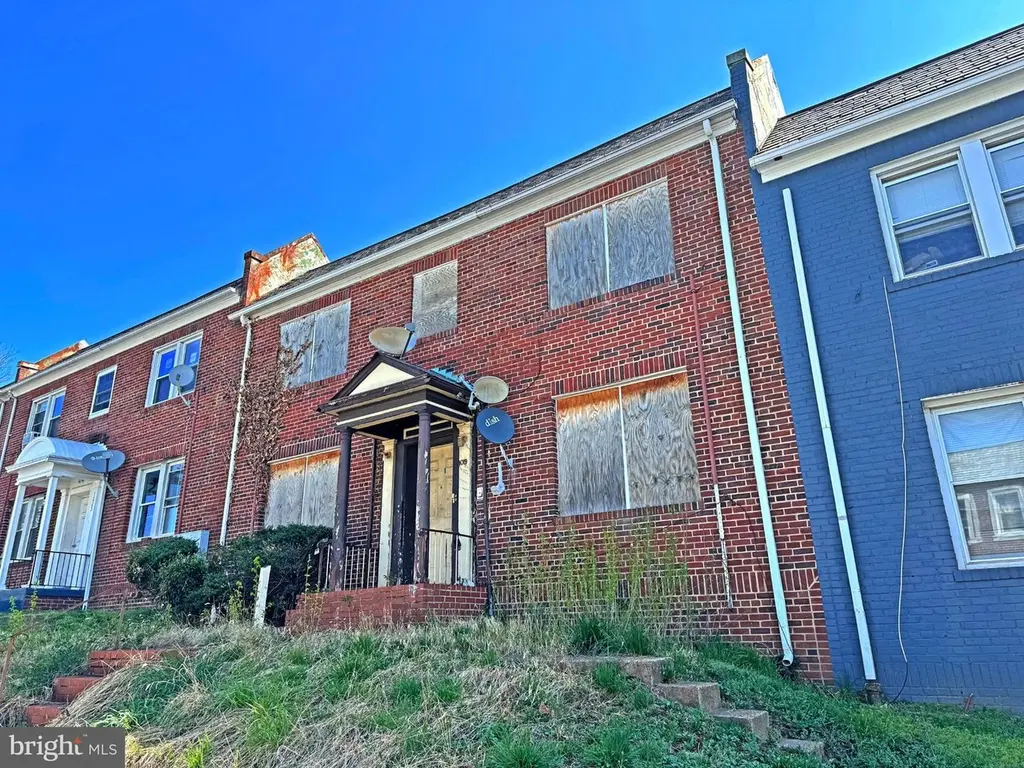
1019 18th St NE · Washington, DC
Flood risk 1/10 · Minimal
- FEMA flood zone
- X (unshaded)
- Chance of flooding over 30 yrs
- 0.0%
- Est. flood insurance / yr
- $507 – $1,088
Fire risk 1/10 · Minimal
- Est. fire insurance / yr
- $631 – $1,173
Heat risk 7/10 · Major
- Hot days now (above 106°F)
- 7 days/yr
- Hot days in 30 yrs
- 15 days/yr
Wind risk 4/10 · Minor
- Chance of severe wind over 30 yrs
- 16.0%
Air-quality risk 4/10 · Minor
- Unhealthy air days now
- 4 days/yr
- Unhealthy air days in 30 yrs
- 5 days/yr
Risk factors via First Street. Map © Google.
Why this score? — see what drove the D+ grade
The composite is a weighted blend of 9 inputs, each scored 0–100. Each bar is that input's sub-score; the figure is the points it added to the 100-point composite (weight × sub-score).
- Cash flow +20.1/30.0
- DSCR +6.4/10.0
- ARV discount +6.3/15.0
- 1% rule +4.7/10.0
- Livability +3.7/5.0
- Schools +3.6/10.0
- Condition / age +2.5/5.0
- Rent growth +1.7/5.0
- Appreciation +0.0/10.0
$895,000
🖨 Deal sheet 📄 Offer letter ✓ Due diligence
Multi-family units
County records classify this as Multi-Family (2-4 Unit). Listing-text estimate: 1 unit. estimate disagrees with records
Key facts
- 3,049 sq ft lot
- Built 1938
- Listed 92 days
Property features AI
Exterior
- Parking: Alley access
- Utilities: Public water; Public septic
- Home design: Interior townhouse/rowhouse; Fee simple ownership
- Construction: Brick construction; Other foundation; Above-grade structures
- Exterior features: No tidal/ tidal water; Soil type: Chillum-Urban Land Complex; Above-grade finished living space
Interior
- Bedrooms: Two-unit building (other unit listed as Unit 1)
- Interior features: Estimated living area
Neighborhood map
What this means for you Summary
Snapshot
- This is a 4-bed/4.0-bath multifamily listed at $895k.
Deal economics
- At list price, monthly cash flow is $1k ($13k/yr) — positive.
- The deal already cash-flows at list — no discount required.
- To meet the 1% rule (rent ≥ 1% of price), the offer needs to be $872k (2.6% below list).
- Recommended offer: $814k (9.0% below list) — sets the bar for market timing.
- Cap rate 7.8% vs local median 2.5% in Washington — top-decile yield for the area; either an underpriced asset or a hidden risk that comps aren't pricing in. Stress-test before assuming the spread holds.
Location & tenants
- Location reads 73/100 on livability (#1 in DC) — a middle-class / working-renter tenant base. Strengths: amenities A+, commute A+, employment A+; Watch: crime F, cost of living F.
- District Of Columbia Public Schools (urban): math 33% / reading 40% proficiency, ranked #8 of 32 in DC (top 25%) — families likely to look elsewhere, expect single-tenant / working-renter base with shorter leases; 65% free/reduced lunch — lower-income household profile, screen leases tightly.
- Market conditions: Rents falling (-3.0%/yr); 548 active listings in the ZIP; 9 comparable units currently listed for rent nearby; rentals at typical pace (median 24d on market — plan ~3-4 weeks tenant-placement turnaround); high-income renter base; 1,737 units permitted in District of Columbia in 2024 (1,506 in 5+ unit buildings).
- At $8,716/mo this rent would consume 87% of the median local household income ($120k/yr) (locally 3854% of renters already pay >50% of income on rent) — very limited rent-growth headroom before tenants either downsize or default.
Forward outlook
- Local home prices are declining (-3.0%/yr); year-one equity from $6k of loan paydown is wiped out by about $27k of value loss. Plan a longer hold.
- District of Columbia County population projected at +50% by 2050 — long-run rental-demand tailwind backs the buy-and-hold thesis.
Negotiation context
- It's been on market 92 days — a 9% lower offer ($814k) is reasonable based on typical stale-listing flexibility.
- 14 sale attempts since 12y ago with the ask held roughly flat each time — persistent listings suggest the price (not the market) is what's stuck; bring a comps-based counter.
- Current owner paid $599k; 49% above their basis — modest negotiation headroom, anchor on the comps not their cost.
Risks & watch-outs
- Watch-outs: built in 1938 — expect roof / HVAC / electrical / plumbing capex.
- Climate carrying-cost: extreme-heat days projected 7→15/yr by 2055 (HVAC capex compounding) — expect insurance premiums to compound above CPI over the hold.
Questions for the listing agent
- It's been on market 92 days. Have you received any prior offers? Is the seller open to a 9% concession, seller financing, or rate buy-down credit?
- Built in 1938 — when were the roof, HVAC, electrical panel, plumbing, and water heater last replaced?
- Why hasn't it sold? Are there any deal-killer items the seller is aware of (foundation, flood, title, zoning, code violations)?
- Is there a deadline driving the sale (1031 exchange, divorce, estate, relocation)? That informs how much negotiation room exists.
- Crime grade is F in this area — have there been break-ins, vandalism, or insurance claims at this property in the last 3 years? What carrier currently insures it and at what premium?
- The area grade is low — what's the realistic commute time and amenity access for the typical tenant pool here? Any planned neighborhood developments (good or bad) we should know about?
- What's the average days-on-market for RENTAL listings here right now (not sales)? A rising rental-DOM trend means longer vacancies and softer asking-rent achievability than the comps imply.
- What's the recent tenant-quality profile in this submarket — average credit score on applications, eviction rate, late-payment / NSF rate, and stable-employment percentage? A property-management company in the area should have these aggregated.
- How much new apartment / multifamily construction is in the pipeline within 1–3 miles? Heavy new supply (>2% of stock underway) typically softens rents 12–24 months out; light construction supports rent growth.
Investment metrics
- 1% rule
- 0.97% ✗
- Cap rate
- 7.79%
- Cash-on-cash
- 5.36%
- DSCR
- 1.24
- GRM
- 8.6
CMA / ARV
- ARV (on-the-fly)
- $871,220
- Comps found
- 5
Show comp detail 5 sales within ~0.75 mi
| Address | Dist | Beds/Ba | Sqft | Sold | Price | $/sf | Match |
|---|---|---|---|---|---|---|---|
| 1912 M St NE | 0.23mi | 4/4.0 | 3,246 (-5%) | 2mo | $825,000 | $254 | 78 |
| 1211 Simms Pl NE | 0.57mi | 3/4.0 (-1) | 3,472 (+1%) | 5mo | $1,220,000 | $351 | 62 |
| 1500 Oates St NE | 0.28mi | 5/— (+1) | 3,602 (+5%) | 15mo | $885,000 | $246 | 61 |
| 1217 Raum St NE | 0.55mi | 4/— | 3,395 (-1%) | 23mo | $699,000 | $206 | 53 |
| 1719 West Virginia Ave NE | 0.65mi | 4/— | 3,100 (-10%) | 8mo | $840,000 | $271 | 47 |
Match score weights: distance 35% · size 25% · config 20% · recency 20%. Top-matched comps best support the ARV.
Projected returns pro-forma
-3.0% appreciation · 0.0% rent growth · sell at horizon
- IRR
- -11.2%
- Equity multiple
- 0.60×
- Total profit
- $-99,467
- Equity at exit
- $133,447
- IRR
- -6.7%
- Equity multiple
- 0.62×
- Total profit
- $-94,117
- Equity at exit
- $77,383
Cash invested: $250,600 (down + closing). Projections, not guarantees.
Landlord ↔ Tenant lean methodology
- Overall (CITY)
- 0 Strongly Tenant-Friendly
- State District of Columbia
- 12 Strongly Tenant-Friendly · D+43
- County
- — inherits STATE
- City Washington
- 0 Strongly Tenant-Friendly · D+43
ZIP-level market 20002
- Rents YoY
- -3.0%
- Active inventory
- 548
- Price-to-rent
- 25.7×
Monthly cashflow live
- Estimated rent
- $8,716 high interval (Pro) →
- Mortgage (P&I)
- −$4,693
- Tax from tax record
- −$701 /mo · $8,410/yr
- Insurance
- −$373
- HOA
- −$0
- Vacancy / Maint / Mgmt
- −$1,830
- Net cashflow
- $1,118
Break-even live
3-unit breakdown (identical units grouped — click to expand)
| Units | Beds | Baths | Est. rent |
|---|---|---|---|
| 3× units | 3 | 1.5 | $8,715 |
| #1 | 3 | 1.5 | $2,905 |
| #2 | 3 | 1.5 | $2,905 |
| #3 | 3 | 1.5 | $2,905 |
| Total (3 units) | $8,716 | ||
UW: 25.0% down · 7.5% · 30yr · 1.5% tax · 5.0% vac · 8.0% maint · 8.0% mgmt
Financing live
Cash to close
- Down payment
- $223,750
- Closing costs
- $26,850
- Reserves months
- —
- Total cash needed
- —
Loan-product check · same deal, 3 products live
Conventional
25% down · 7.5% · 30yr
- Down + closing
- —
- Monthly P&I
- —
- Monthly cashflow
- —
- DSCR
- —
- Eligible?
- —
Personal DTI + credit; lowest rate.
DSCR
20% down · 8.5% · 30yr
- Down + closing
- —
- Monthly P&I
- —
- Monthly cashflow
- —
- DSCR
- —
- Eligible?
- —
No personal income docs; deal must DSCR.
Hard money
10% down · 12.0% · 12mo
- Down + closing
- —
- Monthly P&I
- —
- Monthly cashflow
- —
- DSCR
- —
- Eligible?
- —
Short-term bridge; refi at stabilization.
Rent comps 9 comps
| Address | Beds | Baths | Sqft | Rent | $/sqft | DOM | Units | Dist |
|---|---|---|---|---|---|---|---|---|
| 1640 L St NE Washington, DC | 3.0 | 2.0 | 2300 | $3,700 | $1.61 | 18d | 1 | 0.14mi |
| 1609 Levis St NE Washington, DC | 4.0 | 4.5 | 2295 | $3,900 | $1.70 | 24d | 1 | 0.20mi |
| 1255 Raum St NE Unit 1388282P Washington, DC | 2.0–8.0 | 1.0–5.0 | 3245 | $6,967 | $2.15 | 1d | 2 | 0.48mi |
| 333 17th Pl NE Washington, DC | 3.0 | 1.5 | 2300 | $3,400 | $1.48 | 24d | 1 | 0.61mi |
| 1167 Morse St NE #1 Washington, DC | 5.0 | 4.5 | 3409 | $8,500 | $2.49 | 24d | 1 | 0.67mi |
| 221 20th St NE Unit 4 Washington, DC | 3.0 | 1.0 | 3360 | $2,999 | $0.89 | 24d | 1 | 0.72mi |
| 1319 Massachusetts Ave SE Washington, DC | 3.0 | 3.0 | 2578 | $6,000 | $2.33 | 24d | 1 | 1.13mi |
| 723 5th St NE Unit 630P Washington, DC | 3.0 | 3.0 | 3003 | $7,500 | $2.50 | 12d | 1 | 1.17mi |
| 504 Capitol Ct NE Unit 170373P Washington, DC | 3.0 | 2.0 | 2615 | $7,350 | $2.81 | 7d | 1 | 1.40mi |
Listing history 50 events
-
2026-06-18days on market $895,000 Active 92 DOM
-
2026-06-17days on market $895,000 Active 91 DOM
-
2026-06-16days on market $895,000 Active 90 DOM
-
2026-06-15days on market $895,000 Active 89 DOM
-
2026-06-13days on market $895,000 Active 87 DOM
-
2026-06-09days on market $895,000 Active 83 DOM
-
2026-06-08days on market $895,000 Active 82 DOM
-
2026-06-07days on market $895,000 Active 81 DOM
-
2026-06-04days on market $895,000 Active 78 DOM
-
2026-06-03days on market $895,000 Active 77 DOM
-
2026-06-02days on market $895,000 Active 76 DOM
-
2026-06-01days on market $895,000 Active 75 DOM
-
2026-05-31days on market $895,000 Active 74 DOM
-
2026-03-18$895,000 Active
-
2026-01-26historical
-
2025-09-23price $849,000
-
2025-07-30$895,000 Active
-
2025-07-24historical
-
2025-06-10price $975,000
-
2025-04-16$1,100,000 Active
-
2025-03-26historical
-
2024-02-14$1,500,000 Active
-
2022-05-16status Pending
-
2022-05-10historical
-
2022-05-10historical
-
2022-02-12$1,699,995 Active
-
2020-12-31historical
-
2020-09-01status Active
-
2020-08-31historical
-
2020-05-30$1,600,000 Active
-
2016-07-18soldstatus $599,000
-
2016-05-11historical
-
2016-05-10historical
-
2016-04-18price
-
2016-04-18$649,900
-
2016-04-18Active
-
2016-04-18historical
-
2016-04-17historical
-
2016-03-21price
-
2016-03-07status Active
-
2016-03-01historical Expired
-
2015-11-01Active
-
2015-11-01$680,000
-
2015-01-13soldstatus $475,000
-
2014-11-11historical
-
2014-09-24status Contract
-
2014-09-24historical Withdrawn
-
2014-08-21Active
-
2014-08-21$495,000
-
1991-02-11soldstatus $85,000
ⓘ Source: listings_history table (triggers on properties + properties_extension) + one-shot
backfill from property_details.listing_events for pre-trigger history.
Tax reassessment forecast DC · Partial reset (capped growth)
- Current annual tax
- $8,410 · $701/mo
- Projected year-2 tax
- $8,410 · $701/mo
- Expected delta
- $0/yr ($0/mo · 0.0%)
ⓘ Screening estimate from a state-policy table — verify with the county assessor before closing.
Climate risk First Street
- Flood 1/10 Low FEMA zone X (unshaded) · 0% chance over 30 yrs
- Wildfire 1/10 Low
- Heat 7/10 Severe 7 d/yr ≥106°F today · 15 d/yr by 30 yrs out
- Wind 4/10 Moderate 16% chance of damaging wind over 30 yrs
- Air quality 4/10 Moderate 4 unhealthy d/yr today · 5 by 30 yrs out
Nearby sold comps map
Loading sold comps map…
Walkable amenities ~0.75 mi
Loading nearby amenities…
Taxation est. · year 1
- Rental income
- $104,592
- − Mortgage interest
- −$50,134
- − Property taxes
- −$8,410
- − Insurance
- −$4,475
- − Repairs & maintenance
- −$8,367
- − Management
- −$8,367
- − Depreciation
- −$26,036
- Taxable loss
- −$1,198
- Est. tax savings @ 24.0%
- +$288
- After-tax cash flow
- $13,708/yr
For passive investors: Depreciation is non-cash, so a rental often shows a tax loss while cash-flowing — sheltering income. Rental losses are passive: they offset passive income freely, and up to $25,000/yr can offset ordinary (W-2) income if you actively participate and your MAGI is under $100k (phasing out to $0 by $150k); unused losses carry forward. On sale, claimed depreciation is recaptured at up to 25%, and gains may owe capital-gains tax (a 1031 exchange can defer both). Figures are a year-1 estimate at your 24.0% rate — not tax advice; consult a CPA.
Schools (NCES district)
- District
- District Of Columbia Public Schools
- NCES district ID
- 1100030
- Math proficiency
- 33% ▲ 3.00%
- Reading proficiency
- 40% ▲ 5.00%
- Median HH income
- $67,671
- Composite
- 35.84/100
- National rank
- #9606
- State rank
- #8 of 32 in DC
Livability — Washington
- Score
- 73/100
- State rank
- #1
- US rank
- #5327
Category grades
Schools grade is shown separately in the Schools card above.
Census & demographics
- Census place
- Washington, DC
- County
- District of Columbia · 671,873 people
- City population
- 671,873
- Metro
- Washington-Arlington-Alexandria, DC-VA-MD-WV
- Population (ZIP)
- 72,397
- Household income
- $120,337
- Rent vs Own
- Severe rent burden
- 3854.0
Population outlook (District of Columbia County) Hauer SSP2
- Today (2025)
- 821,926 people
- By 2030
- 899,517 · +9.4%
- By 2040
- 1,061,162 · +29.1%
- By 2050
- 1,231,493 · +49.8%
- By 2075
- 1,603,312 · +95.1%
- By 2100
- 1,847,141 · +124.7%
Race, ethnicity, and origin ACS 2023
- Neighborhood character
- Diverse neighborhood (Simpson 0.66)
- Race & ethnicity
- White 41% Black 40% Two or more races 9% Hispanic / Latino 9% Asian 3%
- Hispanic origin (detail)
- Mexican 2%
- Common ancestry
- Romanian 3% Lithuanian 2% Italian 2%
- Foreign-born
- 9% · Canada, China, South Korea
- Languages at home
- 87% English-only · Spanish 5% French/Haitian/Cajun 2% Other Indo-European 1%
Political lean MEDSL · District of Columbia
- 2024 margin
- Solid D (+86.1) · D 91.2% · R 5.1% · Other 3.8%
- 2008→2024 swing
- +0.1pp no change · 2008: 85.9pp · 2024: 86.1pp
- All cycles
- 2024: D+86.1 2020: D+86.8 2016: D+88.7 2012: D+84.2 2008: D+85.9
Not yet ingested
- Civics
- —
Market trends
- HPI YoY
- ▼ -852.61%
- Current HPI
- 396.6033
- Rent YoY
- ▼ -3.04%
- Metro
- Washington-Arlington-Alexandria, DC-VA-MD-WV
- State GDP YoY
- ▲ 1.33%
- F500 in state
- 6
Industry mix (Fortune 500 HQ in DC)
| Industry | F500 HQs | Revenue |
|---|---|---|
| Financial Services | 1 | $153B |
|
||
| Life Sciences / Industrials | 1 | $25B |
|
||
| Industrial Machinery | 1 | $8B |
|
||
Price history
+952.9% since first listed37 events — show timeline
- 2026-03-18 Listed $895,000 BRIGHT MLS
- 2026-01-26 Listing Removed — BRIGHT MLS
- 2025-09-23 Price Changed $849,000 BRIGHT MLS
- 2025-07-30 Listed $895,000 BRIGHT MLS
- 2025-07-24 Listing Removed — BRIGHT MLS
- 2025-06-10 Price Changed $975,000 BRIGHT MLS
- 2025-04-16 Listed $1,100,000 BRIGHT MLS
- 2025-03-26 Listing Removed — BRIGHT MLS
- 2024-02-14 Listed $1,500,000 BRIGHT MLS
- 2022-05-16 Pending — BRIGHT MLS
- 2022-05-10 Listing Removed — BRIGHT MLS
- 2022-05-10 Listing Removed — BRIGHT MLS
- 2022-02-12 Listed $1,699,995 BRIGHT MLS
- 2020-12-31 Listing Removed — BRIGHT MLS
- 2020-09-01 Relisted — BRIGHT MLS
- 2020-08-31 Listing Removed — BRIGHT MLS
- 2020-05-30 Listed $1,600,000 BRIGHT MLS
- 2016-07-18 Sold (Public Records) $599,000 Public Records
- 2016-05-11 Delisted — MRIS
- 2016-05-10 Listing Removed — BRIGHT MLS
- 2016-04-18 Price Changed — MRIS
- 2016-04-18 Listed $649,900 BRIGHT MLS
- 2016-04-18 Listed — MRIS
- 2016-04-18 Delisted — MRIS
- 2016-04-17 Listing Removed — BRIGHT MLS
- 2016-03-21 Price Changed — MRIS
- 2016-03-07 Relisted — MRIS
- 2016-03-01 Delisted — MRIS
- 2015-11-01 Listed — MRIS
- 2015-11-01 Listed $680,000 BRIGHT MLS
- 2015-01-13 Sold (Public Records) $475,000 Public Records
- 2014-11-11 Listing Removed — BRIGHT MLS
- 2014-09-24 Pending — MRIS
- 2014-09-24 Delisted — MRIS
- 2014-08-21 Listed — MRIS
- 2014-08-21 Listed $495,000 BRIGHT MLS
- 1991-02-11 Sold (Public Records) $85,000 Public Records
Property tax history
+5.3%/yrLatest (2025): $8,410 · -83.2% YoY. Source: county tax records.
Cash-flow waterfall
monthlySold comps — $/sqft
last 12 mo · ≤1 miLoading sold comps…