 18-Plex
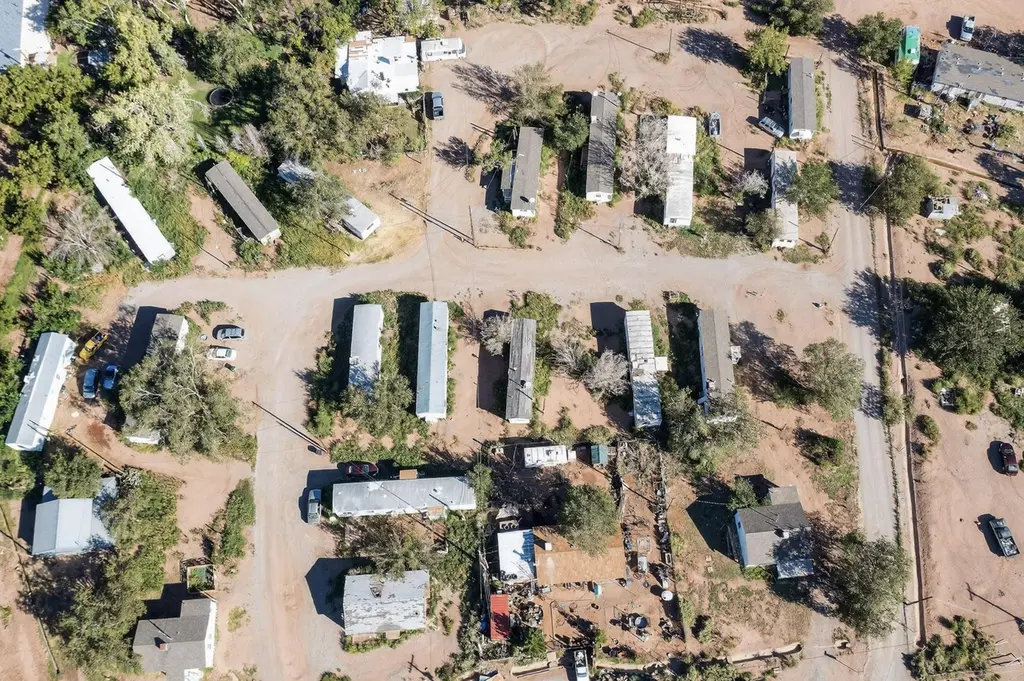
1 Thru 16 Sams Ct · La Luz, NM
Flood risk 1/10 · Minimal
- FEMA flood zone
- X (unshaded)
- Chance of flooding over 30 yrs
- 0.0%
- Est. flood insurance / yr
- $507 – $1,088
Fire risk 4/10 · Minor
- Est. fire insurance / yr
- $706 – $1,312
Heat risk 4/10 · Minor
- Hot days now (above 96°F)
- 7 days/yr
- Hot days in 30 yrs
- 24 days/yr
Wind risk 1/10 · Minimal
- Chance of severe wind over 30 yrs
- —
Air-quality risk 1/10 · Minimal
- Unhealthy air days now
- 0 days/yr
- Unhealthy air days in 30 yrs
- 0 days/yr
Risk factors via First Street. Map © Google.
Why this score? — see what drove the B- grade
The composite is a weighted blend of 9 inputs, each scored 0–100. Each bar is that input's sub-score; the figure is the points it added to the 100-point composite (weight × sub-score).
- Cash flow +30.0/30.0
- 1% rule +10.0/10.0
- DSCR +10.0/10.0
- ARV discount +7.5/15.0
- Livability +3.2/5.0
- Schools +3.0/10.0
- Rent growth +2.5/5.0
- Condition / age +1.0/5.0
- Appreciation +0.0/10.0
$1,300,000
🖨 Deal sheet 📄 Offer letter ✓ Due diligence
Multi-family units
County records classify this as Multi-Family (5+ Unit). Listing-text estimate: 18 units. confirmed
5+ unit building — per-unit beds/baths from public records are typically unavailable; the breakdown below (if shown) is an estimate from the listing text.
Listing remarks MLS
Incredible GROWING investment opportunity in the heart of La Luz, New Mexico! This property offers an approximate cap rate over 7% and features 29 total spaces with existing meter infrastructure. Currently, 20 spaces are occupied by manufactured homes all separately metered with 11 of those homes already rehabbed, providing immediate income with additional upside. The property is also being improved monthly, with the current owner rehabbing one home every 30 days, increasing gross annual income by over $7,000 every 30 days. Situated on 3.46 acres, tenants enjoy a comfortable setting with convenient access to nearby Alamogordo's schools, shopping, and amenities, while still benefiting from the quiet charm of La Luz. With flexible management potential and room for future improvements, this
Key facts
- 3.46 acres
- Access to shopping
- Local amenities
Tags
Neighborhood map
What this means for you Summary
Snapshot
- This is a 18 × 3-bed/?-bath units multifamily listed at $1.30M. Condition is rated poor.
Deal economics
- At list price, monthly cash flow is $9k ($104k/yr) — positive. Per door: $483/mo.
- The deal already cash-flows at list — no discount required.
- Meets the 1% rule at list price ($22k rent vs $1.30M).
- Recommended offer: $1.14M (12.0% below list) — sets the bar for market timing.
Location & tenants
- Location reads 64/100 on livability (#70 in NM) — a middle-class / working-renter tenant base. Strengths: cost of living A+, housing B+; Watch: health & safety C-, schools F, amenities F.
- Alamogordo Public Schools (town): math 26% / reading 39% proficiency, ranked #26 of 95 in NM (top 27%) — families likely to look elsewhere, expect single-tenant / working-renter base with shorter leases.
- Market conditions: 35 active listings in the ZIP; 6 units permitted in Otero County in 2024 (0 in 5+ unit buildings).
Forward outlook
- Local home prices are declining (-3.0%/yr); year-one equity from $9k of loan paydown is wiped out by about $39k of value loss. Plan a longer hold.
- Otero County population projected to shrink 7% by 2050 — rents likely to lag national; underwrite the cash flow, not the appreciation.
- At projected returns (-3.0% appreciation + 3.0% rent growth), your $364k cash investment doubles in ~5 years — after that, you're playing with house money.
Negotiation context
- It's been on market 254 days — a 12% lower offer ($1.14M) is reasonable based on typical stale-listing flexibility.
Questions for the listing agent
- It's been on market 254 days. Have you received any prior offers? Is the seller open to a 12% concession, seller financing, or rate buy-down credit?
- Can we see the unit-by-unit rent roll, current vacancy, and any below-market leases? What's the average tenancy length?
- What capital expenditures (roof, boiler, parking lot, exteriors) have been made in the last 5 years, and what's planned in the next 2?
- Have any recent inspections been done? Can we get a copy of the seller's disclosures and any deferred-maintenance estimates?
- Why hasn't it sold? Are there any deal-killer items the seller is aware of (foundation, flood, title, zoning, code violations)?
- Is there a deadline driving the sale (1031 exchange, divorce, estate, relocation)? That informs how much negotiation room exists.
- Schools are F-rated, which usually means shorter tenancies and higher turnover. Who's the typical renter profile here, and what's been the actual vacancy rate?
- What's the average days-on-market for RENTAL listings here right now (not sales)? A rising rental-DOM trend means longer vacancies and softer asking-rent achievability than the comps imply.
- What's the recent tenant-quality profile in this submarket — average credit score on applications, eviction rate, late-payment / NSF rate, and stable-employment percentage? A property-management company in the area should have these aggregated.
- How much new apartment / multifamily construction is in the pipeline within 1–3 miles? Heavy new supply (>2% of stock underway) typically softens rents 12–24 months out; light construction supports rent growth.
Investment metrics
- 1% rule
- 1.72% ✓
- Cap rate
- 14.32%
- Cash-on-cash
- 28.67%
- DSCR
- 2.28
- GRM
- 4.8
CMA / ARV
No comps found within radius.
Projected returns pro-forma
-3.0% appreciation · 3.0% rent growth · sell at horizon
- IRR
- 23.0%
- Equity multiple
- 1.94×
- Total profit
- $343,597
- Equity at exit
- $193,834
- IRR
- 31.0%
- Equity multiple
- 3.79×
- Total profit
- $1,013,825
- Equity at exit
- $112,400
Cash invested: $364,000 (down + closing). Projections, not guarantees.
Landlord ↔ Tenant lean methodology
- Overall (STATE)
- 55 Moderately Landlord-Leaning
- State New Mexico
- 55 Moderately Landlord-Leaning · D+3
- County
- — inherits STATE
- City
- — inherits STATE
ZIP-level market 88337
- Home prices YoY
- -8.6%
- Active inventory
- 35
- Price-to-rent
- 87.1×
Monthly cashflow live
- Estimated rent
- $22,381 medium interval (Pro) →
- Mortgage (P&I)
- −$6,817
- Tax est. 1.5%
- −$1,625 /mo · $19,500/yr
- Insurance
- −$542
- HOA
- −$0
- Vacancy / Maint / Mgmt
- −$4,700
- Net cashflow
- $8,697
Break-even live
18-unit breakdown (identical units grouped — click to expand)
| Units | Beds | Baths | Est. rent |
|---|---|---|---|
| 18× units | 3 | — | $22,374 |
| #1 | 3 | — | $1,243 |
| #2 | 3 | — | $1,243 |
| #3 | 3 | — | $1,243 |
| #4 | 3 | — | $1,243 |
| #5 | 3 | — | $1,243 |
| #6 | 3 | — | $1,243 |
| #7 | 3 | — | $1,243 |
| #8 | 3 | — | $1,243 |
| #9 | 3 | — | $1,243 |
| #10 | 3 | — | $1,243 |
| #11 | 3 | — | $1,243 |
| #12 | 3 | — | $1,243 |
| #13 | 3 | — | $1,243 |
| #14 | 3 | — | $1,243 |
| #15 | 3 | — | $1,243 |
| #16 | 3 | — | $1,243 |
| #17 | 3 | — | $1,243 |
| #18 | 3 | — | $1,243 |
| Total (18 units) | $22,381 | ||
UW: 25.0% down · 7.5% · 30yr · 1.5% tax · 5.0% vac · 8.0% maint · 8.0% mgmt
Financing live
Cash to close
- Down payment
- $325,000
- Closing costs
- $39,000
- Reserves months
- —
- Total cash needed
- —
Loan-product check · same deal, 3 products live
Conventional
25% down · 7.5% · 30yr
- Down + closing
- —
- Monthly P&I
- —
- Monthly cashflow
- —
- DSCR
- —
- Eligible?
- —
Personal DTI + credit; lowest rate.
DSCR
20% down · 8.5% · 30yr
- Down + closing
- —
- Monthly P&I
- —
- Monthly cashflow
- —
- DSCR
- —
- Eligible?
- —
No personal income docs; deal must DSCR.
Hard money
10% down · 12.0% · 12mo
- Down + closing
- —
- Monthly P&I
- —
- Monthly cashflow
- —
- DSCR
- —
- Eligible?
- —
Short-term bridge; refi at stabilization.
Listing history 16 events
-
2026-06-18days on market $1,300,000 Active 254 DOM
-
2026-06-17days on market $1,300,000 Active 253 DOM
-
2026-06-16days on market $1,300,000 Active 252 DOM
-
2026-06-15days on market $1,300,000 Active 251 DOM
-
2026-06-13days on market $1,300,000 Active 249 DOM
-
2026-06-13days on market $1,300,000 Active 248 DOM
-
2026-06-10days on market $1,300,000 Active 246 DOM
-
2026-06-09days on market $1,300,000 Active 245 DOM
-
2026-06-08days on market $1,300,000 Active 244 DOM
-
2026-06-07days on market $1,300,000 Active 243 DOM
-
2026-06-05days on market $1,300,000 Active 240 DOM
-
2026-06-03days on market $1,300,000 Active 239 DOM
-
2026-06-03days on market $1,300,000 Active 238 DOM
-
2026-06-01days on market $1,300,000 Active 237 DOM
-
2026-05-31days on market $1,300,000 Active 236 DOM
-
2025-10-06$1,300,000 Active 798-char remark
Show marketing remark (798 chars)
Incredible GROWING investment opportunity in the heart of La Luz, New Mexico! This property offers an approximate cap rate over 7% and features 29 total spaces with existing meter infrastructure. Currently, 20 spaces are occupied by manufactured homes all separately metered with 11 of those homes already rehabbed, providing immediate income with additional upside. The property is also being improved monthly, with the current owner rehabbing one home every 30 days, increasing gross annual income by over $7,000 every 30 days. Situated on 3.46 acres, tenants enjoy a comfortable setting with convenient access to nearby Alamogordo's schools, shopping, and amenities, while still benefiting from the quiet charm of La Luz. With flexible management potential and room for future improvements, this
ⓘ Source: listings_history table (triggers on properties + properties_extension) + one-shot
backfill from property_details.listing_events for pre-trigger history.
Climate risk First Street
- Flood 1/10 Low FEMA zone X (unshaded) · 0% chance over 30 yrs
- Wildfire 4/10 Moderate
- Heat 4/10 Moderate 7 d/yr ≥96°F today · 24 d/yr by 30 yrs out
- Wind 1/10 Low
- Air quality 1/10 Low 0 unhealthy d/yr today · 0 by 30 yrs out
Nearby sold comps map
Loading sold comps map…
Walkable amenities ~0.75 mi
Loading nearby amenities…
Taxation est. · year 1
- Rental income
- $268,572
- − Mortgage interest
- −$72,820
- − Property taxes
- −$19,500
- − Insurance
- −$6,500
- − Repairs & maintenance
- −$21,486
- − Management
- −$21,486
- − Depreciation
- −$37,818
- Taxable income
- $88,962
- Est. tax owed @ 24.0%
- −$21,351
- After-tax cash flow
- $83,013/yr
For passive investors: Depreciation is non-cash, so a rental often shows a tax loss while cash-flowing — sheltering income. Rental losses are passive: they offset passive income freely, and up to $25,000/yr can offset ordinary (W-2) income if you actively participate and your MAGI is under $100k (phasing out to $0 by $150k); unused losses carry forward. On sale, claimed depreciation is recaptured at up to 25%, and gains may owe capital-gains tax (a 1031 exchange can defer both). Figures are a year-1 estimate at your 24.0% rate — not tax advice; consult a CPA.
Condition & rehab AI · 12 photos
This multi-family property in La Luz, NM, requires extensive repairs and updates to improve its condition and increase its resale and rental value.
Repairs flagged
- Major Roof replacement — Structural damage visible on multiple roofs.
- Major Exterior siding repair — Significant wear and tear on siding.
- Major Interior wall repairs — Visible cracks and damage on interior walls.
- Major Flooring replacement — Worn and damaged flooring in multiple units.
- Major Kitchen and bathroom updates — No visible photos of kitchens and bathrooms.
- Major HVAC and mechanical updates — No visible photos of HVAC and mechanical systems.
- Major Landscaping and curb appeal improvements — Overgrown vegetation and lack of curb appeal.
- Major Foundation and structural repairs — No visible photos of foundations and structures, but structural issues are implied by the overall condition of the property.
Value-add opportunities
- Both Roof replacement — Improves both resale and rental value by addressing a major structural issue.
- Both Exterior siding repair — Enhances curb appeal and property value.
- Both Interior wall repairs — Improves the overall condition and appearance of the property.
- Both Flooring replacement — Enhances the living experience and property value.
- Both Kitchen and bathroom updates — Improves the functionality and appeal of the property.
- Both HVAC and mechanical updates — Ensures the property is energy-efficient and comfortable.
- Both Landscaping and curb appeal improvements — Enhances the overall appearance and appeal of the property.
- Both Foundation and structural repairs — Ensures the property is safe and structurally sound, improving both resale and rental value.
Renovation cost estimate screening
| Repair item | Severity | Est. cost |
|---|---|---|
| Roof replacement · Structural damage visible on multiple roofs. | Major | $15,000–50,000 |
| Exterior siding repair · Significant wear and tear on siding. | Major | $15,000–50,000 |
| Interior wall repairs · Visible cracks and damage on interior walls. | Major | $15,000–50,000 |
| Flooring replacement · Worn and damaged flooring in multiple units. | Major | $15,000–50,000 |
| Kitchen and bathroom updates · No visible photos of kitchens and bathrooms. | Major | $15,000–50,000 |
| HVAC and mechanical updates · No visible photos of HVAC and mechanical systems. | Major | $15,000–50,000 |
| Landscaping and curb appeal improvements · Overgrown vegetation and lack of curb appeal. | Major | $15,000–50,000 |
| Foundation and structural repairs · No visible photos of foundations and structures, but structural issues are implied by the overall condition of the property. | Major | $15,000–50,000 |
| Total estimated repair cost · 8 items | $120,000–400,000 |
Value-add ROI direction
- Both Roof replacement — Improves both resale and rental value by addressing a major structural issue. ↑
- Both Exterior siding repair — Enhances curb appeal and property value. ↑
- Both Interior wall repairs — Improves the overall condition and appearance of the property. ↑
- Both Flooring replacement — Enhances the living experience and property value. ↑
- Both Kitchen and bathroom updates — Improves the functionality and appeal of the property. ↑
- Both HVAC and mechanical updates — Ensures the property is energy-efficient and comfortable. ↑
- Both Landscaping and curb appeal improvements — Enhances the overall appearance and appeal of the property. ↑
- Both Foundation and structural repairs — Ensures the property is safe and structurally sound, improving both resale and rental value. ↑
ⓘ Cost ranges are severity-bucket heuristics (US national rule-of-thumb). Get contractor quotes + a written scope before underwriting a rehab budget.
Schools (NCES district)
- District
- Alamogordo Public Schools
- NCES district ID
- 3500030
- Math proficiency
- 26% —
- Reading proficiency
- 39% —
- Median HH income
- $42,194
- Composite
- 30.24/100
- National rank
- #11572
- State rank
- #26 of 95 in NM
Livability — La Luz
- Score
- 64/100
- State rank
- #70
- US rank
- #14588
Category grades
Schools grade is shown separately in the Schools card above.
Census & demographics
- Census place
- La Luz, NM
- Population (ZIP)
- 1,945
Population outlook (Otero County) Hauer SSP2
- Today (2025)
- 62,967 people
- By 2030
- 62,164 · -1.3%
- By 2040
- 60,253 · -4.3%
- By 2050
- 58,575 · -7.0%
- By 2075
- 55,411 · -12.0%
- By 2100
- 48,551 · -22.9%
Race, ethnicity, and origin ACS 2023
- Neighborhood character
- Predominantly White (70%)
- Race & ethnicity
- White 70% Hispanic / Latino 27% Two or more races 19%
- Hispanic origin (detail)
- Mexican 20% Puerto Rican 3%
- Common ancestry
- Iranian 3% Lithuanian 2% Portuguese 1%
- Languages at home
- 93% English-only · Spanish 7%
Political lean MEDSL · Otero
- 2024 margin
- Strong R (+27.0) · D 35.4% · R 62.4% · Other 2.2%
- 2008→2024 swing
- -7.7pp toward R · 2008: -19.3pp · 2024: -27.0pp
- All cycles
- 2024: R+27.0 2020: R+25.6 2016: R+29.1 2012: R+28.0 2008: R+19.3
Not yet ingested
- Civics
- —
Market trends
- HPI YoY
- ▼ -15.41%
- Current HPI
- 163.7641
- Rent YoY
- —
- Metro
- —
- State GDP YoY
- —
- F500 in state
- 0
Price history
1 event — show timeline
- 2025-10-06 Listed $1,300,000 Southwest MLS
Cash-flow waterfall
monthlySold comps — $/sqft
last 12 mo · ≤1 miLoading sold comps…