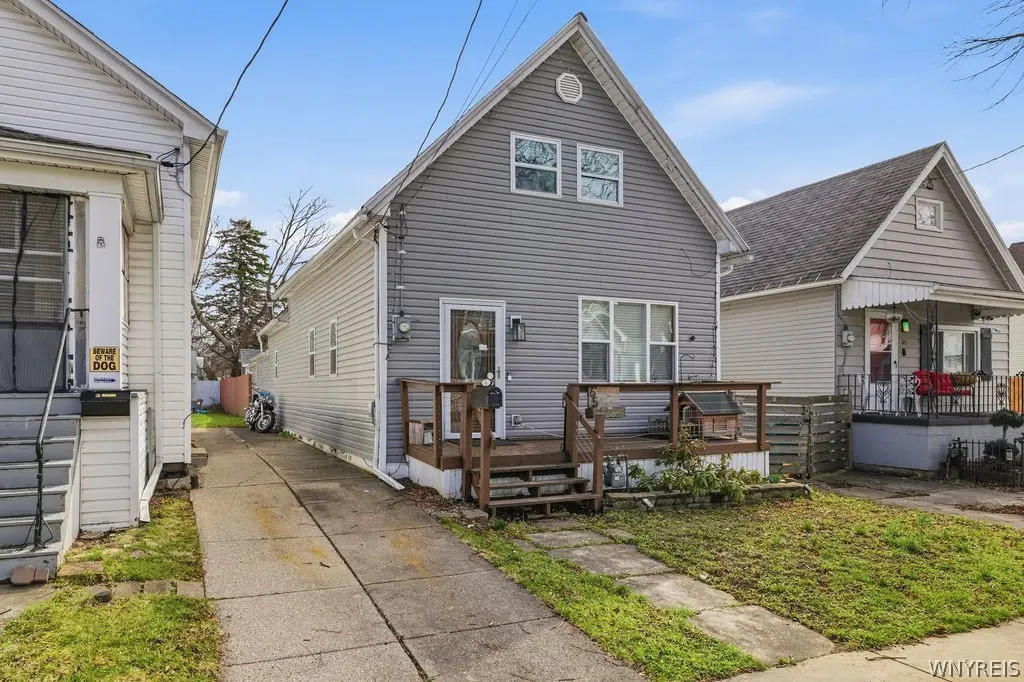
65 Benzinger St · Buffalo, NY
Flood risk 5/10 · Moderate
- FEMA flood zone
- X (unshaded)
- Chance of flooding over 30 yrs
- 0.24%
- Est. flood insurance / yr
- $507 – $1,088
Fire risk 1/10 · Minimal
- Est. fire insurance / yr
- $691 – $1,283
Heat risk 3/10 · Minor
- Hot days now (above 92°F)
- 7 days/yr
- Hot days in 30 yrs
- 15 days/yr
Wind risk 1/10 · Minimal
- Chance of severe wind over 30 yrs
- —
Air-quality risk 3/10 · Minor
- Unhealthy air days now
- 2 days/yr
- Unhealthy air days in 30 yrs
- 3 days/yr
Risk factors via First Street. Map © Google.
Why this score? — see what drove the C+ grade
The composite is a weighted blend of 9 inputs, each scored 0–100. Each bar is that input's sub-score; the figure is the points it added to the 100-point composite (weight × sub-score).
- Cash flow +15.2/30.0
- ARV discount +15.0/15.0
- Appreciation +9.0/10.0
- DSCR +4.7/10.0
- 1% rule +4.2/10.0
- Livability +3.9/5.0
- Schools +3.3/10.0
- Rent growth +2.5/5.0
- Condition / age +2.5/5.0
$149,900
🖨 Deal sheet 📄 Offer letter ✓ Due diligence
Listing remarks MLS
Make sure to check out the Interactive Virtual Tour with Floor plan on this completely updated 4 bed; 1212 sq ft 2-story home in Lovejoy. This is not a flip, this house has been updated and lived in by the owners. Roof 2010/2015, AC 2020, Vinyl siding 2013, back deck 2014, huge shed with rock climbing wall 2019, solid hardwood hickory floors. 1st floor laundry. Fully fenced yard.
Key facts
- 4,020 sq ft lot
- Built 1890
- Listed 3 days
Property features AI
Exterior
- Parking: No garage
- Utilities: Public water connected; Sewer connected
- Home design: Single-story; Resale property; Vinyl siding
- Construction: Vinyl siding
- Exterior features: See remarks
Interior
- Kitchen: Gas oven; Gas range; Microwave; Refrigerator
- Bedrooms: 2 main-level bedrooms
- Flooring: Carpet; Hardwood; Vinyl; Varies
- Bathrooms: 1 full bathroom (main level)
- Heating & cooling: Gas heating; Baseboard heating
- Interior features: Separate/formal dining room; Separate/formal living room; Home office; Kitchen island; Storage; Walk-in pantry; Bedroom on main level
- Laundry & utility: Main-level laundry; Gas water heater
Neighborhood map
What this means for you Summary
Snapshot
- This is a 3-bed/1.0-bath single-family listed at $150k.
Deal economics
- At list price, monthly cash flow is $52 ($627/yr) — positive.
- The deal already cash-flows at list — no discount required.
- To meet the 1% rule (rent ≥ 1% of price), the offer needs to be $138k (8.1% below list).
- Recommended offer: $138k (8.1% below list) — sets the bar for 1% rule.
Location & tenants
- Location reads 77/100 on livability (#195 in NY, #3,011 nationally) — a middle-class / working-renter tenant base. Strengths: commute A+, housing A+, health & safety A+; Watch: crime F, employment D-.
- Buffalo City School District (urban): math 41% / reading 40% proficiency, ranked #535 of 590 in NY (top 91%) — families likely to look elsewhere, expect single-tenant / working-renter base with shorter leases; 75% free/reduced lunch — lower-income household profile, screen leases tightly.
- Market conditions: 169 active listings in the ZIP; 3 comparable units currently listed for rent nearby; rentals at typical pace (median 24d on market — plan ~3-4 weeks tenant-placement turnaround); 1,244 units permitted in Erie County in 2024 (563 in 5+ unit buildings).
- This rent runs 33% of the median local income ($50k/yr) — at the standard rent-burdened threshold; future hikes will face affordability resistance.
Forward outlook
- In year one you build about $13k of equity ($1k loan paydown + $12k appreciation (8.1% local appreciation)).
- At projected returns (8.1% appreciation + 3.0% rent growth), your $42k cash investment doubles in ~3 years — after that, you're playing with house money.
- By year 3, paydown + projected appreciation supports a ~$33k cash-out refi (75% LTV) — recoverable capital for the next deal without selling this one.
Negotiation context
- Only 3 days on market — expect competitive offers; lowballing is unlikely to land.
- 3 sale attempts since 16y ago with the ask held roughly flat each time — persistent listings suggest the price (not the market) is what's stuck; bring a comps-based counter.
Risks & watch-outs
- Watch-outs: built in 1890 — expect roof / HVAC / electrical / plumbing capex.
- Climate carrying-cost: moderate flood risk — expect insurance premiums to compound above CPI over the hold.
Questions for the listing agent
- Built in 1890 — when were the roof, HVAC, electrical panel, plumbing, and water heater last replaced?
- Is there a deadline driving the sale (1031 exchange, divorce, estate, relocation)? That informs how much negotiation room exists.
- Crime grade is F in this area — have there been break-ins, vandalism, or insurance claims at this property in the last 3 years? What carrier currently insures it and at what premium?
- What's the average days-on-market for RENTAL listings here right now (not sales)? A rising rental-DOM trend means longer vacancies and softer asking-rent achievability than the comps imply.
- What's the recent tenant-quality profile in this submarket — average credit score on applications, eviction rate, late-payment / NSF rate, and stable-employment percentage? A property-management company in the area should have these aggregated.
- How much new for-sale + rental construction is in the pipeline within 1–3 miles? Heavy new supply typically softens prices + rents 12–24 months out; constrained supply supports both.
Investment metrics
- 1% rule
- 0.92% ✗
- Cap rate
- 6.71%
- Cash-on-cash
- 1.49%
- DSCR
- 1.07
- GRM
- 9.1
CMA / ARV
- ARV (on-the-fly)
- $180,600
- Comps found
- 12
Show comp detail 12 sales within ~0.75 mi
| Address | Dist | Beds/Ba | Sqft | Sold | Price | $/sf | Match |
|---|---|---|---|---|---|---|---|
| 29 Bogardus St | 0.38mi | 3/1.0 | 1,092 (+6%) | 10mo | $150,000 | $137 | 64 |
| 302 N Pleasant Pkwy | 0.57mi | 3/1.0 | 1,000 (-3%) | 7mo | $185,000 | $185 | 62 |
| 67 Gold St | 0.06mi | 3/2.0 | 1,183 (+15%) | 8mo | $103,500 | $87 | 62 |
| 74 Vanderbilt St | 0.42mi | 3/1.0 | 1,136 (+10%) | 3mo | $105,000 | $92 | 62 |
| 379 N Ogden St Unit E | 0.67mi | 3/1.0 | 1,083 (+5%) | 3mo | $160,000 | $148 | 58 |
| 105 Regent St | 0.38mi | 3/2.0 | 1,138 (+10%) | 6mo | $110,000 | $97 | 56 |
| 275 N Willowlawn Pkwy | 0.67mi | 3/1.0 | 948 (-8%) | 2mo | $215,000 | $227 | 54 |
| 324 Ideal St | 0.50mi | 4/2.0 (+1) | 1,092 (+6%) | 6mo | $195,000 | $179 | 53 |
| 31 Central Ave | 0.47mi | 3/1.0 | 879 (-15%) | 1mo | $35,000 | $40 | 52 |
| 391 Greene St | 0.65mi | 3/1.0 | 1,144 (+11%) | 2mo | $200,000 | $175 | 50 |
| 169 Lackawanna Ave | 0.74mi | 3/1.5 | 1,116 (+8%) | 10mo | $220,000 | $197 | 42 |
| 126 Claude Dr | 0.74mi | 3/1.0 | 897 (-13%) | 10mo | $194,500 | $217 | 35 |
Match score weights: distance 35% · size 25% · config 20% · recency 20%. Top-matched comps best support the ARV.
Projected returns pro-forma
8.06% appreciation · 3.0% rent growth · sell at horizon
- IRR
- 21.3%
- Equity multiple
- 2.56×
- Total profit
- $65,658
- Equity at exit
- $114,479
- IRR
- 19.6%
- Equity multiple
- 5.48×
- Total profit
- $188,089
- Equity at exit
- $227,810
Cash invested: $41,972 (down + closing). Projections, not guarantees.
Landlord ↔ Tenant lean methodology
- Overall (STATE)
- 15 Strongly Tenant-Friendly
- State New York
- 15 Strongly Tenant-Friendly · D+10
- County
- — inherits STATE
- City
- — inherits STATE
ZIP-level market 14206
- Home prices YoY
- 1.8%
- Active inventory
- 169
- Price-to-rent
- 9.1×
Monthly cashflow live
- Estimated rent
- $1,377 medium interval (Pro) →
- Mortgage (P&I)
- −$786
- Tax est. 1.5%
- −$187 /mo · $2,248/yr
- Insurance
- −$62
- HOA
- −$0
- Vacancy / Maint / Mgmt
- −$289
- Net cashflow
- $52
Break-even live
UW: 25.0% down · 7.5% · 30yr · 1.5% tax · 5.0% vac · 8.0% maint · 8.0% mgmt
Financing live
Cash to close
- Down payment
- $37,475
- Closing costs
- $4,497
- Reserves months
- —
- Total cash needed
- —
Loan-product check · same deal, 3 products live
Conventional
25% down · 7.5% · 30yr
- Down + closing
- —
- Monthly P&I
- —
- Monthly cashflow
- —
- DSCR
- —
- Eligible?
- —
Personal DTI + credit; lowest rate.
DSCR
20% down · 8.5% · 30yr
- Down + closing
- —
- Monthly P&I
- —
- Monthly cashflow
- —
- DSCR
- —
- Eligible?
- —
No personal income docs; deal must DSCR.
Hard money
10% down · 12.0% · 12mo
- Down + closing
- —
- Monthly P&I
- —
- Monthly cashflow
- —
- DSCR
- —
- Eligible?
- —
Short-term bridge; refi at stabilization.
Rent comps 3 comps
| Address | Beds | Baths | Sqft | Rent | $/sqft | DOM | Units | Dist |
|---|---|---|---|---|---|---|---|---|
| 1150 Bailey Ave Buffalo, NY | 4.0 | 1.5 | 1100 | $1,200 | $1.09 | 23d | 1 | 0.44mi |
| 1777 Broadway Unit 2 Buffalo, NY | 3.0 | 1.0 | 1300 | $1,200 | $0.92 | 43d | 1 | 0.73mi |
| 14 Rutland Ave Buffalo, NY | 4.0 | 1.0 | 1430 | $2,200 | $1.54 | 10d | 1 | 1.18mi |
Listing history 9 events
-
2026-04-10status Pending
-
2026-04-07$149,900 Active
-
2020-11-20soldstatus $140,000
-
2020-11-19soldstatus $130,000 Closed Sale or Rented 382-char remark
Show marketing remark (382 chars)
Make sure to check out the Interactive Virtual Tour with Floor plan on this completely updated 4 bed; 1212 sq ft 2-story home in Lovejoy. This is not a flip, this house has been updated and lived in by the owners. Roof 2010/2015, AC 2020, Vinyl siding 2013, back deck 2014, huge shed with rock climbing wall 2019, solid hardwood hickory floors. 1st floor laundry. Fully fenced yard.
-
2020-10-01status Pending Sale 382-char remark
Show marketing remark (382 chars)
Make sure to check out the Interactive Virtual Tour with Floor plan on this completely updated 4 bed; 1212 sq ft 2-story home in Lovejoy. This is not a flip, this house has been updated and lived in by the owners. Roof 2010/2015, AC 2020, Vinyl siding 2013, back deck 2014, huge shed with rock climbing wall 2019, solid hardwood hickory floors. 1st floor laundry. Fully fenced yard.
-
2020-08-25status Under Contract- Do Not Show 382-char remark
Show marketing remark (382 chars)
Make sure to check out the Interactive Virtual Tour with Floor plan on this completely updated 4 bed; 1212 sq ft 2-story home in Lovejoy. This is not a flip, this house has been updated and lived in by the owners. Roof 2010/2015, AC 2020, Vinyl siding 2013, back deck 2014, huge shed with rock climbing wall 2019, solid hardwood hickory floors. 1st floor laundry. Fully fenced yard.
-
2020-08-20$130,000 Active 382-char remark
Show marketing remark (382 chars)
Make sure to check out the Interactive Virtual Tour with Floor plan on this completely updated 4 bed; 1212 sq ft 2-story home in Lovejoy. This is not a flip, this house has been updated and lived in by the owners. Roof 2010/2015, AC 2020, Vinyl siding 2013, back deck 2014, huge shed with rock climbing wall 2019, solid hardwood hickory floors. 1st floor laundry. Fully fenced yard.
-
2010-04-05soldstatus $11,500 303-char remark
Show marketing remark (303 chars)
LOVEJOY SINGLE FAMILY HOME. GREAT STARTER OR RENTAL PROPERTY FOR A SUPER LOW PRICE. OFF STREET PARKING. UPDATED ELECTRIC. SOME ELBOW GREASE AND PAINT WILL GIVE THIS HOUSE A WHOLE NEW LOOK. NEWER BOILER AND HWT. 4 BEDROOMS. SOLD WAY BELOW ASSESSED VALUE. * * REHAB NEEDED - SOLD "AS IS" * *
-
2010-01-04$12,500 303-char remark
Show marketing remark (303 chars)
LOVEJOY SINGLE FAMILY HOME. GREAT STARTER OR RENTAL PROPERTY FOR A SUPER LOW PRICE. OFF STREET PARKING. UPDATED ELECTRIC. SOME ELBOW GREASE AND PAINT WILL GIVE THIS HOUSE A WHOLE NEW LOOK. NEWER BOILER AND HWT. 4 BEDROOMS. SOLD WAY BELOW ASSESSED VALUE. * * REHAB NEEDED - SOLD "AS IS" * *
ⓘ Source: listings_history table (triggers on properties + properties_extension) + one-shot
backfill from property_details.listing_events for pre-trigger history.
Climate risk First Street
- Flood 5/10 Major FEMA zone X (unshaded) · 24% chance over 30 yrs
- Wildfire 1/10 Low
- Heat 3/10 Moderate 7 d/yr ≥92°F today · 15 d/yr by 30 yrs out
- Wind 1/10 Low
- Air quality 3/10 Moderate 2 unhealthy d/yr today · 3 by 30 yrs out
Nearby sold comps map
Loading sold comps map…
Walkable amenities ~0.75 mi
Loading nearby amenities…
Taxation est. · year 1
- Rental income
- $16,529
- − Mortgage interest
- −$8,397
- − Property taxes
- −$2,248
- − Insurance
- −$750
- − Repairs & maintenance
- −$1,322
- − Management
- −$1,322
- − Depreciation
- −$4,361
- Taxable loss
- −$1,871
- Est. tax savings @ 24.0%
- +$449
- After-tax cash flow
- $1,076/yr
For passive investors: Depreciation is non-cash, so a rental often shows a tax loss while cash-flowing — sheltering income. Rental losses are passive: they offset passive income freely, and up to $25,000/yr can offset ordinary (W-2) income if you actively participate and your MAGI is under $100k (phasing out to $0 by $150k); unused losses carry forward. On sale, claimed depreciation is recaptured at up to 25%, and gains may owe capital-gains tax (a 1031 exchange can defer both). Figures are a year-1 estimate at your 24.0% rate — not tax advice; consult a CPA.
Schools (NCES district)
- District
- Buffalo City School District
- NCES district ID
- 3605850
- Math proficiency
- 41% ▲ 11.00%
- Reading proficiency
- 40% ▲ 7.00%
- Median HH income
- $31,665
- Composite
- 33.17/100
- National rank
- #5544
- State rank
- #535 of 590 in NY
Livability — Buffalo
- Score
- 77/100
- State rank
- #195
- US rank
- #3011
Category grades
Schools grade is shown separately in the Schools card above.
Census & demographics
- Census place
- Buffalo, NY
- County
- Erie County · 714,559 people
- City population
- 440,021
- Metro
- Buffalo-Cheektowaga, NY
- Population (ZIP)
- 21,631
- Household income
- $50,450
- Rent vs Own
- Severe rent burden
- 841.0
Population outlook (Erie County) Hauer SSP2
- Today (2025)
- 933,037 people
- By 2030
- 935,181 · +0.2%
- By 2040
- 928,531 · -0.5%
- By 2050
- 905,725 · -2.9%
- By 2075
- 834,037 · -10.6%
- By 2100
- 708,033 · -24.1%
Race, ethnicity, and origin ACS 2023
- Neighborhood character
- Majority White (65%)
- Race & ethnicity
- White 65% Hispanic / Latino 13% Black 12% Two or more races 8% Asian 4%
- Hispanic origin (detail)
- Mexican 2% Puerto Rican 10%
- Common ancestry
- Romanian 25% Lithuanian 1% Italian 1%
- Foreign-born
- 6% · Canada, China
- Languages at home
- 88% English-only · Spanish 5% Other Indo-European 3% Arabic 2%
Political lean MEDSL · Erie
- 2024 margin
- Lean D (+9.7) · D 54.8% · R 45.2%
- 2008→2024 swing
- -7.9pp toward R · 2008: 17.5pp · 2024: 9.7pp
- All cycles
- 2024: D+9.7 2020: D+14.7 2016: D+4.8 2012: D+15.6 2008: D+17.5
Not yet ingested
- Civics
- —
Market trends
- HPI YoY
- ▲ 8.06%
- Current HPI
- 457.3935
- Rent YoY
- —
- Metro
- Buffalo-Cheektowaga, NY
- State GDP YoY
- ▲ 2.60%
- F500 in state
- 92
Industry mix (Fortune 500 HQ in NY)
| Industry | F500 HQs | Revenue |
|---|---|---|
| Financial Services | 10 | $950B |
|
||
| Consumer Goods | 9 | $162B |
|
||
| Insurance | 4 | $225B |
|
||
| Telecommunications | 2 | $144B |
|
||
| Pharmaceuticals | 2 | $112B |
|
||
| Media / Entertainment | 2 | $69B |
|
||
Price history
+1099.2% since first listed9 events — show timeline
- 2026-04-10 Pending — WNYREIS
- 2026-04-07 Listed $149,900 WNYREIS
- 2020-11-20 Sold (Public Records) $140,000 Public Records
- 2020-11-19 Sold (MLS) $130,000 WNYREIS
- 2020-10-01 Pending — WNYREIS
- 2020-08-25 Pending — WNYREIS
- 2020-08-20 Listed $130,000 WNYREIS
- 2010-04-05 Sold (MLS) $11,500 WNYREIS
- 2010-01-04 Listed $12,500 WNYREIS
Property tax history
+1.7%/yrLatest (2025): $263 · +0.0% YoY. Source: county tax records.
Cash-flow waterfall
monthlySold comps — $/sqft
last 12 mo · ≤1 miLoading sold comps…