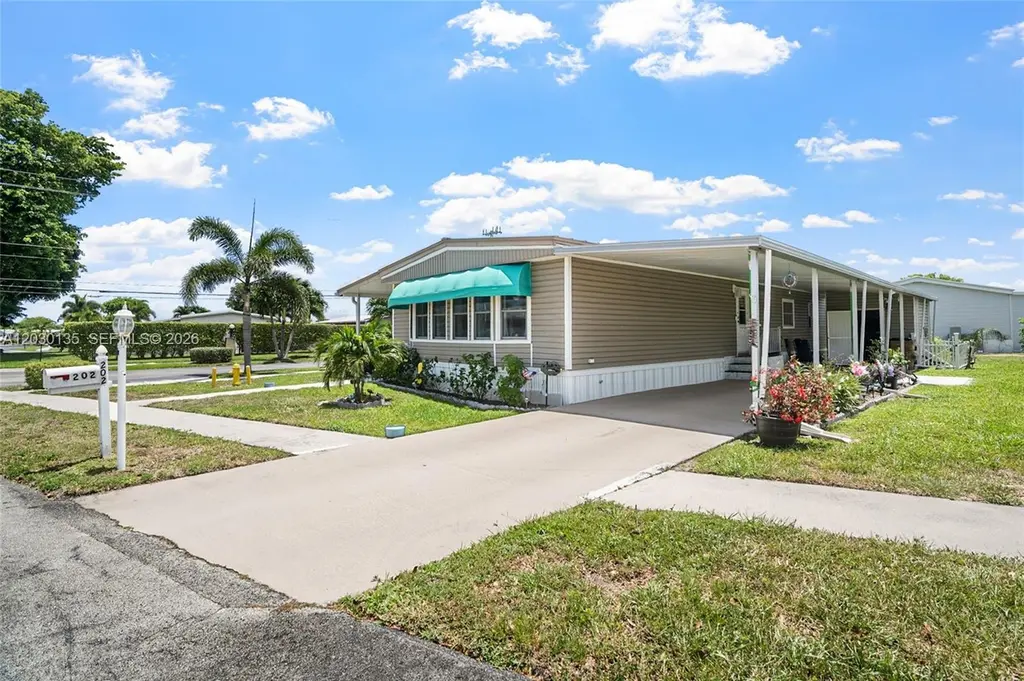
202 NW 52nd Ct · Deerfield Beach, FL
Flood risk 3/10 · Minor
- FEMA flood zone
- X (shaded)
- Chance of flooding over 30 yrs
- 0.1%
- Est. flood insurance / yr
- $507 – $1,088
Fire risk 1/10 · Minimal
- Est. fire insurance / yr
- $947 – $1,759
Heat risk 9/10 · Severe
- Hot days now (above 107°F)
- 6 days/yr
- Hot days in 30 yrs
- 21 days/yr
Wind risk 10/10 · Severe
- Chance of severe wind over 30 yrs
- 99.0%
Air-quality risk 2/10 · Minimal
- Unhealthy air days now
- 1 days/yr
- Unhealthy air days in 30 yrs
- 3 days/yr
Risk factors via First Street. Map © Google.
Why this score? — see what drove the C grade
The composite is a weighted blend of 9 inputs, each scored 0–100. Each bar is that input's sub-score; the figure is the points it added to the 100-point composite (weight × sub-score).
- Cash flow +18.9/30.0
- ARV discount +15.0/15.0
- DSCR +5.9/10.0
- 1% rule +5.7/10.0
- Schools +4.1/10.0
- Livability +3.8/5.0
- Rent growth +2.9/5.0
- Condition / age +2.5/5.0
- Appreciation +0.0/10.0
$235,000
🖨 Deal sheet 📄 Offer letter ✓ Due diligence
Listing remarks MLS
THE LAND IS INCLUDED! A beautifully decorated 2 bedroom, 2 bathroom manufactured home in the meticulously maintained adult (55+), gated community of Highland Meadows Estates on a 5,746 sq. ft. corner lot. This large 24x56 offers: Partial Impact windows and doors, open island kitchen w/ new counter tops, beautiful new floors, storage shed, a large living room, screened in porch with new hurricane shutters, a separate shed/storage building, a new 1 ton mini split AC system backup + a 3 ton AC, new electrical panel outdoor & indoor, 2 car covered driveway, lots of natural lighting and a BRAND NEW METAL ROOF. Located within a short walking distance to all the community has to offer: clubhouse, heated pool, tennis court, park and more. Low association fee of just $355 quarterl
Key facts
- Gated community
- Metal roof
- Hurricane shutters
Tags
Property features AI
Finance
- HOA & community: Homeowners association (quarterly fee); Association fee $385 quarterly; Gated community with clubhouse, fitness center, shuffleboard, tennis courts, and pool; Senior community
Exterior
- Parking: Attached carport (1 covered space); Driveway; Parking pad; Has carport (1 space)
- Security: Security gate
- Utilities: Generator hookup for electric; Public water; Public sewer
- Home design: Manufactured home; Single-story; Faces north; Resale
- Construction: Metal roof; Manufactured construction; Make/Model: HIGHLAND
- Exterior features: Patio; Community pool
Interior
- Kitchen: Dishwasher; Electric range; Microwave; Disposal; Refrigerator; Kitchen island
- Bedrooms: Bedroom on main level
- Flooring: Ceramic tile; Hardwood; Wood
- Bathrooms: 2 full bathrooms
- Heating & cooling: Central air (electric); Electric heating
- Interior features: Impact glass windows; Furnished; Built-in features; Kitchen island; Walk-in closet(s)
- Laundry & utility: Washer; Dryer
Neighborhood map
What this means for you Summary
Snapshot
- This is a 2-bed/2.0-bath manufactured listed at $235k.
Deal economics
- At list price, monthly cash flow is $240 ($3k/yr) — positive.
- The deal already cash-flows at list — no discount required.
- Meets the 1% rule at list price ($3k rent vs $235k).
- Recommended offer: $231k (1.5% below list) — sets the bar for market timing.
- Cap rate 7.5% vs local median 4.2% in Deerfield Beach — top-decile yield for the area; either an underpriced asset or a hidden risk that comps aren't pricing in. Stress-test before assuming the spread holds.
Location & tenants
- Location reads 75/100 on livability (#250 in FL, #3,970 nationally) — a middle-class / working-renter tenant base. Strengths: housing A+, health & safety A+, cost of living A; Watch: schools D-, amenities D-, employment D-.
- Broward (suburban): math 42% / reading 53% proficiency, ranked #46 of 73 in FL (top 63%) — families likely to look elsewhere, expect single-tenant / working-renter base with shorter leases.
- Market conditions: Rents rising (+1.8%/yr); 591 active listings in the ZIP; 40 comparable units currently listed for rent nearby; rentals at typical pace (median 25d on market — plan ~3-4 weeks tenant-placement turnaround); 2,111 units permitted in Broward County in 2024 (1,265 in 5+ unit buildings).
- This rent runs 42% of the median local income ($71k/yr) — at the standard rent-burdened threshold; future hikes will face affordability resistance.
Forward outlook
- Local home prices are declining (-3.0%/yr); year-one equity from $2k of loan paydown is wiped out by about $7k of value loss. Plan a longer hold.
- Broward County population projected at +34% by 2050 — long-run rental-demand tailwind backs the buy-and-hold thesis.
Negotiation context
- It's been on market 15 days — a 2% lower offer ($231k) is reasonable based on typical stale-listing flexibility.
- 6 sale attempts since 5y ago with the ask held roughly flat each time — persistent listings suggest the price (not the market) is what's stuck; bring a comps-based counter.
Risks & watch-outs
- Climate carrying-cost: severe wind risk, 99% chance of damaging wind over 30y; extreme-heat days projected 6→21/yr by 2055 (HVAC capex compounding) — expect insurance premiums to compound above CPI over the hold.
Questions for the listing agent
- What does the HOA fee cover, when was the last increase, and are there any pending special assessments or reserve-fund shortfalls?
- Is there a deadline driving the sale (1031 exchange, divorce, estate, relocation)? That informs how much negotiation room exists.
- Schools are D-rated, which usually means shorter tenancies and higher turnover. Who's the typical renter profile here, and what's been the actual vacancy rate?
- What's the average days-on-market for RENTAL listings here right now (not sales)? A rising rental-DOM trend means longer vacancies and softer asking-rent achievability than the comps imply.
- What's the recent tenant-quality profile in this submarket — average credit score on applications, eviction rate, late-payment / NSF rate, and stable-employment percentage? A property-management company in the area should have these aggregated.
- How much new for-sale + rental construction is in the pipeline within 1–3 miles? Heavy new supply typically softens prices + rents 12–24 months out; constrained supply supports both.
Investment metrics
- 1% rule
- 1.07% ✓
- Cap rate
- 7.52%
- Cash-on-cash
- 4.37%
- DSCR
- 1.19
- GRM
- 7.8
CMA / ARV
- ARV (on-the-fly)
- $294,822
- Comps found
- 2
Show comp detail 2 sales within ~0.75 mi
| Address | Dist | Beds/Ba | Sqft | Sold | Price | $/sf | Match |
|---|---|---|---|---|---|---|---|
| 261 NW 53rd Ct | 0.12mi | 2/2.0 | 1,300 (-13%) | 2mo | $210,000 | $162 | 72 |
| 126 NW 51st St | 0.16mi | 2/2.0 | 1,389 (-7%) | 23mo | $275,000 | $198 | 62 |
Match score weights: distance 35% · size 25% · config 20% · recency 20%. Top-matched comps best support the ARV.
Projected returns pro-forma
-3.0% appreciation · 1.75% rent growth · sell at horizon
- IRR
- -10.9%
- Equity multiple
- 0.61×
- Total profit
- $-25,826
- Equity at exit
- $35,039
- IRR
- -3.6%
- Equity multiple
- 0.77×
- Total profit
- $-14,862
- Equity at exit
- $20,319
Cash invested: $65,800 (down + closing). Projections, not guarantees.
Landlord ↔ Tenant lean methodology
- Overall (STATE)
- 87 Strongly Landlord-Friendly
- State Florida
- 87 Strongly Landlord-Friendly · R+3
- County
- — inherits STATE
- City
- — inherits STATE
ZIP-level market 33064
- Home prices YoY
- -18.7%
- Rents YoY
- 1.8%
- Active inventory
- 591
- Price-to-rent
- 7.8×
Monthly cashflow live
- Estimated rent
- $2,509 high interval (Pro) →
- Mortgage (P&I)
- −$1,232
- Tax from tax record
- −$285 /mo · $3,415/yr
- Insurance
- −$98
- HOA
- −$128
- Vacancy / Maint / Mgmt
- −$527
- Net cashflow
- $240
Break-even live
UW: 25.0% down · 7.5% · 30yr · 1.5% tax · 5.0% vac · 8.0% maint · 8.0% mgmt
Financing live
Cash to close
- Down payment
- $58,750
- Closing costs
- $7,050
- Reserves months
- —
- Total cash needed
- —
Loan-product check · same deal, 3 products live
Conventional
25% down · 7.5% · 30yr
- Down + closing
- —
- Monthly P&I
- —
- Monthly cashflow
- —
- DSCR
- —
- Eligible?
- —
Personal DTI + credit; lowest rate.
DSCR
20% down · 8.5% · 30yr
- Down + closing
- —
- Monthly P&I
- —
- Monthly cashflow
- —
- DSCR
- —
- Eligible?
- —
No personal income docs; deal must DSCR.
Hard money
10% down · 12.0% · 12mo
- Down + closing
- —
- Monthly P&I
- —
- Monthly cashflow
- —
- DSCR
- —
- Eligible?
- —
Short-term bridge; refi at stabilization.
Rent comps 40 comps
| Address | Beds | Baths | Sqft | Rent | $/sqft | DOM | Units | Dist |
|---|---|---|---|---|---|---|---|---|
| 1929 SW 15th St #41 Deerfield Beach, FL | 2.0 | 2.0 | 1150 | $2,400 | $2.09 | 24d | 1 | 0.33mi |
| 1947 Discovery Cir E Deerfield Beach, FL | 2.0 | 2.0 | 1126 | $2,450 | $2.18 | 24d | 1 | 0.42mi |
| 2067 SW 15th St Deerfield Beach, FL | 2.0 | 2.0 | 1150 | $2,300 | $2.00 | 20d | 2 | 0.43mi |
| 4905 NE 2nd Way Pompano Beach, FL | 2.0 | 1.0 | 1100 | $2,150 | $1.95 | 24d | 1 | 0.44mi |
| 640 Cypress Club Way Unit G Pompano Beach, FL | 2.0 | 2.0 | 891 | $1,950 | $2.19 | 24d | 1 | 0.48mi |
| 1230 S Military Trl #2014 Deerfield Beach, FL | 2.0 | 2.0 | 937 | $2,400 | $2.56 | 17d | 1 | 0.48mi |
| 1230 S Military Trl #2014 Deerfield Beach, FL | 2.0 | 2.0 | 937 | $2,400 | $2.56 | 24d | 1 | 0.48mi |
| 1234 S Military Trl #1811 Deerfield Beach, FL | 2.0 | 2.0 | 1099 | $2,500 | $2.27 | 24d | 1 | 0.50mi |
| 1244 S Military Trl #724 Deerfield Beach, FL | 2.0 | 1.5 | 916 | $1,950 | $2.13 | 14d | 1 | 0.50mi |
| 1250 S Military Trl #1612 Deerfield Beach, FL | 2.0 | 1.5 | 1035 | $2,500 | $2.42 | 5d | 1 | 0.50mi |
| 4740 NE 2nd Ter Deerfield Beach, FL | 3.0 | 2.0 | 1000 | $3,250 | $3.25 | 24d | 1 | 0.51mi |
| 4740 NE 2nd Ter Deerfield Beach, FL | 3.0 | 2.0 | 1000 | $3,250 | $3.25 | 4d | 1 | 0.51mi |
| 2297 SW 15th St #122 Deerfield Beach, FL | 2.0 | 2.0 | 1200 | $2,200 | $1.83 | 12d | 1 | 0.52mi |
| 2246 Discovery Cir W Deerfield Beach, FL | 2.0 | 2.5 | 1300 | $2,650 | $2.04 | 24d | 1 | 0.54mi |
| 1266 S Military Trl Deerfield Beach, FL | 1.0–2.0 | 1.0–2.0 | 1050 | $2,550 | $2.43 | 22d | 2 | 0.55mi |
| 2265 SW 15th St #165 Deerfield Beach, FL | 3.0 | 2.0 | 1350 | $2,400 | $1.78 | 24d | 1 | 0.55mi |
| 1100 S Military Trl Deerfield Beach, FL | 2.0–3.0 | 1.0–2.0 | 1119 | $2,250 | $2.01 | 24d | 2 | 0.57mi |
| 551 NW 46th St Deerfield Beach, FL | 2.0 | 2.0 | 952 | $2,485 | $2.61 | 24d | 1 | 0.58mi |
| 2149 Discovery Cir W Unit 1 Deerfield Beach, FL | 2.0 | 2.5 | 1300 | $2,850 | $2.19 | 22d | 1 | 0.58mi |
| 2217 Discovery Cir W Deerfield Beach, FL | 2.0 | 2.5 | 1429 | $2,400 | $1.68 | 15d | 1 | 0.58mi |
| 265 NE 46th St Deerfield Beach, FL | 2.0 | 1.0 | 1335 | $2,250 | $1.69 | 17d | 1 | 0.59mi |
| 671 Cypress Lake Blvd Unit D21 Deerfield Beach, FL | 3.0 | 2.0 | 974 | $2,250 | $2.31 | 12d | 1 | 0.59mi |
| 1272 S Military Trl #313 Deerfield Beach, FL | 2.0 | 2.0 | 900 | $2,390 | $2.66 | 22d | 1 | 0.59mi |
| 4503 NW 6th Ave Deerfield Beach, FL | 3.0 | 2.0 | 1148 | $2,850 | $2.48 | 24d | 1 | 0.62mi |
| 661 Cypress Lake Blvd Unit I20 Deerfield Beach, FL | 3.0 | 2.0 | 974 | $2,250 | $2.31 | 1d | 1 | 0.62mi |
| 661 Cypress Lake Blvd Unit I20 Deerfield Beach, FL | 3.0 | 2.0 | 974 | $2,300 | $2.36 | 24d | 1 | 0.62mi |
| 2355 SW 15th St Deerfield Beach, FL | 2.0 | 2.0 | 1100 | $2,098 | $1.91 | 24d | 2 | 0.62mi |
| 2173 Discovery Cir W Deerfield Beach, FL | 2.0 | 2.0 | 1126 | $2,950 | $2.62 | 3d | 1 | 0.63mi |
| 378 NE 47th Pl #378 Pompano Beach, FL | 3.0 | 2.5 | 1457 | $3,000 | $2.06 | 24d | 1 | 0.64mi |
| 1398 SW 24th Ter Deerfield Beach, FL | 3.0 | 2.0 | 1865 | $5,000 | $2.68 | 24d | 1 | 0.70mi |
| 831 SW 14th Ct Deerfield Beach, FL | 3.0 | 2.0 | 1056 | $2,850 | $2.70 | 24d | 1 | 0.71mi |
| 5350 NE 5th Ter Pompano Beach, FL | 2.0 | 1.0 | 950 | $1,900 | $2.00 | 24d | 1 | 0.72mi |
| 220 NW 43rd Ct Deerfield Beach, FL | 3.0 | 2.0 | 1458 | $2,700 | $1.85 | 15d | 1 | 0.72mi |
| 4325 NW 5th Ave Deerfield Beach, FL | 2.0 | 2.0 | 953 | $2,249 | $2.36 | 10d | 1 | 0.75mi |
| 4332 NW 1st Ter Deerfield Beach, FL | 3.0 | 2.0 | 1095 | $3,000 | $2.74 | 24d | 1 | 0.77mi |
| 4332 NW 1st Ter Deerfield Beach, FL | 3.0 | 2.0 | 1095 | $3,000 | $2.74 | 5d | 1 | 0.77mi |
| 220 NW 43rd St Deerfield Beach, FL | 3.0 | 2.0 | 1458 | $2,800 | $1.92 | 24d | 1 | 0.77mi |
| 4313 NW 6th Ave Deerfield Beach, FL | 3.0 | 2.0 | 1348 | $2,850 | $2.11 | 22d | 1 | 0.80mi |
| 5161 NW 11th Ln Deerfield Beach, FL | 3.0 | 2.0 | 1486 | $2,925 | $1.97 | 24d | 1 | 0.81mi |
| 540 NW 43rd St Deerfield Beach, FL | 2.0 | 2.0 | 1150 | $2,500 | $2.17 | 18d | 1 | 0.83mi |
HOA detail
- Monthly dues
- $128 · $1,536/yr
- Likely covers
- electricpoolsecurity
Listing history 10 events
-
2026-06-18days on market $235,000 Active 15 DOM
-
2026-06-17days on market $235,000 Active 14 DOM
-
2026-06-16days on market $235,000 Active 13 DOM
-
2026-06-15days on market $235,000 Active 12 DOM
-
2026-06-13days on market $235,000 Active 10 DOM
-
2026-06-09days on market $235,000 Active 6 DOM
-
2026-06-08days on market $235,000 Active 5 DOM
-
2026-06-07days on market $235,000 Active 4 DOM
-
2026-06-04remarks 699-char remark
-
2026-06-04$235,000 Active 1 DOM
ⓘ Source: listings_history table (triggers on properties + properties_extension) + one-shot
backfill from property_details.listing_events for pre-trigger history.
Tax reassessment forecast FL · Resets to sale price
- Current annual tax
- $3,415 · $285/mo
- Projected year-2 tax
- $3,415 · $285/mo
- Expected delta
- $0/yr ($0/mo · 0.0%)
ⓘ Screening estimate from a state-policy table — verify with the county assessor before closing.
Climate risk First Street
- Flood 3/10 Moderate FEMA zone X (shaded) · 10% chance over 30 yrs
- Wildfire 1/10 Low
- Heat 9/10 Extreme 6 d/yr ≥107°F today · 21 d/yr by 30 yrs out
- Wind 10/10 Extreme 99% chance of damaging wind over 30 yrs
- Air quality 2/10 Low 1 unhealthy d/yr today · 3 by 30 yrs out
Nearby sold comps map
Loading sold comps map…
Walkable amenities ~0.75 mi
Loading nearby amenities…
Taxation est. · year 1
- Rental income
- $30,114
- − Mortgage interest
- −$13,164
- − Property taxes
- −$3,415
- − Insurance
- −$1,175
- − Repairs & maintenance
- −$2,409
- − Management
- −$2,409
- − HOA
- −$1,536
- − Depreciation
- −$6,836
- Taxable loss
- −$831
- Est. tax savings @ 24.0%
- +$199
- After-tax cash flow
- $3,075/yr
For passive investors: Depreciation is non-cash, so a rental often shows a tax loss while cash-flowing — sheltering income. Rental losses are passive: they offset passive income freely, and up to $25,000/yr can offset ordinary (W-2) income if you actively participate and your MAGI is under $100k (phasing out to $0 by $150k); unused losses carry forward. On sale, claimed depreciation is recaptured at up to 25%, and gains may owe capital-gains tax (a 1031 exchange can defer both). Figures are a year-1 estimate at your 24.0% rate — not tax advice; consult a CPA.
Schools (NCES district)
- District
- Broward
- NCES district ID
- 1200180
- Math proficiency
- 42% ▼ -18.00%
- Reading proficiency
- 53% ▼ -5.00%
- Median HH income
- $52,139
- Composite
- 40.88/100
- National rank
- #3621
- State rank
- #46 of 73 in FL
Livability — Deerfield Beach
- Score
- 75/100
- State rank
- #250
- US rank
- #3970
Category grades
Schools grade is shown separately in the Schools card above.
Census & demographics
- Census place
- Deerfield Beach, FL
- County
- Broward County · 1,963,430 people
- City population
- 61,449
- Metro
- Miami-Fort Lauderdale-Pompano Beach, FL
- Population (ZIP)
- 64,563
- Household income
- $71,301
- Rent vs Own
- Severe rent burden
- 2907.0
Population outlook (Broward County) Hauer SSP2
- Today (2025)
- 2,207,033 people
- By 2030
- 2,360,704 · +7.0%
- By 2040
- 2,661,208 · +20.6%
- By 2050
- 2,946,698 · +33.5%
- By 2075
- 3,602,273 · +63.2%
- By 2100
- 3,970,984 · +79.9%
Race, ethnicity, and origin ACS 2023
- Neighborhood character
- Highly diverse neighborhood (Simpson 0.75)
- Race & ethnicity
- White 34% Hispanic / Latino 27% Black 25% Two or more races 24% Asian 2%
- Hispanic origin (detail)
- Mexican 4% Puerto Rican 4% Cuban 4% Dominican 2%
- Common ancestry
- Hispanic 13% Estonian 10% Romanian 1%
- Foreign-born
- 43% · Canada, Jamaica, Dominican Republic
- Languages at home
- 45% English-only · Spanish 23% French/Haitian/Cajun 16% Other Indo-European 13%
Political lean MEDSL · Broward
- 2024 margin
- D (+17.0) · D 58.0% · R 41.0%
- 2008→2024 swing
- -17.8pp toward R · 2008: 34.7pp · 2024: 17.0pp
- All cycles
- 2024: D+17.0 2020: D+29.8 2016: D+35.0 2012: D+34.9 2008: D+34.7
Not yet ingested
- Civics
- —
Market trends
- HPI YoY
- ▼ -109.09%
- Current HPI
- 474.7007
- Rent YoY
- ▲ 1.75%
- Metro
- Miami-Fort Lauderdale-Pompano Beach, FL
- State GDP YoY
- ▲ 3.28%
- F500 in state
- 36
Industry mix (Fortune 500 HQ in FL)
| Industry | F500 HQs | Revenue |
|---|---|---|
| Industrial Technology | 2 | $29B |
|
||
| Insurance | 2 | $17B |
|
||
| Retail | 1 | $60B |
|
||
| Technology Distribution | 1 | $58B |
|
||
| Homebuilding | 1 | $35B |
|
||
| Technology Manufacturing | 1 | $35B |
|
||
Price history
+1075.0% since first listed18 events — show timeline
- 2026-06-03 Listed $235,000 MARMLS
- 2024-06-27 Sold (MLS) $225,000 Beaches MLS
- 2024-04-16 Contingent — Beaches MLS
- 2024-04-09 Pending — Beaches MLS
- 2024-03-11 Price Changed $249,900 Beaches MLS
- 2024-03-11 Relisted — Beaches MLS
- 2024-03-07 Pending — Beaches MLS
- 2024-02-08 Listed $265,000 Beaches MLS
- 2022-05-04 Sold (Public Records) $168,000 Public Records
- 2022-05-02 Sold (MLS) $168,000 MARMLS
- 2022-03-07 Contingent — MARMLS
- 2022-02-16 Price Changed $168,000 MARMLS
- 2022-02-08 Relisted — MARMLS
- 2022-01-15 Contingent — MARMLS
- 2022-01-12 Relisted — MARMLS
- 2021-12-07 Contingent — MARMLS
- 2021-12-01 Listed $170,000 MARMLS
- 1980-08-01 Sold (Public Records) $20,000 Public Records
Property tax history
+10.8%/yrLatest (2025): $3,415 · -6.6% YoY. Source: county tax records.
Cash-flow waterfall
monthlySold comps — $/sqft
last 12 mo · ≤1 miLoading sold comps…