 Duplex
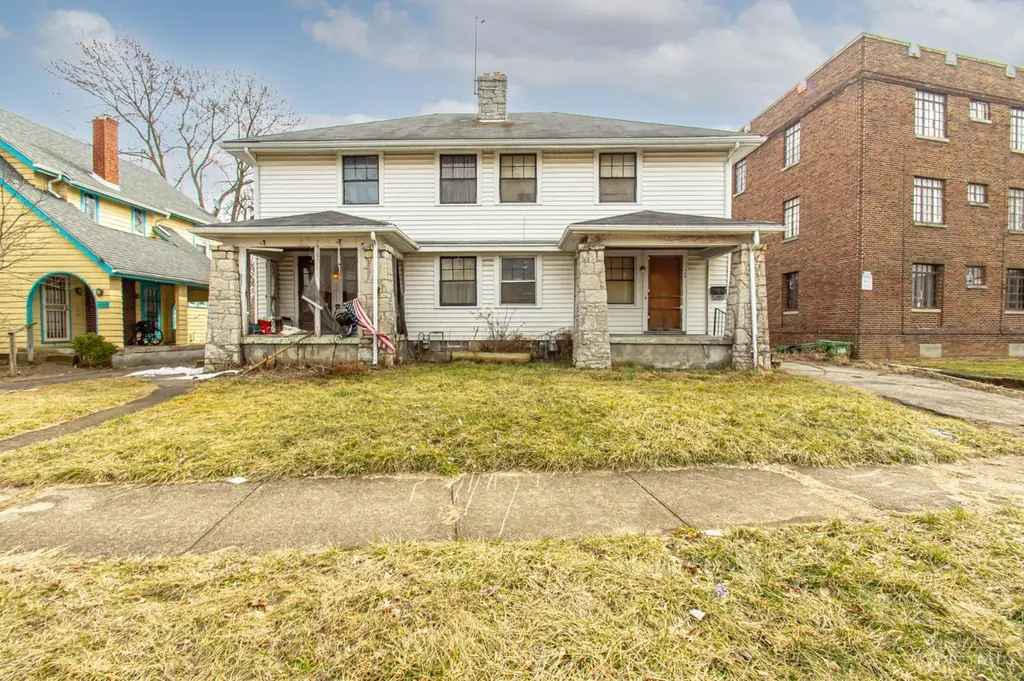
466 Allwen Dr · Dayton, OH
Flood risk 1/10 · Minimal
- FEMA flood zone
- X (unshaded)
- Chance of flooding over 30 yrs
- 0.0%
- Est. flood insurance / yr
- $473 – $860
Fire risk 1/10 · Minimal
- Est. fire insurance / yr
- $713 – $1,323
Heat risk 3/10 · Minor
- Hot days now (above 104°F)
- 7 days/yr
- Hot days in 30 yrs
- 18 days/yr
Wind risk 2/10 · Minimal
- Chance of severe wind over 30 yrs
- —
Air-quality risk 3/10 · Minor
- Unhealthy air days now
- 2 days/yr
- Unhealthy air days in 30 yrs
- 4 days/yr
Risk factors via First Street. Map © Google.
Why this score? — see what drove the B- grade
The composite is a weighted blend of 9 inputs, each scored 0–100. Each bar is that input's sub-score; the figure is the points it added to the 100-point composite (weight × sub-score).
- Cash flow +30.0/30.0
- 1% rule +10.0/10.0
- DSCR +10.0/10.0
- ARV discount +8.8/15.0
- Rent growth +3.3/5.0
- Livability +3.2/5.0
- Condition / age +2.5/5.0
- Schools +1.3/10.0
- Appreciation +0.0/10.0
$125,000
🖨 Deal sheet 📄 Offer letter ✓ Due diligence
Multi-family units
County records classify this as Multi-Family (2-4 Unit). Listing-text estimate: 2 units. confirmed
Listing remarks MLS
Investment opportunity at 466-468 Allwen! This solid duplex offers 2,436 S/F with two units, each featuring 2 bedrooms, 1 full bath, a comfortable Living Room, kitchen with breakfast nook, and an unfinished basement. One unit is currently rented at $450/month on a month-to-month lease. Unit 466 includes central A/C. Recent updates include a newer furnace in one unit, meter repair work, and a new electric box. With some TLC, there’s strong potential to increase rents to current market rates. Property is being sold as-is; seller will make no repairs. Buyers to rely on their own inspections and verify all measurements.
Key facts
- Solid duplex
- Newer furnace
- New electric box
Tags
Neighborhood map
What this means for you Summary
Snapshot
- This is a 2 × 2-bed/1.0-bath units multifamily listed at $125k.
Deal economics
- At list price, monthly cash flow is $767 ($9k/yr) — positive. Per door: $384/mo.
- The deal already cash-flows at list — no discount required.
- Meets the 1% rule at list price ($2k rent vs $125k).
- Recommended offer: $114k (9.0% below list) — sets the bar for market timing.
- Cap rate 13.7% vs local median 7.4% in Dayton — top-decile yield for the area; either an underpriced asset or a hidden risk that comps aren't pricing in. Stress-test before assuming the spread holds.
Location & tenants
- Location reads 65/100 on livability (#716 in OH) — a middle-class / working-renter tenant base. Strengths: cost of living A+, housing A+, health & safety A; Watch: schools C-, amenities C-, crime F.
- Dayton City (urban): math 12% / reading 21% proficiency, ranked #641 of 656 in OH (top 98%) — low school quality limits family demand, transient renter base, plan for 1-2y turnover; 74% free/reduced lunch — lower-income household profile, screen leases tightly.
- Market conditions: Rents rising (+3.0%/yr); 156 active listings in the ZIP; 10 comparable units currently listed for rent nearby; rentals lingering (median 44d on market — plan ~5-8 weeks vacancy on turnover, expect pricing pressure); 60% of comp listings sitting > 30 days — soft ceiling on asking rent; lower-income renter base — watch delinquency; 907 units permitted in Montgomery County in 2024 (416 in 5+ unit buildings).
- At $1,993/mo this rent would consume 57% of the median local household income ($42k/yr) (locally 1504% of renters already pay >50% of income on rent) — very limited rent-growth headroom before tenants either downsize or default.
Forward outlook
- Local home prices are declining (-3.0%/yr); year-one equity from $864 of loan paydown is wiped out by about $4k of value loss. Plan a longer hold.
- Montgomery County population projected at -10% by 2050 — secular population decline; favor cash flow + early exit over multi-decade hold.
- At projected returns (-3.0% appreciation + 3.0% rent growth), your $35k cash investment doubles in ~5 years — after that, you're playing with house money.
Negotiation context
- It's been on market 114 days — a 9% lower offer ($114k) is reasonable based on typical stale-listing flexibility.
- 4 sale attempts with the ask held roughly flat each time — persistent listings suggest the price (not the market) is what's stuck; bring a comps-based counter.
- Current owner paid $65k; list at $125k implies a 92% gain — meaningful room to come down on a strong offer.
Risks & watch-outs
- Watch-outs: built in 1927 — expect roof / HVAC / electrical / plumbing capex.
Questions for the listing agent
- It's been on market 114 days. Have you received any prior offers? Is the seller open to a 9% concession, seller financing, or rate buy-down credit?
- Can we see the unit-by-unit rent roll, current vacancy, and any below-market leases? What's the average tenancy length?
- What capital expenditures (roof, boiler, parking lot, exteriors) have been made in the last 5 years, and what's planned in the next 2?
- Built in 1927 — when were the roof, HVAC, electrical panel, plumbing, and water heater last replaced?
- Why hasn't it sold? Are there any deal-killer items the seller is aware of (foundation, flood, title, zoning, code violations)?
- Is there a deadline driving the sale (1031 exchange, divorce, estate, relocation)? That informs how much negotiation room exists.
- Crime grade is F in this area — have there been break-ins, vandalism, or insurance claims at this property in the last 3 years? What carrier currently insures it and at what premium?
- What's the average days-on-market for RENTAL listings here right now (not sales)? A rising rental-DOM trend means longer vacancies and softer asking-rent achievability than the comps imply.
- What's the recent tenant-quality profile in this submarket — average credit score on applications, eviction rate, late-payment / NSF rate, and stable-employment percentage? A property-management company in the area should have these aggregated.
- How much new apartment / multifamily construction is in the pipeline within 1–3 miles? Heavy new supply (>2% of stock underway) typically softens rents 12–24 months out; light construction supports rent growth.
Investment metrics
- 1% rule
- 1.59% ✓
- Cap rate
- 13.66%
- Cash-on-cash
- 26.31%
- DSCR
- 2.17
- GRM
- 5.2
CMA / ARV
- ARV (median comp)
- $128,782
- List price
- $125,000
- Delta
- -2.94%
- Verdict
- FAIR
- Comps
- 20 within 1.0 mi
Show comp detail 10 sales within ~0.75 mi
| Address | Dist | Beds/Ba | Sqft | Sold | Price | $/sf | Match |
|---|---|---|---|---|---|---|---|
| 466-468 Allwen Dr | 0.00mi | 4/2.0 | 2,436 (0%) | 8mo | $65,000 | $27 | 94 |
| 89 W Hudson Ave #87 | 0.50mi | 4/2.0 | 2,392 (-2%) | 4mo | $150,000 | $63 | 70 |
| 53 W Norman Ave #51 | 0.55mi | 4/— | 2,560 (+5%) | 4mo | $190,000 | $74 | 62 |
| 10 Marie Ave | 0.31mi | 4/2.0 | 2,200 (-10%) | 16mo | $179,000 | $81 | 56 |
| 1161 Linda Vista Ave | 0.39mi | 4/4.0 | 2,490 (+2%) | 17mo | $200,000 | $80 | 56 |
| 2411 N Main St #2409 | 0.61mi | 4/— | 2,658 (+9%) | 3mo | $171,000 | $64 | 54 |
| 1721 Manor Pl #1719 | 0.20mi | 5/2.0 (+1) | 2,648 (+9%) | 21mo | $62,000 | $23 | 53 |
| 605 Delaware Ave | 0.50mi | 5/3.0 (+1) | 2,240 (-8%) | 5mo | $180,000 | $80 | 50 |
| 1948 Victoria Ave | 0.73mi | 4/4.0 | 2,320 (-5%) | 2mo | $225,500 | $97 | 48 |
| 960 Sherwood Dr | 0.68mi | 4/2.0 | 2,080 (-15%) | 8mo | $145,000 | $70 | 37 |
Match score weights: distance 35% · size 25% · config 20% · recency 20%. Top-matched comps best support the ARV.
Projected returns pro-forma
-3.0% appreciation · 3.03% rent growth · sell at horizon
- IRR
- 20.1%
- Equity multiple
- 1.82×
- Total profit
- $28,680
- Equity at exit
- $18,638
- IRR
- 28.4%
- Equity multiple
- 3.52×
- Total profit
- $88,143
- Equity at exit
- $10,808
Cash invested: $35,000 (down + closing). Projections, not guarantees.
Landlord ↔ Tenant lean methodology
- Overall (STATE)
- 73 Landlord-Friendly
- State Ohio
- 73 Landlord-Friendly · R+6
- County
- — inherits STATE
- City
- — inherits STATE
ZIP-level market 45406
- Rents YoY
- 3.0%
- Active inventory
- 156
- Price-to-rent
- 10.5×
Monthly cashflow live
- Estimated rent
- $1,993 high interval (Pro) →
- Mortgage (P&I)
- −$656
- Tax from tax record
- −$99 /mo · $1,193/yr
- Insurance
- −$52
- HOA
- −$0
- Vacancy / Maint / Mgmt
- −$419
- Net cashflow
- $767
Break-even live
2-unit breakdown (identical units grouped — click to expand)
| Units | Beds | Baths | Est. rent |
|---|---|---|---|
| 2× units | 2 | 1 | $1,992 |
| #1 | 2 | 1 | $996 |
| #2 | 2 | 1 | $996 |
| Total (2 units) | $1,993 | ||
UW: 25.0% down · 7.5% · 30yr · 1.5% tax · 5.0% vac · 8.0% maint · 8.0% mgmt
Financing live
Cash to close
- Down payment
- $31,250
- Closing costs
- $3,750
- Reserves months
- —
- Total cash needed
- —
Loan-product check · same deal, 3 products live
Conventional
25% down · 7.5% · 30yr
- Down + closing
- —
- Monthly P&I
- —
- Monthly cashflow
- —
- DSCR
- —
- Eligible?
- —
Personal DTI + credit; lowest rate.
DSCR
20% down · 8.5% · 30yr
- Down + closing
- —
- Monthly P&I
- —
- Monthly cashflow
- —
- DSCR
- —
- Eligible?
- —
No personal income docs; deal must DSCR.
Hard money
10% down · 12.0% · 12mo
- Down + closing
- —
- Monthly P&I
- —
- Monthly cashflow
- —
- DSCR
- —
- Eligible?
- —
Short-term bridge; refi at stabilization.
Rent comps 10 comps
| Address | Beds | Baths | Sqft | Rent | $/sqft | DOM | Units | Dist |
|---|---|---|---|---|---|---|---|---|
| 1743 Radcliffe Rd Dayton, OH | 3.0 | 1.5 | 1729 | $1,200 | $0.69 | 44d | 1 | 0.24mi |
| 101 W Norman Ave Unit 101 Dayton, OH | 3.0 | 1.0 | 1600 | $945 | $0.59 | 44d | 1 | 0.47mi |
| 2141 Philadelphia Dr Dayton, OH | 3.0 | 1.0 | 1736 | $1,395 | $0.80 | 44d | 1 | 0.74mi |
| 942 Harvard Blvd Dayton, OH | 3.0 | 2.0 | 1596 | $1,200 | $0.75 | 3d | 1 | 0.87mi |
| 932 Harvard Blvd Dayton, OH | 5.0 | 2.0 | 1986 | $1,500 | $0.76 | 44d | 1 | 0.87mi |
| 1501 Viola Ave Dayton, OH | 3.0 | 1.0 | 1952 | $1,175 | $0.60 | 14d | 1 | 0.97mi |
| 253 E Hillcrest Ave Dayton, OH | 3.0 | 2.5 | 2569 | $1,800 | $0.70 | 3d | 1 | 1.00mi |
| 132 Wroe Ave Unit 132 Dayton, OH | 3.0 | 2.5 | 1934 | $1,297 | $0.67 | 44d | 1 | 1.04mi |
| 1011 N Broadway St Dayton, OH | 3.0 | 1.5 | 1700 | $950 | $0.56 | 44d | 1 | 1.13mi |
| 534 Geyer St Dayton, OH | 4.0 | 1.0 | 1640 | $1,530 | $0.93 | 23d | 1 | 1.35mi |
Listing history 23 events
-
2026-06-18days on market $125,000 Active 114 DOM
-
2026-06-17days on market $125,000 Active 113 DOM
-
2026-06-16days on market $125,000 Active 112 DOM
-
2026-06-15days on market $125,000 Active 111 DOM
-
2026-06-14days on market $125,000 Active 109 DOM
-
2026-06-13days on market $125,000 Active 108 DOM
-
2026-06-10days on market $125,000 Active 106 DOM
-
2026-06-09days on market $125,000 Active 105 DOM
-
2026-06-08days on market $125,000 Active 104 DOM
-
2026-06-07days on market $125,000 Active 103 DOM
-
2026-06-05days on market $125,000 Active 100 DOM
-
2026-06-03days on market $125,000 Active 99 DOM
-
2026-06-02days on market $125,000 Active 98 DOM
-
2026-06-01days on market $125,000 Active 97 DOM
-
2026-05-31days on market $125,000 Active 96 DOM
-
2026-04-20status Active 629-char remark
Show marketing remark (629 chars)
Investment opportunity at 466-468 Allwen! This solid duplex offers 2,436 S/F with two units, each featuring 2 bedrooms, 1 full bath, a comfortable Living Room, kitchen with breakfast nook, and an unfinished basement. One unit is currently rented at $450/month on a month-to-month lease. Unit 466 includes central A/C. Recent updates include a newer furnace in one unit, meter repair work, and a new electric box. With some TLC, there’s strong potential to increase rents to current market rates. Property is being sold as-is; seller will make no repairs. Buyers to rely on their own inspections and verify all measurements.
-
2026-04-09status Active 623-char remark
Show marketing remark (623 chars)
Investment opportunity at 466-468 Allwen! This solid duplex offers 2,436 S/F with two units, each featuring 2 bedrooms, 1 full bath, a comfortable Living Room, kitchen with breakfast nook, and an unfinished basement. One unit is currently rented at $450/month on a month-to-month lease. Unit 466 includes central A/C. Recent updates include a newer furnace in one unit, meter repair work, and a new electric box. With some TLC, there's strong potential to increase rents to current market rates. Property is being sold as-is; seller will make no repairs. Buyers to rely on their own inspections and verify all measurements.
-
2026-03-16historical Contingency Pending 623-char remark
Show marketing remark (629 chars)
Investment opportunity at 466-468 Allwen! This solid duplex offers 2,436 S/F with two units, each featuring 2 bedrooms, 1 full bath, a comfortable Living Room, kitchen with breakfast nook, and an unfinished basement. One unit is currently rented at $450/month on a month-to-month lease. Unit 466 includes central A/C. Recent updates include a newer furnace in one unit, meter repair work, and a new electric box. With some TLC, there’s strong potential to increase rents to current market rates. Property is being sold as-is; seller will make no repairs. Buyers to rely on their own inspections and verify all measurements.
-
2026-03-16status Pending 629-char remark
Show marketing remark (629 chars)
Investment opportunity at 466-468 Allwen! This solid duplex offers 2,436 S/F with two units, each featuring 2 bedrooms, 1 full bath, a comfortable Living Room, kitchen with breakfast nook, and an unfinished basement. One unit is currently rented at $450/month on a month-to-month lease. Unit 466 includes central A/C. Recent updates include a newer furnace in one unit, meter repair work, and a new electric box. With some TLC, there’s strong potential to increase rents to current market rates. Property is being sold as-is; seller will make no repairs. Buyers to rely on their own inspections and verify all measurements.
-
2026-02-24$125,000 Active 629-char remark
Show marketing remark (623 chars)
Investment opportunity at 466-468 Allwen! This solid duplex offers 2,436 S/F with two units, each featuring 2 bedrooms, 1 full bath, a comfortable Living Room, kitchen with breakfast nook, and an unfinished basement. One unit is currently rented at $450/month on a month-to-month lease. Unit 466 includes central A/C. Recent updates include a newer furnace in one unit, meter repair work, and a new electric box. With some TLC, there's strong potential to increase rents to current market rates. Property is being sold as-is; seller will make no repairs. Buyers to rely on their own inspections and verify all measurements.
-
2026-02-24$125,000 Active 623-char remark
Show marketing remark (623 chars)
Investment opportunity at 466-468 Allwen! This solid duplex offers 2,436 S/F with two units, each featuring 2 bedrooms, 1 full bath, a comfortable Living Room, kitchen with breakfast nook, and an unfinished basement. One unit is currently rented at $450/month on a month-to-month lease. Unit 466 includes central A/C. Recent updates include a newer furnace in one unit, meter repair work, and a new electric box. With some TLC, there's strong potential to increase rents to current market rates. Property is being sold as-is; seller will make no repairs. Buyers to rely on their own inspections and verify all measurements.
-
2025-11-06soldstatus $65,000
-
2022-09-26soldstatus $55,000
ⓘ Source: listings_history table (triggers on properties + properties_extension) + one-shot
backfill from property_details.listing_events for pre-trigger history.
Tax reassessment forecast OH · Partial reset (capped growth)
- Current annual tax
- $1,193 · $99/mo
- Projected year-2 tax
- $1,571 · $131/mo
- Expected delta
- +$379/yr (+$32/mo · 31.7%)
ⓘ Screening estimate from a state-policy table — verify with the county assessor before closing.
Climate risk First Street
- Flood 1/10 Low FEMA zone X (unshaded) · 0% chance over 30 yrs
- Wildfire 1/10 Low
- Heat 3/10 Moderate 7 d/yr ≥104°F today · 18 d/yr by 30 yrs out
- Wind 2/10 Low
- Air quality 3/10 Moderate 2 unhealthy d/yr today · 4 by 30 yrs out
Nearby sold comps map
Loading sold comps map…
Walkable amenities ~0.75 mi
Loading nearby amenities…
Taxation est. · year 1
- Rental income
- $23,916
- − Mortgage interest
- −$7,002
- − Property taxes
- −$1,193
- − Insurance
- −$625
- − Repairs & maintenance
- −$1,913
- − Management
- −$1,913
- − Depreciation
- −$3,636
- Taxable income
- $7,633
- Est. tax owed @ 24.0%
- −$1,832
- After-tax cash flow
- $7,378/yr
For passive investors: Depreciation is non-cash, so a rental often shows a tax loss while cash-flowing — sheltering income. Rental losses are passive: they offset passive income freely, and up to $25,000/yr can offset ordinary (W-2) income if you actively participate and your MAGI is under $100k (phasing out to $0 by $150k); unused losses carry forward. On sale, claimed depreciation is recaptured at up to 25%, and gains may owe capital-gains tax (a 1031 exchange can defer both). Figures are a year-1 estimate at your 24.0% rate — not tax advice; consult a CPA.
Schools (NCES district)
- District
- Dayton City
- NCES district ID
- 3904384
- Math proficiency
- 12% ▼ -12.00%
- Reading proficiency
- 21% ▼ -11.00%
- Median HH income
- $28,688
- Composite
- 12.94/100
- National rank
- #9579
- State rank
- #641 of 656 in OH
Livability — Dayton
- Score
- 65/100
- State rank
- #716
- US rank
- #12895
Category grades
Schools grade is shown separately in the Schools card above.
Census & demographics
- Census place
- Dayton, OH
- County
- Montgomery County · 459,541 people
- City population
- 164,387
- Metro
- Dayton-Kettering, OH
- Population (ZIP)
- 19,991
- Household income
- $41,796
- Rent vs Own
- Severe rent burden
- 1504.0
Population outlook (Montgomery County) Hauer SSP2
- Today (2025)
- 523,241 people
- By 2030
- 514,948 · -1.6%
- By 2040
- 493,378 · -5.7%
- By 2050
- 469,639 · -10.2%
- By 2075
- 418,360 · -20.0%
- By 2100
- 353,315 · -32.5%
Race, ethnicity, and origin ACS 2023
- Neighborhood character
- Predominantly Black (75%)
- Race & ethnicity
- Black 75% White 16% Two or more races 7% Hispanic / Latino 3%
- Common ancestry
- Italian 2% Lithuanian 1% Slovak 1%
- Foreign-born
- 2% · Canada
- Languages at home
- 97% English-only · Spanish 1%
Political lean MEDSL · Montgomery
- 2024 margin
- Toss-up / Even · D 49.8% · R 49.3%
- 2008→2024 swing
- -5.8pp toward R · 2008: 6.2pp · 2024: 0.5pp
- All cycles
- 2024: D+0.5 2020: D+2.2 2016: R+1.2 2012: D+3.1 2008: D+6.2
Not yet ingested
- Civics
- —
Market trends
- HPI YoY
- ▼ -113.75%
- Current HPI
- 197.1302
- Rent YoY
- ▲ 3.03%
- Metro
- Dayton-Kettering, OH
- State GDP YoY
- ▲ 1.98%
- F500 in state
- 48
Industry mix (Fortune 500 HQ in OH)
| Industry | F500 HQs | Revenue |
|---|---|---|
| Insurance | 3 | $145B |
|
||
| Industrial Machinery | 3 | $49B |
|
||
| Financial Services | 3 | $24B |
|
||
| Consumer Goods | 2 | $93B |
|
||
| Aerospace / Defense | 2 | $47B |
|
||
| Utilities | 2 | $33B |
|
||
Price history
+127.3% since first listed8 events — show timeline
- 2026-04-20 Relisted — Dayton MLS
- 2026-04-09 Relisted — Cincy MLS
- 2026-03-16 Contingent — Cincy MLS
- 2026-03-16 Pending — Dayton MLS
- 2026-02-24 Listed $125,000 Cincy MLS
- 2026-02-24 Listed $125,000 Dayton MLS
- 2025-11-06 Sold (Public Records) $65,000 Public Records
- 2022-09-26 Sold (Public Records) $55,000 Public Records
Property tax history
+0.3%/yrLatest (2025): $1,193 · +1.3% YoY. Source: county tax records.
Cash-flow waterfall
monthlySold comps — $/sqft
last 12 mo · ≤1 miLoading sold comps…