1405 Northview Ln · Josephine, TX
Flood risk No data
- FEMA flood zone
- —
- Chance of flooding over 30 yrs
- —
- Est. flood insurance / yr
- —
Fire risk No data
- Est. fire insurance / yr
- —
Heat risk No data
- Hot days now (above threshold)
- —
- Hot days in 30 yrs
- —
Wind risk No data
- Chance of severe wind over 30 yrs
- —
Air-quality risk No data
- Unhealthy air days now
- —
- Unhealthy air days in 30 yrs
- —
Risk factors via First Street. Map © Google.
Why this score? — see what drove the D- grade
The composite is a weighted blend of 9 inputs, each scored 0–100. Each bar is that input's sub-score; the figure is the points it added to the 100-point composite (weight × sub-score).
- ARV discount +12.2/15.0
- Appreciation +10.0/10.0
- Cash flow +4.4/30.0
- Schools +3.2/10.0
- Livability +3.0/5.0
- Rent growth +2.5/5.0
- Condition / age +2.5/5.0
- 1% rule +0.4/10.0
- DSCR +0.0/10.0
$379,990
🖨 Deal sheet (PDF) 📄 Offer letter ✓ Due diligence
Listing remarks MLS
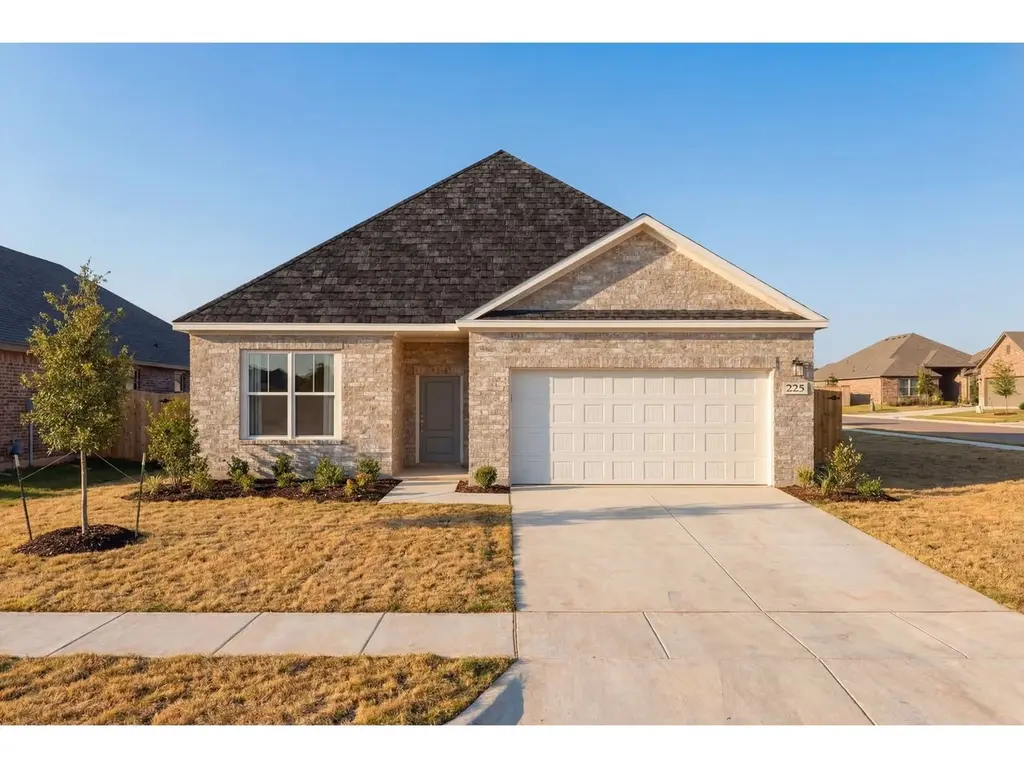
The Holly is a functional and inviting floor plan, encompassing 2,036 square feet with four bedrooms and three bathrooms. Its open-concept family room and kitchen are filled with natural light, creating a cozy space for family gatherings and casual entertaining. The design is practical, ensuring comfortable living and efficient use of space. The primary suite includes a sizable bedroom and a walk-in closet with direct access to the laundry room, adding convenience to the layout. The additional three bedrooms offer flexibility for family, work, or guests. A key feature is the rear patio, providing a serene outdoor space for relaxation. Overall, The Holly is an ideal choice for those seeking a straightforward, comfortable home. Attached photos are representative of the floor plan and may show non-standard features and upgrades. Renderings may be photo-realistically enhanced for visualization. Please see New Home Sales Consultant for details.
Key facts
- 9,017 sq ft lot
- 2 garage spots
- Built 2026
Property features AI
Finance
- Other: Builder listing; Possession at closing/funding
- Financial info: Financing accepted: Cash, Conventional, FHA, Texas Vet, USDA Loan, VA Loan
- HOA & community: No homeowners association
Exterior
- Parking: Attached garage with garage door opener; 2 garage spaces
- Utilities: City water; City sewer; Other utilities
- Home design: Single-family residence; One-story; New construction (incomplete, built 2026)
- Construction: New construction (2026)
- Exterior features: Lot in Meadow Ridge Estates; Lot less than 0.5 acre
Interior
- Kitchen: Dishwasher; Disposal; Microwave; Additional/other appliance
- Bedrooms: 4 bedrooms (all on one level); Primary bedroom on main level
- Bathrooms: 3 full bathrooms
- Interior features: Open floorplan; Kitchen island; Pantry; Double vanity; Walk-in closet(s); Six total rooms (including living, dining, bedrooms, office)
- Laundry & utility: Washer/dryer hookups likely present (standard for new construction)
Neighborhood map
What this means for you Summary
Snapshot
- This is a 4-bed/3.0-bath single-family listed at $380k.
Deal economics
- At list price, monthly cash flow is $-999 ($-12k/yr) — negative.
- To cash-flow at today's rent, offer at most $235k (38.1% below list).
- To meet the 1% rule (rent ≥ 1% of price), the offer needs to be $206k (45.8% below list).
- Recommended offer: $206k (45.8% below list) — sets the bar for 1% rule.
- Cap rate 3.1% vs local median 4.4% in Josephine — below-typical yield; the buyer is paying a premium for something (appreciation thesis, condition, location) that the cap rate doesn't capture.
Location & tenants
- Location reads 60/100 on livability (#1,076 in TX) — a middle-class / working-renter tenant base. Strengths: cost of living A+, housing A+, crime A-; Watch: schools F, amenities F, commute F.
- Community ISD (rural): math 30% / reading 38% proficiency, ranked #479 of 826 in TX (top 58%) — families likely to look elsewhere, expect single-tenant / working-renter base with shorter leases.
- Market conditions: 421 active listings in the ZIP; 6 comparable units currently listed for rent nearby; rentals at typical pace (median 17d on market — plan ~3-4 weeks tenant-placement turnaround); 19,194 units permitted in Collin County in 2024 (3,988 in 5+ unit buildings).
Forward outlook
- In year one you build about $41k of equity ($3k loan paydown + $38k appreciation (10.0% local appreciation)).
- Collin County population projected at +60% by 2050 — long-run rental-demand tailwind backs the buy-and-hold thesis.
- By year 2, paydown + projected appreciation supports a ~$65k cash-out refi (75% LTV) — recoverable capital for the next deal without selling this one.
Negotiation context
- It's been on market 45 days — a 3% lower offer ($369k) is reasonable based on typical stale-listing flexibility.
- 2 sale attempts with the ask held roughly flat each time — persistent listings suggest the price (not the market) is what's stuck; bring a comps-based counter.
Questions for the listing agent
- What do current leases actually rent for vs. the listed asking? Can we see a recent rent roll and the last 12 months of T-12 income?
- It's been on market 45 days. Have you received any prior offers? Is the seller open to a 46% concession, seller financing, or rate buy-down credit?
- Is there a deadline driving the sale (1031 exchange, divorce, estate, relocation)? That informs how much negotiation room exists.
- Schools are F-rated, which usually means shorter tenancies and higher turnover. Who's the typical renter profile here, and what's been the actual vacancy rate?
- The area grade is low — what's the realistic commute time and amenity access for the typical tenant pool here? Any planned neighborhood developments (good or bad) we should know about?
- What's the average days-on-market for RENTAL listings here right now (not sales)? A rising rental-DOM trend means longer vacancies and softer asking-rent achievability than the comps imply.
- What's the recent tenant-quality profile in this submarket — average credit score on applications, eviction rate, late-payment / NSF rate, and stable-employment percentage? A property-management company in the area should have these aggregated.
- How much new for-sale + rental construction is in the pipeline within 1–3 miles? Heavy new supply typically softens prices + rents 12–24 months out; constrained supply supports both.
Investment metrics
- 1% rule
- 0.54% ✗
- Cap rate
- 3.14%
- Cash-on-cash
- -11.27%
- DSCR
- 0.50
- GRM
- 15.4
CMA / ARV
- ARV (median comp)
- $423,787
- List price
- $379,990
- Delta
- -10.33%
- Verdict
- UNDERPRICED
- Comps
- 20 within 1.0 mi
Show comp detail 10 sales within ~0.75 mi
| Address | Dist | Beds/Ba | Sqft | Sold | Price | $/sf | Match |
|---|---|---|---|---|---|---|---|
| 306 Timber Ridge Dr | 0.12mi | 4/2.0 | 2,160 (+6%) | 2mo | $419,900 | $194 | 78 |
| 1700 Rolling Meadow Ln | 0.28mi | 4/2.0 | 2,105 (+3%) | 4mo | $364,995 | $173 | 74 |
| 300 Concord Ct | 0.49mi | 4/2.5 | 2,095 (+3%) | 2mo | $297,990 | $142 | 69 |
| 1476 Meadowbrook Ln | 0.43mi | 4/2.0 | 2,007 (-1%) | 13mo | $425,000 | $212 | 63 |
| 819 Lexington | 0.52mi | 4/2.5 | 2,095 (+3%) | 10mo | $273,990 | $131 | 61 |
| 2010 Creekview Ln | 0.71mi | 4/2.0 | 2,054 (+1%) | 11mo | $425,000 | $207 | 52 |
| 1785 Meadowbrook Ln | 0.53mi | 4/2.0 | 2,000 (-2%) | 24mo | $439,900 | $220 | 49 |
| 1527 Meadowbrook Ln | 0.48mi | 4/3.0 | 2,272 (+12%) | 13mo | $619,000 | $272 | 48 |
| 900 Lexington Ln | 0.69mi | 4/2.0 | 1,827 (-10%) | 17mo | $254,990 | $140 | 33 |
| 2008 Meadowbrook Ln | 0.66mi | 3/2.0 (-1) | 2,279 (+12%) | 10mo | $474,990 | $208 | 32 |
Match score weights: distance 35% · size 25% · config 20% · recency 20%. Top-matched comps best support the ARV.
Projected returns pro-forma
10.0% appreciation · 3.0% rent growth · sell at horizon
- IRR
- 16.4%
- Equity multiple
- 2.35×
- Total profit
- $143,342
- Equity at exit
- $342,325
- IRR
- 15.7%
- Equity multiple
- 5.44×
- Total profit
- $472,229
- Equity at exit
- $738,237
Cash invested: $106,397 (down + closing). Projections, not guarantees.
Landlord ↔ Tenant lean methodology
- Overall (STATE)
- 87 Strongly Landlord-Friendly
- State Texas
- 87 Strongly Landlord-Friendly · R+5
- County
- — inherits STATE
- City
- — inherits STATE
ZIP-level market 75173
- Home prices YoY
- 3.1%
- Active inventory
- 421
- Price-to-rent
- 15.4×
Monthly cashflow live
- Estimated rent
- $2,059 high interval (Pro) →
- Mortgage (P&I)
- −$1,993
- Tax est. 1.5%
- −$475 /mo · $5,700/yr
- Insurance
- −$158
- HOA
- −$0
- Vacancy / Maint / Mgmt
- −$432
- Net cashflow
- $-999
Break-even live
Sensitivity live
| Price | -10% $-737 | -5% $-868 | +0% $-999 | +5% $-1,131 | +10% $-1,262 |
|---|---|---|---|---|---|
| Rent | -10% $-1,162 | -5% $-1,081 | +0% $-999 | +5% $-918 | +10% $-837 |
| Rate | -1.0pp $-808 | -0.5pp $-903 | base $-999 | +0.5pp $-1,098 | +1.0pp $-1,198 |
UW: 25.0% down · 7.5% · 30yr · 1.5% tax · 5.0% vac · 8.0% maint · 8.0% mgmt
Financing live
Cash to close
- Down payment
- $94,998
- Closing costs
- $11,400
- Reserves months
- —
- Total cash needed
- —
Loan-product check · same deal, 3 products live
Conventional
25% down · 7.5% · 30yr
- Down + closing
- —
- Monthly P&I
- —
- Monthly cashflow
- —
- DSCR
- —
- Eligible?
- —
Personal DTI + credit; lowest rate.
DSCR
20% down · 8.5% · 30yr
- Down + closing
- —
- Monthly P&I
- —
- Monthly cashflow
- —
- DSCR
- —
- Eligible?
- —
No personal income docs; deal must DSCR.
Hard money
10% down · 12.0% · 12mo
- Down + closing
- —
- Monthly P&I
- —
- Monthly cashflow
- —
- DSCR
- —
- Eligible?
- —
Short-term bridge; refi at stabilization.
Rent comps 6 comps
| Address | Beds | Baths | Sqft | Rent | $/sqft | DOM | Units | Dist |
|---|---|---|---|---|---|---|---|---|
| 319 Plum Dr Nevada, TX | 4.0 | 2.0 | 1587 | $1,899 | $1.20 | 11d | 1 | 1.17mi |
| 504 Saddle Blanket Dr Nevada, TX | 4.0 | 2.0 | 1649 | $1,925 | $1.17 | 7d | 1 | 1.23mi |
| 504 Saddle Blanket Dr Nevada, TX | 4.0 | 2.0 | 1649 | $1,949 | $1.18 | 16d | 1 | 1.23mi |
| 503 Saddle Blanket Dr Nevada, TX | 4.0 | 3.0 | 2077 | $2,190 | $1.05 | 45d | 1 | 1.26mi |
| 6135 FM 547 Farmersville, TX | 4.0 | 2.5 | 1771 | $2,295 | $1.30 | 25d | 1 | 1.44mi |
| 831 Lexington Ln Nevada, TX | 4.0 | 2.5 | 2089 | $2,095 | $1.00 | 14d | 1 | 1.49mi |
Listing history 17 events
-
2026-06-21days on market $379,990 Active 45 DOM
-
2026-06-18days on market $379,990 Active 42 DOM
-
2026-06-17days on market $379,990 Active 41 DOM
-
2026-06-16days on market $379,990 Active 40 DOM
-
2026-06-15days on market $379,990 Active 39 DOM
-
2026-06-13days on market $379,990 Active 37 DOM
-
2026-06-13days on market $379,990 Active 36 DOM
-
2026-06-09days on market $379,990 Active 33 DOM
-
2026-06-08days on market $379,990 Active 32 DOM
-
2026-06-07days on market $379,990 Active 31 DOM
-
2026-06-04days on market $379,990 Active 28 DOM
-
2026-06-03days on market $379,990 Active 27 DOM
-
2026-06-02days on market $379,990 Active 26 DOM
-
2026-06-01days on market $379,990 Active 25 DOM
-
2026-05-31days on market $379,990 Active 24 DOM
-
2026-05-11$379,990 Active 953-char remark
Show marketing remark (953 chars)
The Holly is a functional and inviting floor plan, encompassing 2,036 square feet with four bedrooms and three bathrooms. Its open-concept family room and kitchen are filled with natural light, creating a cozy space for family gatherings and casual entertaining. The design is practical, ensuring comfortable living and efficient use of space. The primary suite includes a sizable bedroom and a walk-in closet with direct access to the laundry room, adding convenience to the layout. The additional three bedrooms offer flexibility for family, work, or guests. A key feature is the rear patio, providing a serene outdoor space for relaxation. Overall, The Holly is an ideal choice for those seeking a straightforward, comfortable home. Attached photos are representative of the floor plan and may show non-standard features and upgrades. Renderings may be photo-realistically enhanced for visualization. Please see New Home Sales Consultant for details.
-
2026-05-07$379,990 Active 959-char remark
ⓘ Source: listings_history table (triggers on properties + properties_extension) + one-shot
backfill from property_details.listing_events for pre-trigger history.
Nearby sold comps map
Loading sold comps map…
Walkable amenities ~0.75 mi
Loading nearby amenities…
Taxation est. · year 1
- Rental income
- $24,711
- − Mortgage interest
- −$21,285
- − Property taxes
- −$5,700
- − Insurance
- −$1,900
- − Repairs & maintenance
- −$1,977
- − Management
- −$1,977
- − Depreciation
- −$11,054
- Taxable loss
- −$19,182
- Est. tax savings @ 24.0%
- +$4,604
- After-tax cash flow
- $-7,387/yr
For passive investors: Depreciation is non-cash, so a rental often shows a tax loss while cash-flowing — sheltering income. Rental losses are passive: they offset passive income freely, and up to $25,000/yr can offset ordinary (W-2) income if you actively participate and your MAGI is under $100k (phasing out to $0 by $150k); unused losses carry forward. On sale, claimed depreciation is recaptured at up to 25%, and gains may owe capital-gains tax (a 1031 exchange can defer both). Figures are a year-1 estimate at your 24.0% rate — not tax advice; consult a CPA.
Schools (NCES district)
- District
- Community ISD
- NCES district ID
- 4814850
- Math proficiency
- 30% ▼ -23.00%
- Reading proficiency
- 38% ▼ -11.00%
- Median HH income
- $71,841
- Composite
- 31.58/100
- National rank
- #5951
- State rank
- #479 of 826 in TX
Livability — Josephine
- Score
- 60/100
- State rank
- #1076
- US rank
- #19105
Category grades
Schools grade is shown separately in the Schools card above.
Census & demographics
- Population (ZIP)
- 9,284
Population outlook (Collin County) Hauer SSP2
- Today (2025)
- 1,210,074 people
- By 2030
- 1,358,201 · +12.2%
- By 2040
- 1,654,061 · +36.7%
- By 2050
- 1,937,359 · +60.1%
- By 2075
- 2,567,039 · +112.1%
- By 2100
- 2,952,048 · +144.0%
Race, ethnicity, and origin ACS 2023
- Neighborhood character
- Majority White (65%)
- Race & ethnicity
- White 65% Hispanic / Latino 28% Two or more races 15% Black 2% Native American 1%
- Hispanic origin (detail)
- Mexican 26%
- Common ancestry
- Slovak 2% Serbian 1% Iranian 1%
- Foreign-born
- 17% · Canada, Jamaica
- Languages at home
- 74% English-only · Spanish 24% Arabic 1%
Political lean MEDSL · Collin
- 2024 margin
- R (+11.1) · D 43.1% · R 54.3% · Other 2.6%
- 2008→2024 swing
- +14.4pp toward D · 2008: -25.6pp · 2024: -11.1pp
- All cycles
- 2024: R+11.1 2020: R+4.3 2016: R+17.0 2012: R+31.6 2008: R+25.6
Not yet ingested
- Civics
- —
Market trends
- HPI YoY
- ▲ 10.09%
- Current HPI
- 331.12
- Rent YoY
- —
- Metro
- —
- State GDP YoY
- ▲ 3.95%
- F500 in state
- 110
Industry mix (Fortune 500 HQ in TX)
| Industry | F500 HQs | Revenue |
|---|---|---|
| Energy | 16 | $1,198B |
|
||
| Technology | 5 | $198B |
|
||
| Engineering / Construction | 4 | $72B |
|
||
| Energy Services | 3 | $60B |
|
||
| Utilities | 3 | $41B |
|
||
| Healthcare | 2 | $330B |
|
||
Price history
+0.0% since first listed2 events — show timeline
- 2026-05-11 Listed $379,990 Zillow
- 2026-05-07 Listed $379,990 NTREIS
Cash-flow waterfall
monthlySold comps — $/sqft
last 12 mo · ≤1 miLoading sold comps…