 🏗️ New Construction
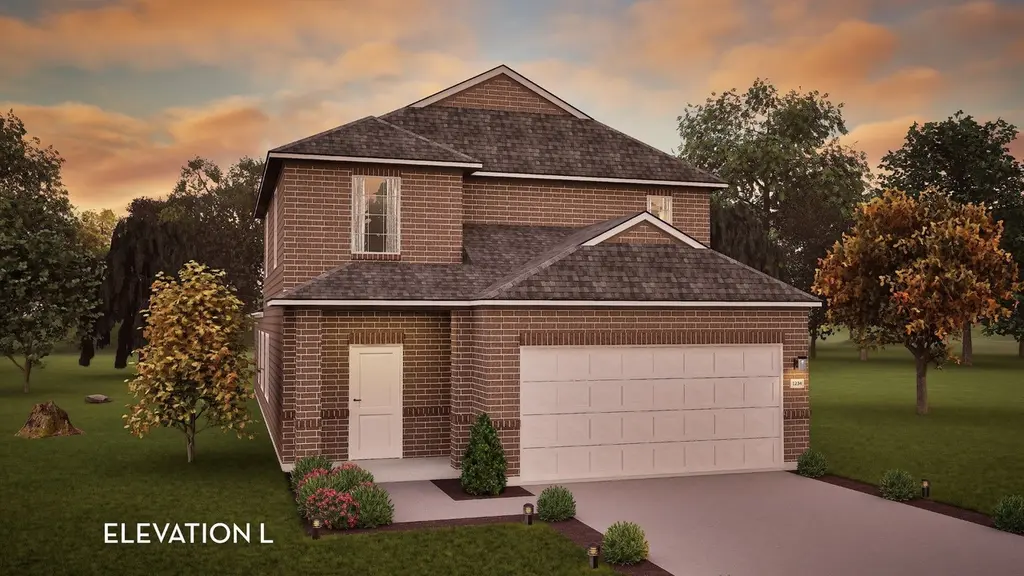
Hickory Plan · Texas City, TX
Flood risk No data
- FEMA flood zone
- —
- Chance of flooding over 30 yrs
- —
- Est. flood insurance / yr
- —
Fire risk No data
- Est. fire insurance / yr
- —
Heat risk No data
- Hot days now (above threshold)
- —
- Hot days in 30 yrs
- —
Wind risk No data
- Chance of severe wind over 30 yrs
- —
Air-quality risk No data
- Unhealthy air days now
- —
- Unhealthy air days in 30 yrs
- —
Risk factors via First Street. Map © Google.
Why this score? — see what drove the F grade
The composite is a weighted blend of 9 inputs, each scored 0–100. Each bar is that input's sub-score; the figure is the points it added to the 100-point composite (weight × sub-score).
- Cash flow +7.6/30.0
- ARV discount +7.5/15.0
- Condition / age +4.0/5.0
- Rent growth +3.5/5.0
- Schools +3.5/10.0
- Livability +3.1/5.0
- 1% rule +2.2/10.0
- DSCR +1.7/10.0
- Appreciation +0.0/10.0
$319,990
🖨 Deal sheet 📄 Offer letter ✓ Due diligence
Listing remarks MLS
Boasting an open-concept layout consisting of four large bedrooms, and 2.5 bathrooms, the Hickory home is nothing short of practical! Entering the home, you are greeted by the foyer area and convenient downstairs powder room. You are then led to the central area of the home featuring the combined kitchen and dining area. The kitchen includes plenty of countertop space with an island, granite countertops, designer light fixtures, and industry-leading appliances. Facing the kitchen & dining area is the spacious family room with access to the backyard - if you'd love to enjoy a cup of coffee outside in the morning, opt to include a covered patio! Completing the first floor is the large master suite. The attached master bathroom includes a super shower, cultured marble countertops, as well as a huge walk-in closet. Upstairs resides the game room, perfect for the kids, three additional bedrooms with walk-in closets, and another full bathroom. With enough room to sprawl out, the Hickory plan is perfectly sized to accommodate most any sized family!
Key facts
- Granite countertops
- Foyer area
- Open-concept layout
Tags
Neighborhood map
What this means for you Summary
Snapshot
- This is a 4-bed/2.5-bath single-family listed at $320k. Condition is rated good.
Deal economics
- At list price, monthly cash flow is $-468 ($-6k/yr) — negative.
- The deal already cash-flows at list — no discount required.
- To meet the 1% rule (rent ≥ 1% of price), the offer needs to be $286k (10.7% below list).
- Recommended offer: $282k (12.0% below list) — sets the bar for market timing.
Location & tenants
- Location reads 62/100 on livability (#907 in TX) — a middle-class / working-renter tenant base. Strengths: cost of living A+, housing A+; Watch: crime D+, schools F, amenities F.
- Dickinson ISD (suburban): math 39% / reading 40% proficiency, ranked #366 of 826 in TX (top 44%) — families likely to look elsewhere, expect single-tenant / working-renter base with shorter leases; 60% free/reduced lunch — lower-income household profile, screen leases tightly.
- Market conditions: Rents rising (+4.0%/yr); 654 active listings in the ZIP; 5 comparable units currently listed for rent nearby; rentals leasing fast (median 11d on market — plan ~1-2 weeks tenant-placement turnaround); 3,258 units permitted in Galveston County in 2024 (0 in 5+ unit buildings).
- At $2,856/mo this rent would consume 46% of the median local household income ($75k/yr) (locally 700% of renters already pay >50% of income on rent) — very limited rent-growth headroom before tenants either downsize or default.
Forward outlook
- Local home prices are declining (-3.0%/yr); year-one equity from $3k of loan paydown is wiped out by about $12k of value loss. Plan a longer hold.
- Galveston County population projected at +43% by 2050 — long-run rental-demand tailwind backs the buy-and-hold thesis.
Negotiation context
- It's been on market 443 days — a 12% lower offer ($282k) is reasonable based on typical stale-listing flexibility.
Questions for the listing agent
- What do current leases actually rent for vs. the listed asking? Can we see a recent rent roll and the last 12 months of T-12 income?
- It's been on market 443 days. Have you received any prior offers? Is the seller open to a 12% concession, seller financing, or rate buy-down credit?
- Why hasn't it sold? Are there any deal-killer items the seller is aware of (foundation, flood, title, zoning, code violations)?
- Is there a deadline driving the sale (1031 exchange, divorce, estate, relocation)? That informs how much negotiation room exists.
- Schools are F-rated, which usually means shorter tenancies and higher turnover. Who's the typical renter profile here, and what's been the actual vacancy rate?
- Crime grade is D in this area — have there been break-ins, vandalism, or insurance claims at this property in the last 3 years? What carrier currently insures it and at what premium?
- The area grade is low — what's the realistic commute time and amenity access for the typical tenant pool here? Any planned neighborhood developments (good or bad) we should know about?
- What's the average days-on-market for RENTAL listings here right now (not sales)? A rising rental-DOM trend means longer vacancies and softer asking-rent achievability than the comps imply.
- What's the recent tenant-quality profile in this submarket — average credit score on applications, eviction rate, late-payment / NSF rate, and stable-employment percentage? A property-management company in the area should have these aggregated.
- How much new for-sale + rental construction is in the pipeline within 1–3 miles? Heavy new supply typically softens prices + rents 12–24 months out; constrained supply supports both.
Investment metrics
- 1% rule
- 0.72% ✗
- Cap rate
- 4.87%
- Cash-on-cash
- -5.09%
- DSCR
- 0.77
- GRM
- 11.5
CMA / ARV
- ARV (median comp)
- $394,186
- List price
- $319,990
- Delta
- -18.82%
- Verdict
- UNDERPRICED
- Comps
- 20 within 1.0 mi
Show comp detail 12 sales within ~0.75 mi
| Address | Dist | Beds/Ba | Sqft | Sold | Price | $/sf | Match |
|---|---|---|---|---|---|---|---|
| 2921 Mariner Island Dr | 0.20mi | 4/2.0 | 2,081 (-11%) | 1mo | $375,990 | $181 | 70 |
| 3406 Bright Keel Dr | 0.29mi | 4/3.0 | 2,582 (+11%) | 0mo | $396,990 | $154 | 67 |
| 3214 Bolt Rope Dr | 0.54mi | 4/2.5 | 2,452 (+5%) | 1mo | $339,990 | $139 | 66 |
| 14121 Baikal Manor Dr | 0.53mi | 4/3.0 | 2,214 (-5%) | 1mo | $349,990 | $158 | 64 |
| 2417 Arbor Edge Xing | 0.63mi | 4/2.5 | 2,204 (-6%) | 0mo | $345,000 | $157 | 61 |
| 3315 Hidden Mist Dr | 0.49mi | 3/2.5 (-1) | 2,160 (-8%) | 1mo | $344,990 | $160 | 59 |
| 2221 Lake Mist Dr | 0.66mi | 4/2.5 | 2,178 (-7%) | 0mo | $326,900 | $150 | 58 |
| 13009 Oleander Bay Ln | 0.46mi | 4/3.0 | 2,040 (-13%) | 0mo | $325,000 | $159 | 55 |
| 2725 Arbor Edge Xing | 0.68mi | 4/2.0 | 2,174 (-7%) | 0mo | $339,500 | $156 | 55 |
| 14117 Baikal Manor Dr | 0.52mi | 4/2.0 | 2,063 (-12%) | 1mo | $312,990 | $152 | 54 |
| 13602 Hartwell Bend Dr | 0.34mi | 4/4.0 | 2,679 (+15%) | 1mo | $499,990 | $187 | 53 |
| 2307 Sweet Bay Dr | 0.61mi | 4/2.5 | 2,671 (+14%) | 1mo | $309,900 | $116 | 47 |
Match score weights: distance 35% · size 25% · config 20% · recency 20%. Top-matched comps best support the ARV.
Projected returns pro-forma
-3.0% appreciation · 3.95% rent growth · sell at horizon
- IRR
- -23.9%
- Equity multiple
- 0.18×
- Total profit
- $-90,879
- Equity at exit
- $58,774
- IRR
- -16.6%
- Equity multiple
- 0.04×
- Total profit
- $-105,809
- Equity at exit
- $34,082
Cash invested: $110,372 (down + closing). Projections, not guarantees.
Landlord ↔ Tenant lean methodology
- Overall (STATE)
- 87 Strongly Landlord-Friendly
- State Texas
- 87 Strongly Landlord-Friendly · R+5
- County
- — inherits STATE
- City
- — inherits STATE
ZIP-level market 77568
- Home prices YoY
- -22.7%
- Rents YoY
- 4.0%
- Active inventory
- 654
- Price-to-rent
- 9.3×
Monthly cashflow live
- Estimated rent
- $2,856 high interval (Pro) →
- Mortgage (P&I)
- −$2,067
- Tax est. 1.5%
- −$493 /mo · $5,913/yr
- Insurance
- −$164
- HOA
- −$0
- Vacancy / Maint / Mgmt
- −$600
- Net cashflow
- $-468
Break-even live
UW: 25.0% down · 7.5% · 30yr · 1.5% tax · 5.0% vac · 8.0% maint · 8.0% mgmt
Financing live
Cash to close
- Down payment
- $98,547
- Closing costs
- $11,826
- Reserves months
- —
- Total cash needed
- —
Loan-product check · same deal, 3 products live
Conventional
25% down · 7.5% · 30yr
- Down + closing
- —
- Monthly P&I
- —
- Monthly cashflow
- —
- DSCR
- —
- Eligible?
- —
Personal DTI + credit; lowest rate.
DSCR
20% down · 8.5% · 30yr
- Down + closing
- —
- Monthly P&I
- —
- Monthly cashflow
- —
- DSCR
- —
- Eligible?
- —
No personal income docs; deal must DSCR.
Hard money
10% down · 12.0% · 12mo
- Down + closing
- —
- Monthly P&I
- —
- Monthly cashflow
- —
- DSCR
- —
- Eligible?
- —
Short-term bridge; refi at stabilization.
Rent comps 5 comps
| Address | Beds | Baths | Sqft | Rent | $/sqft | DOM | Units | Dist |
|---|---|---|---|---|---|---|---|---|
| 13817 Starboard Reach Dr Santa Fe, TX | 3.0–4.0 | 2.0–3.5 | 2268 | $3,630 | $1.60 | 1d | 1 | 0.55mi |
| 12524 Jetty Cv Santa Fe, TX | 3.0 | 2.0 | 1803 | $2,506 | $1.39 | 22d | 1 | 0.93mi |
| 640 Totem Trail Dr La Marque, TX | 4.0 | 2.5 | 2134 | $2,309 | $1.08 | 11d | 1 | 1.10mi |
| 2437 Regatta Ln La Marque, TX | 4.0 | 2.0 | 1844 | $2,079 | $1.13 | 5d | 1 | 1.20mi |
| 2301 Starboard Sail Alta Loma, TX | 4.0 | 2.0 | 1856 | $2,181 | $1.18 | 11d | 1 | 1.36mi |
Listing history 15 events
-
2026-06-18days on market $319,990 Active 443 DOM
-
2026-06-17days on market $319,990 Active 442 DOM
-
2026-06-16days on market $319,990 Active 441 DOM
-
2026-06-15days on market $319,990 Active 440 DOM
-
2026-06-13days on market $319,990 Active 438 DOM
-
2026-06-09days on market $319,990 Active 434 DOM
-
2026-06-08days on market $319,990 Active 433 DOM
-
2026-06-07days on market $319,990 Active 432 DOM
-
2026-06-04days on market $319,990 Active 429 DOM
-
2026-06-03days on market $319,990 Active 428 DOM
-
2026-06-02days on market $319,990 Active 427 DOM
-
2026-06-02days on market $319,990 Active 426 DOM
-
2026-05-31days on market $319,990 Active 425 DOM
-
2025-06-04price $319,990 1063-char remark
Show marketing remark (1063 chars)
Boasting an open-concept layout consisting of four large bedrooms, and 2.5 bathrooms, the Hickory home is nothing short of practical! Entering the home, you are greeted by the foyer area and convenient downstairs powder room. You are then led to the central area of the home featuring the combined kitchen and dining area. The kitchen includes plenty of countertop space with an island, granite countertops, designer light fixtures, and industry-leading appliances. Facing the kitchen & dining area is the spacious family room with access to the backyard - if you'd love to enjoy a cup of coffee outside in the morning, opt to include a covered patio! Completing the first floor is the large master suite. The attached master bathroom includes a super shower, cultured marble countertops, as well as a huge walk-in closet. Upstairs resides the game room, perfect for the kids, three additional bedrooms with walk-in closets, and another full bathroom. With enough room to sprawl out, the Hickory plan is perfectly sized to accommodate most any sized family!
-
2025-04-01$322,990 Active 1063-char remark
Show marketing remark (1063 chars)
Boasting an open-concept layout consisting of four large bedrooms, and 2.5 bathrooms, the Hickory home is nothing short of practical! Entering the home, you are greeted by the foyer area and convenient downstairs powder room. You are then led to the central area of the home featuring the combined kitchen and dining area. The kitchen includes plenty of countertop space with an island, granite countertops, designer light fixtures, and industry-leading appliances. Facing the kitchen & dining area is the spacious family room with access to the backyard - if you'd love to enjoy a cup of coffee outside in the morning, opt to include a covered patio! Completing the first floor is the large master suite. The attached master bathroom includes a super shower, cultured marble countertops, as well as a huge walk-in closet. Upstairs resides the game room, perfect for the kids, three additional bedrooms with walk-in closets, and another full bathroom. With enough room to sprawl out, the Hickory plan is perfectly sized to accommodate most any sized family!
ⓘ Source: listings_history table (triggers on properties + properties_extension) + one-shot
backfill from property_details.listing_events for pre-trigger history.
Nearby sold comps map
Loading sold comps map…
Walkable amenities ~0.75 mi
Loading nearby amenities…
Taxation est. · year 1
- Rental income
- $34,271
- − Mortgage interest
- −$22,081
- − Property taxes
- −$5,913
- − Insurance
- −$1,971
- − Repairs & maintenance
- −$2,742
- − Management
- −$2,742
- − Depreciation
- −$11,467
- Taxable loss
- −$12,644
- Est. tax savings @ 24.0%
- +$3,034
- After-tax cash flow
- $-2,581/yr
For passive investors: Depreciation is non-cash, so a rental often shows a tax loss while cash-flowing — sheltering income. Rental losses are passive: they offset passive income freely, and up to $25,000/yr can offset ordinary (W-2) income if you actively participate and your MAGI is under $100k (phasing out to $0 by $150k); unused losses carry forward. On sale, claimed depreciation is recaptured at up to 25%, and gains may owe capital-gains tax (a 1031 exchange can defer both). Figures are a year-1 estimate at your 24.0% rate — not tax advice; consult a CPA.
Condition & rehab AI · 12 photos
This home is in good condition with a good condition score of 80. It has a cosmetic rehab level and requires minimal repairs and maintenance. The highest-ROI updates would be landscaping, upgrading light fixtures, and painting interior walls to enhance curb appeal and interior aesthetics.
Value-add opportunities
- Both landscaping — improves curb appeal and enhances property value
- Both upgrading light fixtures — enhances curb appeal and interior aesthetics
- Both painting interior walls — refreshes the interior and enhances curb appeal
Renovation cost estimate screening
Value-add ROI direction
- Both landscaping — improves curb appeal and enhances property value ↑
- Both upgrading light fixtures — enhances curb appeal and interior aesthetics ↑
- Both painting interior walls — refreshes the interior and enhances curb appeal ↑
ⓘ Cost ranges are severity-bucket heuristics (US national rule-of-thumb). Get contractor quotes + a written scope before underwriting a rehab budget.
Schools (NCES district)
- District
- Dickinson ISD
- NCES district ID
- 4817070
- Math proficiency
- 39% ▼ -11.00%
- Reading proficiency
- 40% ▼ -2.00%
- Median HH income
- $61,318
- Composite
- 35.16/100
- National rank
- #5005
- State rank
- #366 of 826 in TX
Livability — Texas City
- Score
- 62/100
- State rank
- #907
- US rank
- #16268
Category grades
Schools grade is shown separately in the Schools card above.
Census & demographics
- Census place
- Texas City, TX
- County
- Galveston County · 357,330 people
- City population
- 49,936
- Metro
- Houston-The Woodlands-Sugar Land, TX
- Population (ZIP)
- 23,083
- Household income
- $74,694
- Rent vs Own
- Severe rent burden
- 700.0
Population outlook (Galveston County) Hauer SSP2
- Today (2025)
- 390,640 people
- By 2030
- 425,226 · +8.9%
- By 2040
- 493,765 · +26.4%
- By 2050
- 559,698 · +43.3%
- By 2075
- 719,260 · +84.1%
- By 2100
- 819,628 · +109.8%
Race, ethnicity, and origin ACS 2023
- Neighborhood character
- Highly diverse neighborhood (Simpson 0.71)
- Race & ethnicity
- White 37% Hispanic / Latino 29% Black 26% Two or more races 17% Asian 3%
- Hispanic origin (detail)
- Mexican 22% Puerto Rican 1%
- Common ancestry
- Lithuanian 1% Italian 1% Serbian 1%
- Foreign-born
- 8% · Canada
- Languages at home
- 77% English-only · Spanish 21% Tagalog/Filipino 1% Other Asian/Pacific 1%
Political lean MEDSL · Galveston
- 2024 margin
- Strong R (+27.4) · D 35.7% · R 63.1% · Other 1.2%
- 2008→2024 swing
- -7.9pp toward R · 2008: -19.5pp · 2024: -27.4pp
- All cycles
- 2024: R+27.4 2020: R+22.6 2016: R+22.6 2012: R+26.9 2008: R+19.5
Not yet ingested
- Civics
- —
Market trends
- HPI YoY
- ▼ -69.39%
- Current HPI
- 236.0239
- Rent YoY
- ▲ 3.95%
- Metro
- Houston-The Woodlands-Sugar Land, TX
- State GDP YoY
- ▲ 3.95%
- F500 in state
- 110
Industry mix (Fortune 500 HQ in TX)
| Industry | F500 HQs | Revenue |
|---|---|---|
| Energy | 16 | $1,198B |
|
||
| Technology | 5 | $198B |
|
||
| Engineering / Construction | 4 | $72B |
|
||
| Energy Services | 3 | $60B |
|
||
| Utilities | 3 | $41B |
|
||
| Healthcare | 2 | $330B |
|
||
Price history
-0.9% since first listed2 events — show timeline
- 2025-06-04 Price Changed $319,990 Zillow
- 2025-04-01 Listed $322,990 Zillow
Cash-flow waterfall
monthlySold comps — $/sqft
last 12 mo · ≤1 miLoading sold comps…