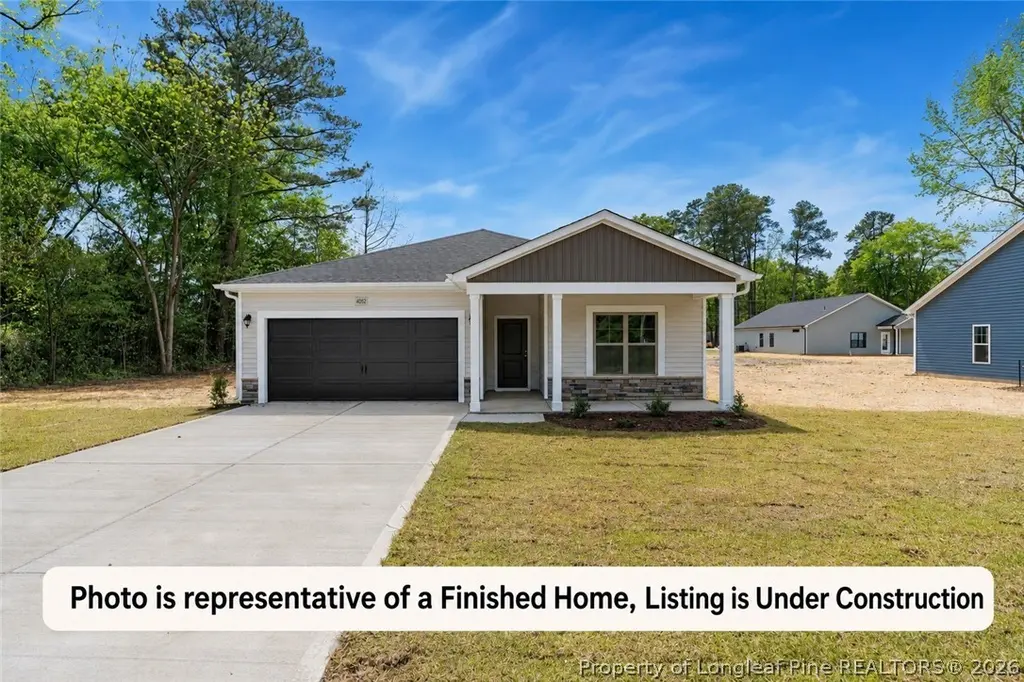
 🏗️ New Construction
5186 Jaycee St · Stedman, NC
Flood risk 1/10 · Minimal
- FEMA flood zone
- X (unshaded)
- Chance of flooding over 30 yrs
- 0.0%
- Est. flood insurance / yr
- $507 – $1,088
Fire risk 6/10 · Moderate
- Est. fire insurance / yr
- $906 – $1,684
Heat risk 7/10 · Major
- Hot days now (above 106°F)
- 7 days/yr
- Hot days in 30 yrs
- 16 days/yr
Wind risk 7/10 · Major
- Chance of severe wind over 30 yrs
- 78.0%
Air-quality risk 1/10 · Minimal
- Unhealthy air days now
- 0 days/yr
- Unhealthy air days in 30 yrs
- 0 days/yr
Risk factors via First Street. Map © Google.
Why this score? — see what drove the D grade
The composite is a weighted blend of 9 inputs, each scored 0–100. Each bar is that input's sub-score; the figure is the points it added to the 100-point composite (weight × sub-score).
- Appreciation +10.0/10.0
- Cash flow +8.0/30.0
- ARV discount +7.5/15.0
- Livability +3.6/5.0
- Schools +3.1/10.0
- 1% rule +2.5/10.0
- Rent growth +2.5/5.0
- Condition / age +2.5/5.0
- DSCR +2.1/10.0
$317,900
🖨 Deal sheet 📄 Offer letter ✓ Due diligence
Listing remarks
The Dorchester, built by A & G Residential, is a thoughtfully designed 4-bedroom, 2-bathroom home offering 1,850 square feet of versatile living space. This open-concept plan blends comfort and style, featuring a spacious kitchen adjacent to the dining area and great room — perfect for everyday living and entertaining. The split-bedroom layout provides privacy, while the primary suite boasts a generous walk-in closet and spacious bath. A fourth bedroom offers flexibility as a home office, guest suite, or playroom. With a dedicated laundry room and ample storage throughout, this home truly checks all the boxes. Located in downtown Stedman, this neighborhood is ideal for buyers seek
Key facts
- 0.33 acre lot
- 2 garage spots
- Built 2026
Property features AI
Finance
- Other: Lot is cleared with paved road access; Lot approximately 0.33 acres; Zoned R10 (Residential District); Subdivision: STEDMAN
Exterior
- Parking: Attached 2-car garage; 2 covered parking spaces
- Utilities: Public water; Public sewer
- Home design: Single-family residence; Residential property; New construction
- Construction: Vinyl siding
- Exterior features: Covered patio
Interior
- Kitchen: Dishwasher; Microwave; Range; Granite counters; Pantry
- Bedrooms: Includes multiple bedrooms (5 total rooms in home)
- Flooring: Carpet; Vinyl
- Bathrooms: 2 full bathrooms
- Heating & cooling: Heat pump; Central air conditioning
- Interior features: Entrance foyer; Granite counters; Pantry; Walk-in closet(s); Electric fireplace
- Laundry & utility: Washer hookup; Laundry on main level; In-unit laundry
Neighborhood map
What this means for you Summary
Snapshot
- This is a 4-bed/2.0-bath single-family listed at $318k.
Deal economics
- At list price, monthly cash flow is $-284 ($-3k/yr) — negative.
- To cash-flow at today's rent, offer at most $240k (24.5% below list).
- To meet the 1% rule (rent ≥ 1% of price), the offer needs to be $210k (33.9% below list).
- Recommended offer: $210k (33.9% below list) — sets the bar for 1% rule.
Location & tenants
- Location reads 71/100 on livability (#107 in NC) — a middle-class / working-renter tenant base. Strengths: crime A+, employment A+, cost of living A+; Watch: amenities F, commute F, health & safety F.
- Cumberland County Schools (urban): math 32% / reading 41% proficiency, ranked #126 of 178 in NC (top 71%) — families likely to look elsewhere, expect single-tenant / working-renter base with shorter leases.
- Zoned schools: Stedman Elementary (math 57% / reading 52%, grade C, #302 of 1,410 statewide, top 23%, 271 students, 99% FRL); Mac Williams Middle (math 40% / reading 50%, grade D, #160 of 475 statewide, top 35%, 1,151 students, 58% FRL); Cape Fear High (math 75% / reading 47%, grade C+, #202 of 535 statewide, top 39%, 1,529 students, 50% FRL).
- Zoned-school proficiency averages 54% at this address vs 36% district-wide (+17 pts) — the actual schools serving this property are materially stronger than the Cumberland County Schools average implies; a family-tenant draw the district grade alone would hide.
- Market conditions: 33 active listings in the ZIP; 1 comparable units currently listed for rent nearby; 1,125 units permitted in Cumberland County in 2024 (104 in 5+ unit buildings).
Forward outlook
- In year one you build about $30k of equity ($2k loan paydown + $28k appreciation (10.0% local appreciation)).
- By year 2, paydown + projected appreciation supports a ~$48k cash-out refi (75% LTV) — recoverable capital for the next deal without selling this one.
Negotiation context
- It's been on market 23 days — a 2% lower offer ($313k) is reasonable based on typical stale-listing flexibility.
Risks & watch-outs
- Climate carrying-cost: major wind risk, 78% chance of damaging wind over 30y; major wildfire risk; extreme-heat days projected 7→16/yr by 2055 (HVAC capex compounding) — expect insurance premiums to compound above CPI over the hold.
Questions for the listing agent
- What do current leases actually rent for vs. the listed asking? Can we see a recent rent roll and the last 12 months of T-12 income?
- Is there a deadline driving the sale (1031 exchange, divorce, estate, relocation)? That informs how much negotiation room exists.
- The area grade is low — what's the realistic commute time and amenity access for the typical tenant pool here? Any planned neighborhood developments (good or bad) we should know about?
- What's the average days-on-market for RENTAL listings here right now (not sales)? A rising rental-DOM trend means longer vacancies and softer asking-rent achievability than the comps imply.
- What's the recent tenant-quality profile in this submarket — average credit score on applications, eviction rate, late-payment / NSF rate, and stable-employment percentage? A property-management company in the area should have these aggregated.
- How much new for-sale + rental construction is in the pipeline within 1–3 miles? Heavy new supply typically softens prices + rents 12–24 months out; constrained supply supports both.
Investment metrics
- 1% rule
- 0.75% ✗
- Cap rate
- 5.08%
- Cash-on-cash
- -4.33%
- DSCR
- 0.81
- GRM
- 11.2
CMA / ARV
- ARV (on-the-fly)
- $281,200
- Comps found
- 9
Show comp detail 9 sales within ~0.75 mi
| Address | Dist | Beds/Ba | Sqft | Sold | Price | $/sf | Match |
|---|---|---|---|---|---|---|---|
| 214 & 218 Carol St | 0.19mi | 5/3.0 (+1) | 1,856 (+0%) | 21mo | $75,000 | $40 | 64 |
| 419 Lake Edge Ln | 0.60mi | 4/2.5 | 1,932 (+4%) | 16mo | $275,000 | $142 | 49 |
| 6301 Emerson Grove (lot 1) Ct | 0.74mi | 3/2.0 (-1) | 1,774 (-4%) | 10mo | $314,900 | $178 | 45 |
| 6305 Emerson Grove (lot 2) Ct | 0.72mi | 4/2.0 | 2,012 (+9%) | 14mo | $344,900 | $171 | 40 |
| 605 Bird Nest Ct | 0.69mi | 3/2.0 (-1) | 1,742 (-6%) | 19mo | $250,000 | $144 | 37 |
| 712 Mill Bay Dr | 0.70mi | 3/2.0 (-1) | 1,573 (-15%) | 2mo | $213,750 | $136 | 36 |
| 6204 Azelia Dr | 0.70mi | 4/2.0 | 1,618 (-12%) | 15mo | $250,000 | $155 | 34 |
| 6251 Azelia Dr | 0.72mi | 4/2.0 | 1,671 (-10%) | 20mo | $263,500 | $158 | 34 |
| 610 Bird Nest Ct | 0.73mi | 3/2.0 (-1) | 1,648 (-11%) | 16mo | $250,000 | $152 | 29 |
Match score weights: distance 35% · size 25% · config 20% · recency 20%. Top-matched comps best support the ARV.
Projected returns pro-forma
10.0% appreciation · 3.0% rent growth · sell at horizon
- IRR
- 21.2%
- Equity multiple
- 2.72×
- Total profit
- $135,073
- Equity at exit
- $253,327
- IRR
- 19.2%
- Equity multiple
- 6.23×
- Total profit
- $412,070
- Equity at exit
- $546,310
Cash invested: $78,736 (down + closing). Projections, not guarantees.
Landlord ↔ Tenant lean methodology
- Overall (STATE)
- 85 Strongly Landlord-Friendly
- State North Carolina
- 85 Strongly Landlord-Friendly · R+3
- County
- — inherits STATE
- City
- — inherits STATE
ZIP-level market 28391
- Home prices YoY
- 16.1%
- Active inventory
- 33
- Price-to-rent
- 12.6×
Monthly cashflow live
- Estimated rent
- $2,100 medium interval (Pro) →
- Mortgage (P&I)
- −$1,475
- Tax est. 1.5%
- −$352 /mo · $4,218/yr
- Insurance
- −$117
- HOA
- −$0
- Vacancy / Maint / Mgmt
- −$441
- Net cashflow
- $-284
Break-even live
UW: 25.0% down · 7.5% · 30yr · 1.5% tax · 5.0% vac · 8.0% maint · 8.0% mgmt
Financing live
Cash to close
- Down payment
- $70,300
- Closing costs
- $8,436
- Reserves months
- —
- Total cash needed
- —
Loan-product check · same deal, 3 products live
Conventional
25% down · 7.5% · 30yr
- Down + closing
- —
- Monthly P&I
- —
- Monthly cashflow
- —
- DSCR
- —
- Eligible?
- —
Personal DTI + credit; lowest rate.
DSCR
20% down · 8.5% · 30yr
- Down + closing
- —
- Monthly P&I
- —
- Monthly cashflow
- —
- DSCR
- —
- Eligible?
- —
No personal income docs; deal must DSCR.
Hard money
10% down · 12.0% · 12mo
- Down + closing
- —
- Monthly P&I
- —
- Monthly cashflow
- —
- DSCR
- —
- Eligible?
- —
Short-term bridge; refi at stabilization.
Rent comps 1 comps
| Address | Beds | Baths | Sqft | Rent | $/sqft | DOM | Units | Dist |
|---|---|---|---|---|---|---|---|---|
| 6205 Yorkie Ct Stedman, NC | 4.0 | 3.0 | 2069 | $2,100 | $1.01 | 13d | 1 | 0.80mi |
Listing history 16 events
-
2026-06-18days on market $317,900 Active 23 DOM
-
2026-06-17days on market $317,900 Active 22 DOM
-
2026-06-16days on market $317,900 Active 21 DOM
-
2026-06-15days on market $317,900 Active 20 DOM
-
2026-06-14days on market $317,900 Active 18 DOM
-
2026-06-13days on market $317,900 Active 17 DOM
-
2026-06-10days on market $317,900 Active 15 DOM
-
2026-06-09days on market $317,900 Active 14 DOM
-
2026-06-08days on market $317,900 Active 13 DOM
-
2026-06-07days on market $317,900 Active 12 DOM
-
2026-06-03days on market $317,900 Active 8 DOM
-
2026-06-02days on market $317,900 Active 7 DOM
-
2026-06-01days on market $317,900 Active 6 DOM
-
2026-05-31days on market $317,900 Active 5 DOM
-
2026-05-30days on market $317,900 Active 4 DOM
-
2026-05-27$317,900 Active
ⓘ Source: listings_history table (triggers on properties + properties_extension) + one-shot
backfill from property_details.listing_events for pre-trigger history.
Climate risk First Street
- Flood 1/10 Low FEMA zone X (unshaded) · 0% chance over 30 yrs
- Wildfire 6/10 Major
- Heat 7/10 Severe 7 d/yr ≥106°F today · 16 d/yr by 30 yrs out
- Wind 7/10 Severe 78% chance of damaging wind over 30 yrs
- Air quality 1/10 Low 0 unhealthy d/yr today · 0 by 30 yrs out
Nearby sold comps map
Loading sold comps map…
Walkable amenities ~0.75 mi
Loading nearby amenities…
Taxation est. · year 1
- Rental income
- $25,200
- − Mortgage interest
- −$15,752
- − Property taxes
- −$4,218
- − Insurance
- −$1,406
- − Repairs & maintenance
- −$2,016
- − Management
- −$2,016
- − Depreciation
- −$8,180
- Taxable loss
- −$8,388
- Est. tax savings @ 24.0%
- +$2,013
- After-tax cash flow
- $-1,399/yr
For passive investors: Depreciation is non-cash, so a rental often shows a tax loss while cash-flowing — sheltering income. Rental losses are passive: they offset passive income freely, and up to $25,000/yr can offset ordinary (W-2) income if you actively participate and your MAGI is under $100k (phasing out to $0 by $150k); unused losses carry forward. On sale, claimed depreciation is recaptured at up to 25%, and gains may owe capital-gains tax (a 1031 exchange can defer both). Figures are a year-1 estimate at your 24.0% rate — not tax advice; consult a CPA.
Schools (NCES district)
- District
- Cumberland County Schools
- NCES district ID
- 3700011
- Math proficiency
- 32% ▼ -2.00%
- Reading proficiency
- 41% ▼ -1.00%
- Median HH income
- $44,168
- Composite
- 31.0/100
- National rank
- #6096
- State rank
- #126 of 178 in NC
Livability — Stedman
- Score
- 71/100
- State rank
- #107
- US rank
- #6799
Category grades
Schools grade is shown separately in the Schools card above.
Census & demographics
- Census place
- Stedman, NC
- Population (ZIP)
- 5,956
Population outlook (Cumberland County) Hauer SSP2
- Today (2025)
- 330,855 people
- By 2030
- 333,523 · +0.8%
- By 2040
- 335,583 · +1.4%
- By 2050
- 335,325 · +1.4%
- By 2075
- 342,853 · +3.6%
- By 2100
- 340,698 · +3.0%
Race, ethnicity, and origin ACS 2023
- Neighborhood character
- Predominantly White (77%)
- Race & ethnicity
- White 77% Black 12% Two or more races 7% Hispanic / Latino 2% Native American 2%
- Common ancestry
- Slovak 4% Serbian 2% Iranian 2%
- Foreign-born
- 2% · Canada
- Languages at home
- 98% English-only · Spanish 1%
Political lean MEDSL · Cumberland
- 2024 margin
- D (+13.4) · D 56.1% · R 42.7% · Other 1.2%
- 2008→2024 swing
- -4.3pp toward R · 2008: 17.7pp · 2024: 13.4pp
- All cycles
- 2024: D+13.4 2020: D+16.6 2016: D+16.0 2012: D+19.7 2008: D+17.7
Not yet ingested
- Civics
- —
Market trends
- HPI YoY
- ▲ 46.06%
- Current HPI
- 331.7099
- Rent YoY
- —
- Metro
- —
- State GDP YoY
- ▲ 3.28%
- F500 in state
- 26
Industry mix (Fortune 500 HQ in NC)
| Industry | F500 HQs | Revenue |
|---|---|---|
| Financial Services | 2 | $213B |
|
||
| Retail | 2 | $95B |
|
||
| Industrial Conglomerate | 1 | $38B |
|
||
| Metals / Steel | 1 | $35B |
|
||
| Utilities | 1 | $30B |
|
||
| Industrial Machinery | 1 | $19B |
|
||
Price history
1 event — show timeline
- 2026-05-27 Listed $317,900 LPRMLS
Cash-flow waterfall
monthlySold comps — $/sqft
last 12 mo · ≤1 miLoading sold comps…