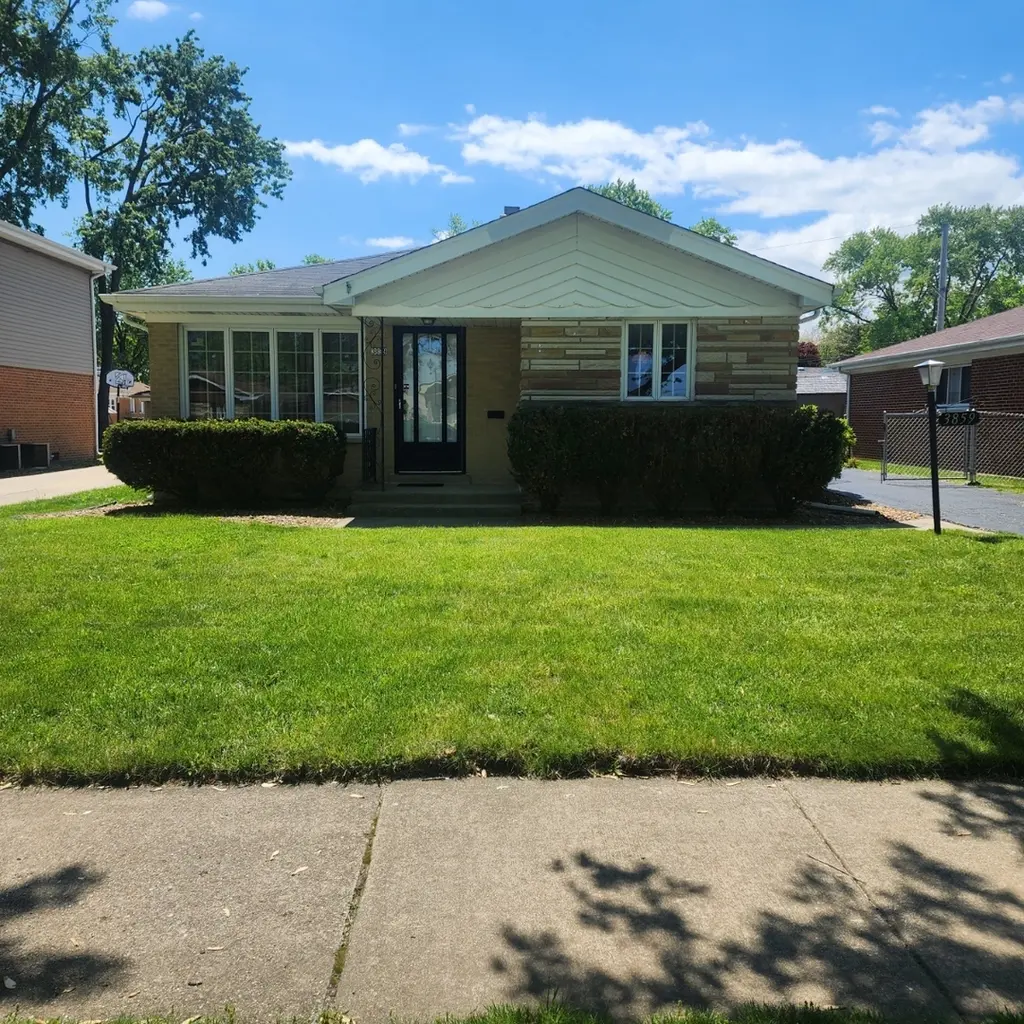
3859 153rd St · Midlothian, IL
Flood risk 1/10 · Minimal
- FEMA flood zone
- X (unshaded)
- Chance of flooding over 30 yrs
- 0.0%
- Est. flood insurance / yr
- $473 – $860
Fire risk 1/10 · Minimal
- Est. fire insurance / yr
- $804 – $1,492
Heat risk 3/10 · Minor
- Hot days now (above 102°F)
- 7 days/yr
- Hot days in 30 yrs
- 15 days/yr
Wind risk 2/10 · Minimal
- Chance of severe wind over 30 yrs
- —
Air-quality risk 3/10 · Minor
- Unhealthy air days now
- 4 days/yr
- Unhealthy air days in 30 yrs
- 4 days/yr
Risk factors via First Street. Map © Google.
Why this score? — see what drove the F grade
The composite is a weighted blend of 9 inputs, each scored 0–100. Each bar is that input's sub-score; the figure is the points it added to the 100-point composite (weight × sub-score).
- Cash flow +14.2/30.0
- DSCR +4.3/10.0
- 1% rule +4.2/10.0
- Livability +3.9/5.0
- Rent growth +2.5/5.0
- Condition / age +2.5/5.0
- Schools +1.5/10.0
- ARV discount +0.0/15.0
- Appreciation +0.0/10.0
$265,000
🖨 Deal sheet (PDF) 📄 Offer letter ✓ Due diligence
Listing remarks
Charming 3-bedroom, 1-bath home full of character and potential! Features include a deep driveway with gated access to the 2-car garage, ceiling fans in all bedrooms. Inside, you'll find carpet throughout with original hardwood floors underneath waiting to be brought back to life. Spacious rooms and a functional layout provide a great opportunity for updates and personal touches to make this home your own. Conveniently located and being sold as-is.
Key facts
- Ceiling fans
- Cozy fireplace
- Functional layout
Tags
Property features AI
Finance
- Other: Ownership: Fee simple
- HOA & community: No master association fees required
Exterior
- Parking: Detached garage; Asphalt driveway; Two parking spaces total
- Utilities: Public water; Public sewer; Electric service with circuit breakers
- Home design: Detached single-family home; One-story
- Construction: Stone exterior; Built approximately 61–70 years ago; Built before 1978
- Exterior features: Lot less than 0.25 acre; School bus service, commuter bus and train access, interstate access
Interior
- Kitchen: Kitchen on main level (13 x 15); Range; Dishwasher; Refrigerator
- Bedrooms: Master bedroom on main level (14 x 16); Bedroom on main level (11 x 14); Bedroom on main level (11 x 12)
- Flooring: Carpet in living room and bedrooms; Laminate flooring in kitchen
- Bathrooms: One full bathroom
- Heating & cooling: Natural gas heating; Central air conditioning
- Interior features: Five total rooms; Crawl space basement; Electric fireplace in the living room
- Laundry & utility: Main-level laundry room (11 x 14); Washer; Dryer
Neighborhood map
What this means for you Summary
Snapshot
- This is a 3-bed/1.0-bath single-family listed at $265k.
Deal economics
- At list price, monthly cash flow is $46 ($547/yr) — positive.
- The deal already cash-flows at list — no discount required.
- To meet the 1% rule (rent ≥ 1% of price), the offer needs to be $244k (8.0% below list).
- Recommended offer: $244k (8.0% below list) — sets the bar for 1% rule.
- Cap rate 6.5% vs local median 5.0% in Midlothian — meaningfully above typical; check what's discounted (condition, days-on-market, listing class) to confirm the premium yield is real.
Location & tenants
- Location reads 78/100 on livability (#133 in IL, #2,433 nationally) — a middle-class / working-renter tenant base. Strengths: commute A+, cost of living A+, housing A+; Watch: health & safety D+, amenities D-.
- Bremen Chsd 228 (suburban): math 15% / reading 17% proficiency, ranked #468 of 620 in IL (top 76%) — low school quality limits family demand, transient renter base, plan for 1-2y turnover.
- Zoned schools: Central Park Elem School (math 4% / reading 14%, grade F, #1,611 of 2,056 statewide, top 79%, 646 students, 0% FRL); Bremen High School (math 8% / reading 11%, grade F, #577 of 693 statewide, top 84%, 1,497 students, 0% FRL).
- Market conditions: 48 active listings in the ZIP; 5 comparable units currently listed for rent nearby; rentals leasing fast (median 0d on market — plan ~1-2 weeks tenant-placement turnaround); 6,272 units permitted in Cook County in 2024 (4,658 in 5+ unit buildings).
Forward outlook
- Local home prices are declining (-3.0%/yr); year-one equity from $2k of loan paydown is wiped out by about $8k of value loss. Plan a longer hold.
Negotiation context
- It's been on market 39 days — a 3% lower offer ($257k) is reasonable based on typical stale-listing flexibility.
Risks & watch-outs
- Watch-outs: built in 1959 — expect roof / HVAC / electrical / plumbing capex.
Questions for the listing agent
- It's been on market 39 days. Have you received any prior offers? Is the seller open to a 8% concession, seller financing, or rate buy-down credit?
- Built in 1959 — when were the roof, HVAC, electrical panel, plumbing, and water heater last replaced?
- Is there a deadline driving the sale (1031 exchange, divorce, estate, relocation)? That informs how much negotiation room exists.
- Schools are F-rated, which usually means shorter tenancies and higher turnover. Who's the typical renter profile here, and what's been the actual vacancy rate?
- The area grade is low — what's the realistic commute time and amenity access for the typical tenant pool here? Any planned neighborhood developments (good or bad) we should know about?
- What's the average days-on-market for RENTAL listings here right now (not sales)? A rising rental-DOM trend means longer vacancies and softer asking-rent achievability than the comps imply.
- What's the recent tenant-quality profile in this submarket — average credit score on applications, eviction rate, late-payment / NSF rate, and stable-employment percentage? A property-management company in the area should have these aggregated.
- How much new for-sale + rental construction is in the pipeline within 1–3 miles? Heavy new supply typically softens prices + rents 12–24 months out; constrained supply supports both.
Investment metrics
- 1% rule
- 0.92% ✗
- Cap rate
- 6.50%
- Cash-on-cash
- 0.74%
- DSCR
- 1.03
- GRM
- 9.1
CMA / ARV
- ARV (on-the-fly)
- $223,475
- Comps found
- 12
Show comp detail 12 sales within ~0.75 mi
| Address | Dist | Beds/Ba | Sqft | Sold | Price | $/sf | Match |
|---|---|---|---|---|---|---|---|
| 15222 Hamlin Ave | 0.26mi | 3/1.5 | 1,412 (+11%) | 3mo | $235,000 | $166 | 66 |
| 15043 Tripp Ave | 0.64mi | 3/1.0 | 1,269 (-1%) | 4mo | $240,000 | $189 | 65 |
| 15435 Hamlin Ave | 0.22mi | 3/1.0 | 1,107 (-13%) | 3mo | $155,000 | $140 | 65 |
| 15235 Lawndale Ave | 0.33mi | 3/1.5 | 1,394 (+9%) | 7mo | $175,000 | $126 | 62 |
| 15215 Hamlin Ave | 0.31mi | 3/1.5 | 1,405 (+10%) | 7mo | $239,000 | $170 | 61 |
| 15120 Springfield Ave | 0.38mi | 3/2.0 | 1,127 (-12%) | 1mo | $236,000 | $209 | 58 |
| 15053 Lawndale Ave | 0.51mi | 3/1.5 | 1,379 (+8%) | 7mo | $247,500 | $179 | 55 |
| 15450 Millard Ave | 0.37mi | 3/2.0 | 1,435 (+12%) | 5mo | $245,000 | $171 | 54 |
| 15100 Avers Ave | 0.41mi | 3/2.0 | 1,123 (-12%) | 6mo | $242,000 | $215 | 52 |
| 14903 Terrace Ln | 0.70mi | 3/1.0 | 1,400 (+10%) | 2mo | $245,000 | $175 | 50 |
| 14949 Avers Ave | 0.58mi | 3/2.5 | 1,436 (+12%) | 5mo | $141,000 | $98 | 42 |
| 4326 151st St | 0.73mi | 3/2.0 | 1,158 (-9%) | 6mo | $235,000 | $203 | 42 |
Match score weights: distance 35% · size 25% · config 20% · recency 20%. Top-matched comps best support the ARV.
Projected returns pro-forma
-3.0% appreciation · 3.0% rent growth · sell at horizon
- IRR
- -15.1%
- Equity multiple
- 0.46×
- Total profit
- $-39,973
- Equity at exit
- $39,512
- IRR
- -6.5%
- Equity multiple
- 0.58×
- Total profit
- $-30,800
- Equity at exit
- $22,912
Cash invested: $74,200 (down + closing). Projections, not guarantees.
Landlord ↔ Tenant lean methodology
- Overall (STATE)
- 43 Moderately Tenant-Leaning
- State Illinois
- 43 Moderately Tenant-Leaning · D+7
- County
- — inherits STATE
- City
- — inherits STATE
ZIP-level market 60445
- Active inventory
- 48
- Price-to-rent
- 9.1×
Monthly cashflow live
- Estimated rent
- $2,437 high interval (Pro) →
- Mortgage (P&I)
- −$1,390
- Tax from tax record
- −$379 /mo · $4,553/yr
- Insurance
- −$110
- HOA
- −$0
- Vacancy / Maint / Mgmt
- −$512
- Net cashflow
- $46
Break-even live
Sensitivity live
| Price | -10% $196 | -5% $121 | +0% $46 | +5% $-29 | +10% $-104 |
|---|---|---|---|---|---|
| Rent | -10% $-147 | -5% $-51 | +0% $46 | +5% $142 | +10% $238 |
| Rate | -1.0pp $179 | -0.5pp $113 | base $46 | +0.5pp $-23 | +1.0pp $-93 |
UW: 25.0% down · 7.5% · 30yr · 1.5% tax · 5.0% vac · 8.0% maint · 8.0% mgmt
Financing live
Cash to close
- Down payment
- $66,250
- Closing costs
- $7,950
- Reserves months
- —
- Total cash needed
- —
Loan-product check · same deal, 3 products live
Conventional
25% down · 7.5% · 30yr
- Down + closing
- —
- Monthly P&I
- —
- Monthly cashflow
- —
- DSCR
- —
- Eligible?
- —
Personal DTI + credit; lowest rate.
DSCR
20% down · 8.5% · 30yr
- Down + closing
- —
- Monthly P&I
- —
- Monthly cashflow
- —
- DSCR
- —
- Eligible?
- —
No personal income docs; deal must DSCR.
Hard money
10% down · 12.0% · 12mo
- Down + closing
- —
- Monthly P&I
- —
- Monthly cashflow
- —
- DSCR
- —
- Eligible?
- —
Short-term bridge; refi at stabilization.
Rent comps 5 comps
| Address | Beds | Baths | Sqft | Rent | $/sqft | DOM | Units | Dist |
|---|---|---|---|---|---|---|---|---|
| 3952 153rd St Midlothian, IL | 4.0 | 2.0 | 1677 | $2,396 | $1.43 | 0d | 1 | 0.10mi |
| 15544 Kilpatrick Ave Oak Forest, IL | 2.0–3.0 | 2.5 | 1630 | $3,195 | $1.96 | 0d | 2 | 1.01mi |
| 14547 Keystone Ave #12 Midlothian, IL | 2.0 | 1.0 | 1000 | $1,600 | $1.60 | 1d | 1 | 1.09mi |
| 4800 W 157th St Oak Forest, IL | 1.0–2.0 | 1.0–2.0 | 1151 | $2,660 | $2.31 | 0d | 3 | 1.19mi |
| 4800 157th St Oak Forest, IL | 2.0 | 2.0 | 1031 | $2,660 | $2.58 | 0d | 1 | 1.20mi |
Listing history 15 events
-
2026-06-21days on market $265,000 Active 39 DOM
-
2026-06-18days on market $265,000 Active 36 DOM
-
2026-06-17days on market $265,000 Active 35 DOM
-
2026-06-16days on market $265,000 Active 34 DOM
-
2026-06-15days on market $265,000 Active 33 DOM
-
2026-06-13days on market $265,000 Active 31 DOM
-
2026-06-09days on market $265,000 Active 27 DOM
-
2026-06-08days on market $265,000 Active 26 DOM
-
2026-06-07days on market $265,000 Active 25 DOM
-
2026-06-04days on market $265,000 Active 22 DOM
-
2026-06-03days on market $265,000 Active 21 DOM
-
2026-06-02days on market $265,000 Active 20 DOM
-
2026-06-01days on market $265,000 Active 19 DOM
-
2026-05-31days on market $265,000 Active 18 DOM
-
2026-05-13$265,000 Active
ⓘ Source: listings_history table (triggers on properties + properties_extension) + one-shot
backfill from property_details.listing_events for pre-trigger history.
Tax reassessment forecast IL · Partial reset (capped growth)
- Current annual tax
- $4,553 · $379/mo
- Projected year-2 tax
- $5,284 · $440/mo
- Expected delta
- +$731/yr (+$61/mo · 16.1%)
ⓘ Screening estimate from a state-policy table — verify with the county assessor before closing.
Climate risk First Street
- Flood 1/10 Low FEMA zone X (unshaded) · 0% chance over 30 yrs
- Wildfire 1/10 Low
- Heat 3/10 Moderate 7 d/yr ≥102°F today · 15 d/yr by 30 yrs out
- Wind 2/10 Low
- Air quality 3/10 Moderate 4 unhealthy d/yr today · 4 by 30 yrs out
Nearby sold comps map
Loading sold comps map…
Walkable amenities ~0.75 mi
Loading nearby amenities…
Taxation est. · year 1
- Rental income
- $29,242
- − Mortgage interest
- −$14,844
- − Property taxes
- −$4,553
- − Insurance
- −$1,325
- − Repairs & maintenance
- −$2,339
- − Management
- −$2,339
- − Depreciation
- −$7,709
- Taxable loss
- −$3,868
- Est. tax savings @ 24.0%
- +$928
- After-tax cash flow
- $1,475/yr
For passive investors: Depreciation is non-cash, so a rental often shows a tax loss while cash-flowing — sheltering income. Rental losses are passive: they offset passive income freely, and up to $25,000/yr can offset ordinary (W-2) income if you actively participate and your MAGI is under $100k (phasing out to $0 by $150k); unused losses carry forward. On sale, claimed depreciation is recaptured at up to 25%, and gains may owe capital-gains tax (a 1031 exchange can defer both). Figures are a year-1 estimate at your 24.0% rate — not tax advice; consult a CPA.
Schools (NCES district)
- District
- Bremen Chsd 228
- NCES district ID
- 1707050
- Math proficiency
- 15% ▼ -4.00%
- Reading proficiency
- 17% ▼ -5.00%
- Median HH income
- $57,625
- Composite
- 15.32/100
- National rank
- #9327
- State rank
- #468 of 620 in IL
Livability — Midlothian
- Score
- 78/100
- State rank
- #133
- US rank
- #2433
Category grades
Schools grade is shown separately in the Schools card above.
Census & demographics
- Census place
- Midlothian, IL
- City population
- 14,445
- Population (ZIP)
- 14,445
Population outlook (Cook County) Hauer SSP2
- Today (2025)
- 5,347,519 people
- By 2030
- 5,357,703 · +0.2%
- By 2040
- 5,324,924 · -0.4%
- By 2050
- 5,230,762 · -2.2%
- By 2075
- 4,785,735 · -10.5%
- By 2100
- 4,188,836 · -21.7%
Race, ethnicity, and origin ACS 2023
- Neighborhood character
- Diverse neighborhood (Simpson 0.64)
- Race & ethnicity
- White 50% Hispanic / Latino 32% Two or more races 17% Black 9% Asian 3%
- Hispanic origin (detail)
- Mexican 27% Puerto Rican 2%
- Common ancestry
- Romanian 10% Italian 2% Iranian 2%
- Foreign-born
- 13% · Canada
- Languages at home
- 76% English-only · Spanish 18% Other Asian/Pacific 2% Arabic 1%
Political lean MEDSL · Cook
- 2024 margin
- Solid D (+42.0) · D 70.4% · R 28.4% · Other 1.2%
- 2008→2024 swing
- -11.4pp toward R · 2008: 53.4pp · 2024: 42.0pp
- All cycles
- 2024: D+42.0 2020: D+50.3 2016: D+53.0 2012: D+49.4 2008: D+53.4
Not yet ingested
- Civics
- —
Market trends
- HPI YoY
- ▼ -131.69%
- Current HPI
- 197.4879
- Rent YoY
- —
- Metro
- —
- State GDP YoY
- ▲ 1.59%
- F500 in state
- 60
Industry mix (Fortune 500 HQ in IL)
| Industry | F500 HQs | Revenue |
|---|---|---|
| Insurance | 4 | $201B |
|
||
| Consumer Goods | 4 | $87B |
|
||
| Industrial Machinery | 3 | $64B |
|
||
| Healthcare | 2 | $55B |
|
||
| Retail / Pharmacy | 1 | $148B |
|
||
| Agriculture / Food | 1 | $86B |
|
||
Price history
1 event — show timeline
- 2026-05-13 Listed $265,000 MRED as Distributed by MLS Grid
Property tax history
+11.8%/yrLatest (2023): $4,553 · +863.2% YoY. Source: county tax records.
Cash-flow waterfall
monthlySold comps — $/sqft
last 12 mo · ≤1 miLoading sold comps…