514-16 Monticello Ave · Jefferson, LA
Flood risk 7/10 · Major
- FEMA flood zone
- X
- Chance of flooding over 30 yrs
- 0.74%
- Est. flood insurance / yr
- $507 – $1,088
Fire risk 1/10 · Minimal
- Est. fire insurance / yr
- $1,269 – $2,357
Heat risk 10/10 · Severe
- Hot days now (above 108°F)
- 7 days/yr
- Hot days in 30 yrs
- 19 days/yr
Wind risk 10/10 · Severe
- Chance of severe wind over 30 yrs
- 99.0%
Air-quality risk 4/10 · Minor
- Unhealthy air days now
- 4 days/yr
- Unhealthy air days in 30 yrs
- 4 days/yr
Risk factors via First Street. Map © Google.
Why this score? — see what drove the C+ grade
The composite is a weighted blend of 9 inputs, each scored 0–100. Each bar is that input's sub-score; the figure is the points it added to the 100-point composite (weight × sub-score).
- Cash flow +30.0/30.0
- 1% rule +10.0/10.0
- DSCR +10.0/10.0
- Rent growth +3.8/5.0
- Livability +3.6/5.0
- Schools +2.5/10.0
- Condition / age +2.5/5.0
- ARV discount +0.0/15.0
- Appreciation +0.0/10.0
$249,000
🖨 Deal sheet 📄 Offer letter ✓ Due diligence
Listing remarks MLS
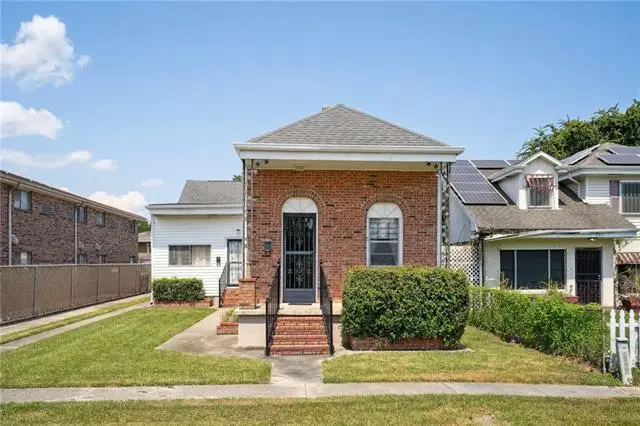
Charming 2 unit cottage in Old Jefferson just down the street from Oak St and all that it offers. Covered porch and a 1-car carport with shed. Larger owner's unit with approximately 1100 sq ft and a smaller income-producing unit with approximately 550 sq ft. Both units are occupied with long term tenants.
Key facts
- Covered porch
- Carport
- 6,098 sq ft lot
Tags
Neighborhood map
What this means for you Summary
Snapshot
- This is a 6-bed/4.0-bath single-family listed at $249k.
Deal economics
- At list price, monthly cash flow is $1k ($18k/yr) — positive.
- The deal already cash-flows at list — no discount required.
- Meets the 1% rule at list price ($4k rent vs $249k).
- Recommended offer: $227k (9.0% below list) — sets the bar for market timing.
- Cap rate 13.8% vs local median 4.6% in Jefferson — top-decile yield for the area; either an underpriced asset or a hidden risk that comps aren't pricing in. Stress-test before assuming the spread holds.
Location & tenants
- Location reads 72/100 on livability (#42 in LA) — a middle-class / working-renter tenant base. Strengths: cost of living A+, health & safety A+, housing A; Watch: employment D, amenities F, commute F.
- Jefferson Parish (suburban): math 24% / reading 34% proficiency, ranked #44 of 98 in LA (top 45%) — low school quality limits family demand, transient renter base, plan for 1-2y turnover; 70% free/reduced lunch — lower-income household profile, screen leases tightly.
- Market conditions: Rents rising fast (+5.1%/yr); 100 active listings in the ZIP; 7 comparable units currently listed for rent nearby; rentals lingering (median 44d on market — plan ~5-8 weeks vacancy on turnover, expect pricing pressure); 71% of comp listings sitting > 30 days — soft ceiling on asking rent; 518 units permitted in Jefferson Parish in 2024 (43 in 5+ unit buildings).
- At $3,960/mo this rent would consume 80% of the median local household income ($60k/yr) (locally 593% of renters already pay >50% of income on rent) — very limited rent-growth headroom before tenants either downsize or default.
Forward outlook
- Local home prices are declining (-3.0%/yr); year-one equity from $2k of loan paydown is wiped out by about $7k of value loss. Plan a longer hold.
- At projected returns (-3.0% appreciation + 5.1% rent growth), your $70k cash investment doubles in ~5 years — after that, you're playing with house money.
Negotiation context
- It's been on market 112 days — a 9% lower offer ($227k) is reasonable based on typical stale-listing flexibility.
- 3 sale attempts since 2y ago with the ask held roughly flat each time — persistent listings suggest the price (not the market) is what's stuck; bring a comps-based counter.
Risks & watch-outs
- Watch-outs: flood insurance adds $66/mo.
- Climate carrying-cost: major flood risk; severe wind risk, 99% chance of damaging wind over 30y; extreme-heat days projected 7→19/yr by 2055 (HVAC capex compounding) — expect insurance premiums to compound above CPI over the hold.
Questions for the listing agent
- It's been on market 112 days. Have you received any prior offers? Is the seller open to a 9% concession, seller financing, or rate buy-down credit?
- What's the actual annual flood-insurance premium (NFIP or private), and is the property in a SFHA with mandatory coverage?
- Why hasn't it sold? Are there any deal-killer items the seller is aware of (foundation, flood, title, zoning, code violations)?
- Is there a deadline driving the sale (1031 exchange, divorce, estate, relocation)? That informs how much negotiation room exists.
- What's the average days-on-market for RENTAL listings here right now (not sales)? A rising rental-DOM trend means longer vacancies and softer asking-rent achievability than the comps imply.
- What's the recent tenant-quality profile in this submarket — average credit score on applications, eviction rate, late-payment / NSF rate, and stable-employment percentage? A property-management company in the area should have these aggregated.
- How much new for-sale + rental construction is in the pipeline within 1–3 miles? Heavy new supply typically softens prices + rents 12–24 months out; constrained supply supports both.
Investment metrics
- 1% rule
- 1.59% ✓
- Cap rate
- 13.76%
- Cash-on-cash
- 26.66%
- DSCR
- 2.19
- GRM
- 5.2
CMA / ARV
- ARV (median comp)
- $178,265
- List price
- $249,000
- Delta
- 39.68%
- Verdict
- OVERPRICED
- Comps
- 20 within 1.0 mi
Projected returns pro-forma
-3.0% appreciation · 5.1% rent growth · sell at horizon
- IRR
- 21.4%
- Equity multiple
- 1.90×
- Total profit
- $62,644
- Equity at exit
- $37,127
- IRR
- 30.9%
- Equity multiple
- 4.05×
- Total profit
- $212,802
- Equity at exit
- $21,529
Cash invested: $69,720 (down + closing). Projections, not guarantees.
Landlord ↔ Tenant lean methodology
- Overall (STATE)
- 90 Strongly Landlord-Friendly
- State Louisiana
- 90 Strongly Landlord-Friendly · R+12
- County
- — inherits STATE
- City
- — inherits STATE
ZIP-level market 70121
- Rents YoY
- 5.1%
- Active inventory
- 100
- Price-to-rent
- 5.2×
Monthly cashflow live
- Estimated rent
- $3,960 high interval (Pro) →
- Mortgage (P&I)
- −$1,306
- Tax from tax record
- −$170 /mo · $2,038/yr
- Insurance
- −$104
- Flood insurance flood zone
- −$66 /mo · $798/yr
- HOA
- −$0
- Vacancy / Maint / Mgmt
- −$832
- Net cashflow
- $1,483
Break-even live
UW: 25.0% down · 7.5% · 30yr · 1.5% tax · 5.0% vac · 8.0% maint · 8.0% mgmt
Financing live
Cash to close
- Down payment
- $62,250
- Closing costs
- $7,470
- Reserves months
- —
- Total cash needed
- —
Loan-product check · same deal, 3 products live
Conventional
25% down · 7.5% · 30yr
- Down + closing
- —
- Monthly P&I
- —
- Monthly cashflow
- —
- DSCR
- —
- Eligible?
- —
Personal DTI + credit; lowest rate.
DSCR
20% down · 8.5% · 30yr
- Down + closing
- —
- Monthly P&I
- —
- Monthly cashflow
- —
- DSCR
- —
- Eligible?
- —
No personal income docs; deal must DSCR.
Hard money
10% down · 12.0% · 12mo
- Down + closing
- —
- Monthly P&I
- —
- Monthly cashflow
- —
- DSCR
- —
- Eligible?
- —
Short-term bridge; refi at stabilization.
Rent comps 7 comps
| Address | Beds | Baths | Sqft | Rent | $/sqft | DOM | Units | Dist |
|---|---|---|---|---|---|---|---|---|
| 1736 Pine St New Orleans, LA | 5.0 | 2.0 | 1494 | $4,500 | $3.01 | 24d | 1 | 1.10mi |
| 1609 Broadway St New Orleans, LA | 5.0 | 2.0 | 1776 | $5,000 | $2.82 | 44d | 1 | 1.20mi |
| 7011 Jeannette St Unit A New Orleans, LA | 5.0 | 3.0 | 2200 | $5,000 | $2.27 | 44d | 1 | 1.27mi |
| 7015 Willow St New Orleans, LA | 5.0 | 3.0 | 2000 | $4,200 | $2.10 | 44d | 1 | 1.30mi |
| 939 Broadway St New Orleans, LA | 5.0 | 3.0 | 1900 | $4,000 | $2.11 | 3d | 1 | 1.32mi |
| 6321 S Prieur St New Orleans, LA | 6.0 | 2.0 | 1900 | $4,200 | $2.21 | 44d | 1 | 1.45mi |
| 6326 S Johnson St Unit 1 New Orleans, LA | 5.0 | 2.0 | 2013 | $3,950 | $1.96 | 44d | 1 | 1.46mi |
Listing history 17 events
-
2026-06-18days on market $249,000 Active 112 DOM
-
2026-06-17days on market $249,000 Active 111 DOM
-
2026-06-16days on market $249,000 Active 110 DOM
-
2026-06-15days on market $249,000 Active 109 DOM
-
2026-06-13days on market $249,000 Active 107 DOM
-
2026-06-10days on market $249,000 Active 104 DOM
-
2026-06-09days on market $249,000 Active 103 DOM
-
2026-06-08days on market $249,000 Active 102 DOM
-
2026-06-07days on market $249,000 Active 101 DOM
-
2026-06-03days on market $249,000 Active 97 DOM
-
2026-06-02days on market $249,000 Active 96 DOM
-
2026-06-01days on market $249,000 Active 95 DOM
-
2026-05-31days on market $249,000 Active 94 DOM
-
2026-02-26$249,000 Active 306-char remark
Show marketing remark (306 chars)
Charming 2 unit cottage in Old Jefferson just down the street from Oak St and all that it offers. Covered porch and a 1-car carport with shed. Larger owner's unit with approximately 1100 sq ft and a smaller income-producing unit with approximately 550 sq ft. Both units are occupied with long term tenants.
-
2026-02-20status Active
-
2025-01-27price $249,000
-
2024-08-19$259,500 Active
ⓘ Source: listings_history table (triggers on properties + properties_extension) + one-shot
backfill from property_details.listing_events for pre-trigger history.
Tax reassessment forecast LA · Resets to sale price
- Current annual tax
- $2,038 · $170/mo
- Projected year-2 tax
- $2,038 · $170/mo
- Expected delta
- $0/yr ($0/mo · 0.0%)
ⓘ Screening estimate from a state-policy table — verify with the county assessor before closing.
Climate risk First Street
- Flood 7/10 Severe FEMA zone X · 74% chance over 30 yrs
- Wildfire 1/10 Low
- Heat 10/10 Extreme 7 d/yr ≥108°F today · 19 d/yr by 30 yrs out
- Wind 10/10 Extreme 99% chance of damaging wind over 30 yrs
- Air quality 4/10 Moderate 4 unhealthy d/yr today · 4 by 30 yrs out
Nearby sold comps map
Loading sold comps map…
Walkable amenities ~0.75 mi
Loading nearby amenities…
Taxation est. · year 1
- Rental income
- $47,523
- − Mortgage interest
- −$13,948
- − Property taxes
- −$2,038
- − Insurance
- −$2,042
- − Repairs & maintenance
- −$3,802
- − Management
- −$3,802
- − Depreciation
- −$7,244
- Taxable income
- $14,647
- Est. tax owed @ 24.0%
- −$3,515
- After-tax cash flow
- $14,278/yr
For passive investors: Depreciation is non-cash, so a rental often shows a tax loss while cash-flowing — sheltering income. Rental losses are passive: they offset passive income freely, and up to $25,000/yr can offset ordinary (W-2) income if you actively participate and your MAGI is under $100k (phasing out to $0 by $150k); unused losses carry forward. On sale, claimed depreciation is recaptured at up to 25%, and gains may owe capital-gains tax (a 1031 exchange can defer both). Figures are a year-1 estimate at your 24.0% rate — not tax advice; consult a CPA.
Schools (NCES district)
- District
- Jefferson Parish
- NCES district ID
- 2200840
- Math proficiency
- 24% ▼ -36.00%
- Reading proficiency
- 34% ▼ -30.00%
- Median HH income
- $48,421
- Composite
- 25.19/100
- National rank
- #7511
- State rank
- #44 of 98 in LA
Livability — Jefferson
- Score
- 72/100
- State rank
- #42
- US rank
- #6166
Category grades
Schools grade is shown separately in the Schools card above.
Census & demographics
- Census place
- Jefferson, LA
- County
- Jefferson Parish · 426,999 people
- City population
- 10,558
- Metro
- New Orleans-Metairie, LA
- Population (ZIP)
- 10,558
- Household income
- $59,562
- Rent vs Own
- Severe rent burden
- 593.0
Population outlook (Jefferson County) Hauer SSP2
- Today (2025)
- 451,696 people
- By 2030
- 455,451 · +0.8%
- By 2040
- 458,308 · +1.5%
- By 2050
- 461,031 · +2.1%
- By 2075
- 476,351 · +5.5%
- By 2100
- 499,377 · +10.6%
Race, ethnicity, and origin ACS 2023
- Neighborhood character
- Majority White (63%)
- Race & ethnicity
- White 63% Black 19% Hispanic / Latino 13% Two or more races 9% Asian 2%
- Hispanic origin (detail)
- Mexican 2% Cuban 1%
- Common ancestry
- Lithuanian 14% Slovak 2% Italian 1%
- Foreign-born
- 8% · Canada, Jamaica, China
- Languages at home
- 88% English-only · Spanish 9% Other Indo-European 1% French/Haitian/Cajun 1%
Political lean MEDSL · Jefferson
- 2024 margin
- R (+12.9) · D 42.5% · R 55.5% · Other 2.1%
- 2008→2024 swing
- +13.6pp toward D · 2008: -26.6pp · 2024: -12.9pp
- All cycles
- 2024: R+12.9 2020: R+11.1 2016: R+14.8 2012: R+18.4 2008: R+26.6
Not yet ingested
- Civics
- —
Market trends
- HPI YoY
- ▼ -134.66%
- Current HPI
- 107.0611
- Rent YoY
- ▲ 5.10%
- Metro
- New Orleans-Metairie, LA
- State GDP YoY
- ▲ 3.29%
- F500 in state
- 10
Industry mix (Fortune 500 HQ in LA)
| Industry | F500 HQs | Revenue |
|---|---|---|
| Telecommunications | 2 | $23B |
|
||
| Utilities | 1 | $12B |
|
||
| Wholesale / Distribution | 1 | $5B |
|
||
| Advertising | 1 | $2B |
|
||
Price history
-4.0% since first listed4 events — show timeline
- 2026-02-26 Listed $249,000 AcadianaMLS
- 2026-02-20 Relisted — AcadianaMLS
- 2025-01-27 Price Changed $249,000 AcadianaMLS
- 2024-08-19 Listed $259,500 AcadianaMLS
Property tax history
+2.3%/yrLatest (2025): $2,038 · +0.2% YoY. Source: county tax records.
Cash-flow waterfall
monthlySold comps — $/sqft
last 12 mo · ≤1 miLoading sold comps…